
by Neil Kearney | May 23, 2012 | Boulder County Housing Trends, Statistics
It’s been very busy time in the Boulder real estate market (unfortunately not much time to update my blog)! Remember when a buyer  needed to see a house the same day it came on the market? Well, we are back in that mode. Over the weekend I was working with two clients and both were interested in a property they viewed. Immediately after showing the properties and learning of my clients interest I called the listing agent to learn what I could about the situation. In both cases there was already an offer on the table and my clients had just a few hours in which to submit an offer in order to be considered equally with the first one. Talk about pressure.
The cycle for buyers is needlessly to say very fast. The cycle has also quickened for sellers. In the recent past, a seller would put their home on the market, wait a few weeks and see if anyone would come. Hopefully an offer would be made in a reasonable time like a month or two. Now if you don’t have multiple showings on the first few days (one recent listing of mine had 9 on the first day) you know that you either missed the price or that there isn’t much of a market for your home. If it isn’t sold within a few weeks your old news, hoping new buyers come to the market.

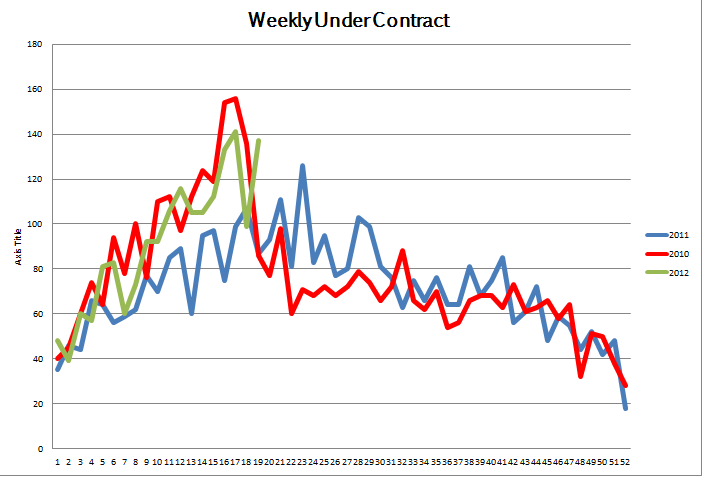
The graph below shows the last three years of market activity on a weekly basis. Specifically, it shows the number of homes that went under contract during each week. The green line is 2012 and shows a big breakthrough in activity. The red line is 2010 and shows the big spike in activity caused by the tax credit. We have now broken through that invisible barrier. How long will it last? I expect it to start slowing in June but the market conditions have definitely shifted.
by Neil Kearney | May 10, 2012 | Boulder County Housing Trends, Statistics
The market is very strong right now. We are in the midst of the spring buying season, interest rates are low and we are coming off a prolonged slow period. In the last few days we have placed a few very popular listings on the market. On Monday Jo Kearney (don’t forget Mother’s Day), listed 375 Erie Drive. It is a home in Frasier Meadows in Boulder that has great bones but needed a cosmetic remodel. It was listed for $550,000 and obviously it was viewed as a good opportunity. By Tuesday evening there were six offers on the table! The home went for well above asking price. Yesterday, I listed 984 Dahlia Street in Louisville for $409,000. After 9 showings on the first day we had two offers on the table. It too went for above list price. This feels like old times.
But not every seller is so lucky. The market rally is broad but it is not market wide. Below are a few graphs that will help show where the activity is in the Boulder area real estate market.

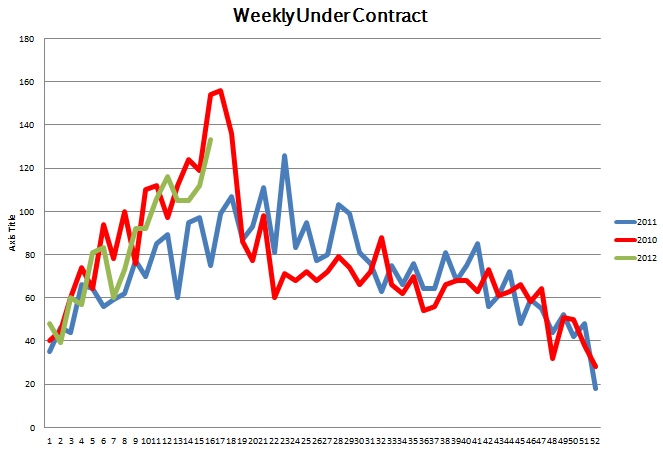
The chart below shows weekly data of homes that have gone under contract over the past 3 years.

The chart above shows strong activity in all areas but the Suburban Mountains.

The chart above shows clearly that as the price range rises the activity in the market falls.

by Neil Kearney | May 6, 2012 | Boulder County Housing Trends, Statistics
The spring real estate market in Boulder is in full swing! In fact the market has swung so far that it must have had  a big push! Sales are up 16.5% year-to-date in all areas of Boulder County and more impressively, sales improved 28.5% from last April. More importantly, the mood of the market has shifted. There is a buzz in the market. As an example, as I write this on Sunday night at 8:15, I just got a call from a Realtor whose client saw one of my new listings hit an internet site and she was afraid that she had missed something. I told her that it would be on the MLS by mid-week. She was relieved and was working hard to make sure that she was working for her clients. Buying a home right now in Boulder County is not just a once in awhile thing, it has to be an ongoing effort. In many market segments it’s a race.
The other eye-popping statistic in the slideshow above is that as of May 1st, 40% of the active listings in Boulder County already had an accepted contract. This is over double the rate of a normal/good market. Combine this with the fact that the number of listings is down 10% from last year, and you get a sense of lack on the part of buyers. This is good news for sellers.
The luxury market has largely not participated in the strong market activity this spring. As of today, sales are down 3 units year to date for properties over $1.5 million and just 8% of listings are under contract.
Now the true test of the market is the longevity of the strong market activity. I have been saying for over a year that there is pent up demand waiting for the time when the market is “good”. Maybe now is that time.
by Neil Kearney | Apr 19, 2012 | Boulder County Housing Trends, Statistics
The Denver Post’s above the fold story was headlined “Denver housing market second in nation for quick sales”. The article gave anecdotal evidence that the real estate hibernation is over. Not just for the winter but for the economic downturn as well. Multiple offers are not uncommon and good properties are going under contract very quickly. To read the entire article go to: Denver housing market second in nation for quick sales – The Denver Posthttp://www.denverpost.com/business/ci_20429074/denver-housing-market-second-nation-quick-sales?IADID=Search-www.denverpost.com-www.denverpost.com#ixzz1sYBvkSce
What is true for Denver real estate is true for Boulder real estate as well. Currently 29% of all listings are already under contract. Right now is the middle of what is traditionally the busiest time of the year in the Boulder CO real estate market. What is impressive is the improvement we have seen since last year. The graph below shows that this years sales activity is just below what we saw in the tax credit skewed 2010 year when sales spiked just before the April 30th deadline. 2012 is shown in green.


by Neil Kearney | Apr 13, 2012 | Colorado Lifestyle, Photos

The moon was lingering over The Flatirons this morning and the sky was crisp and clear. A beautiful morning for a hike at Chautauqua.

