The Aftermath of the Colorado Floods
Flickr photo courtesy of JgColorado
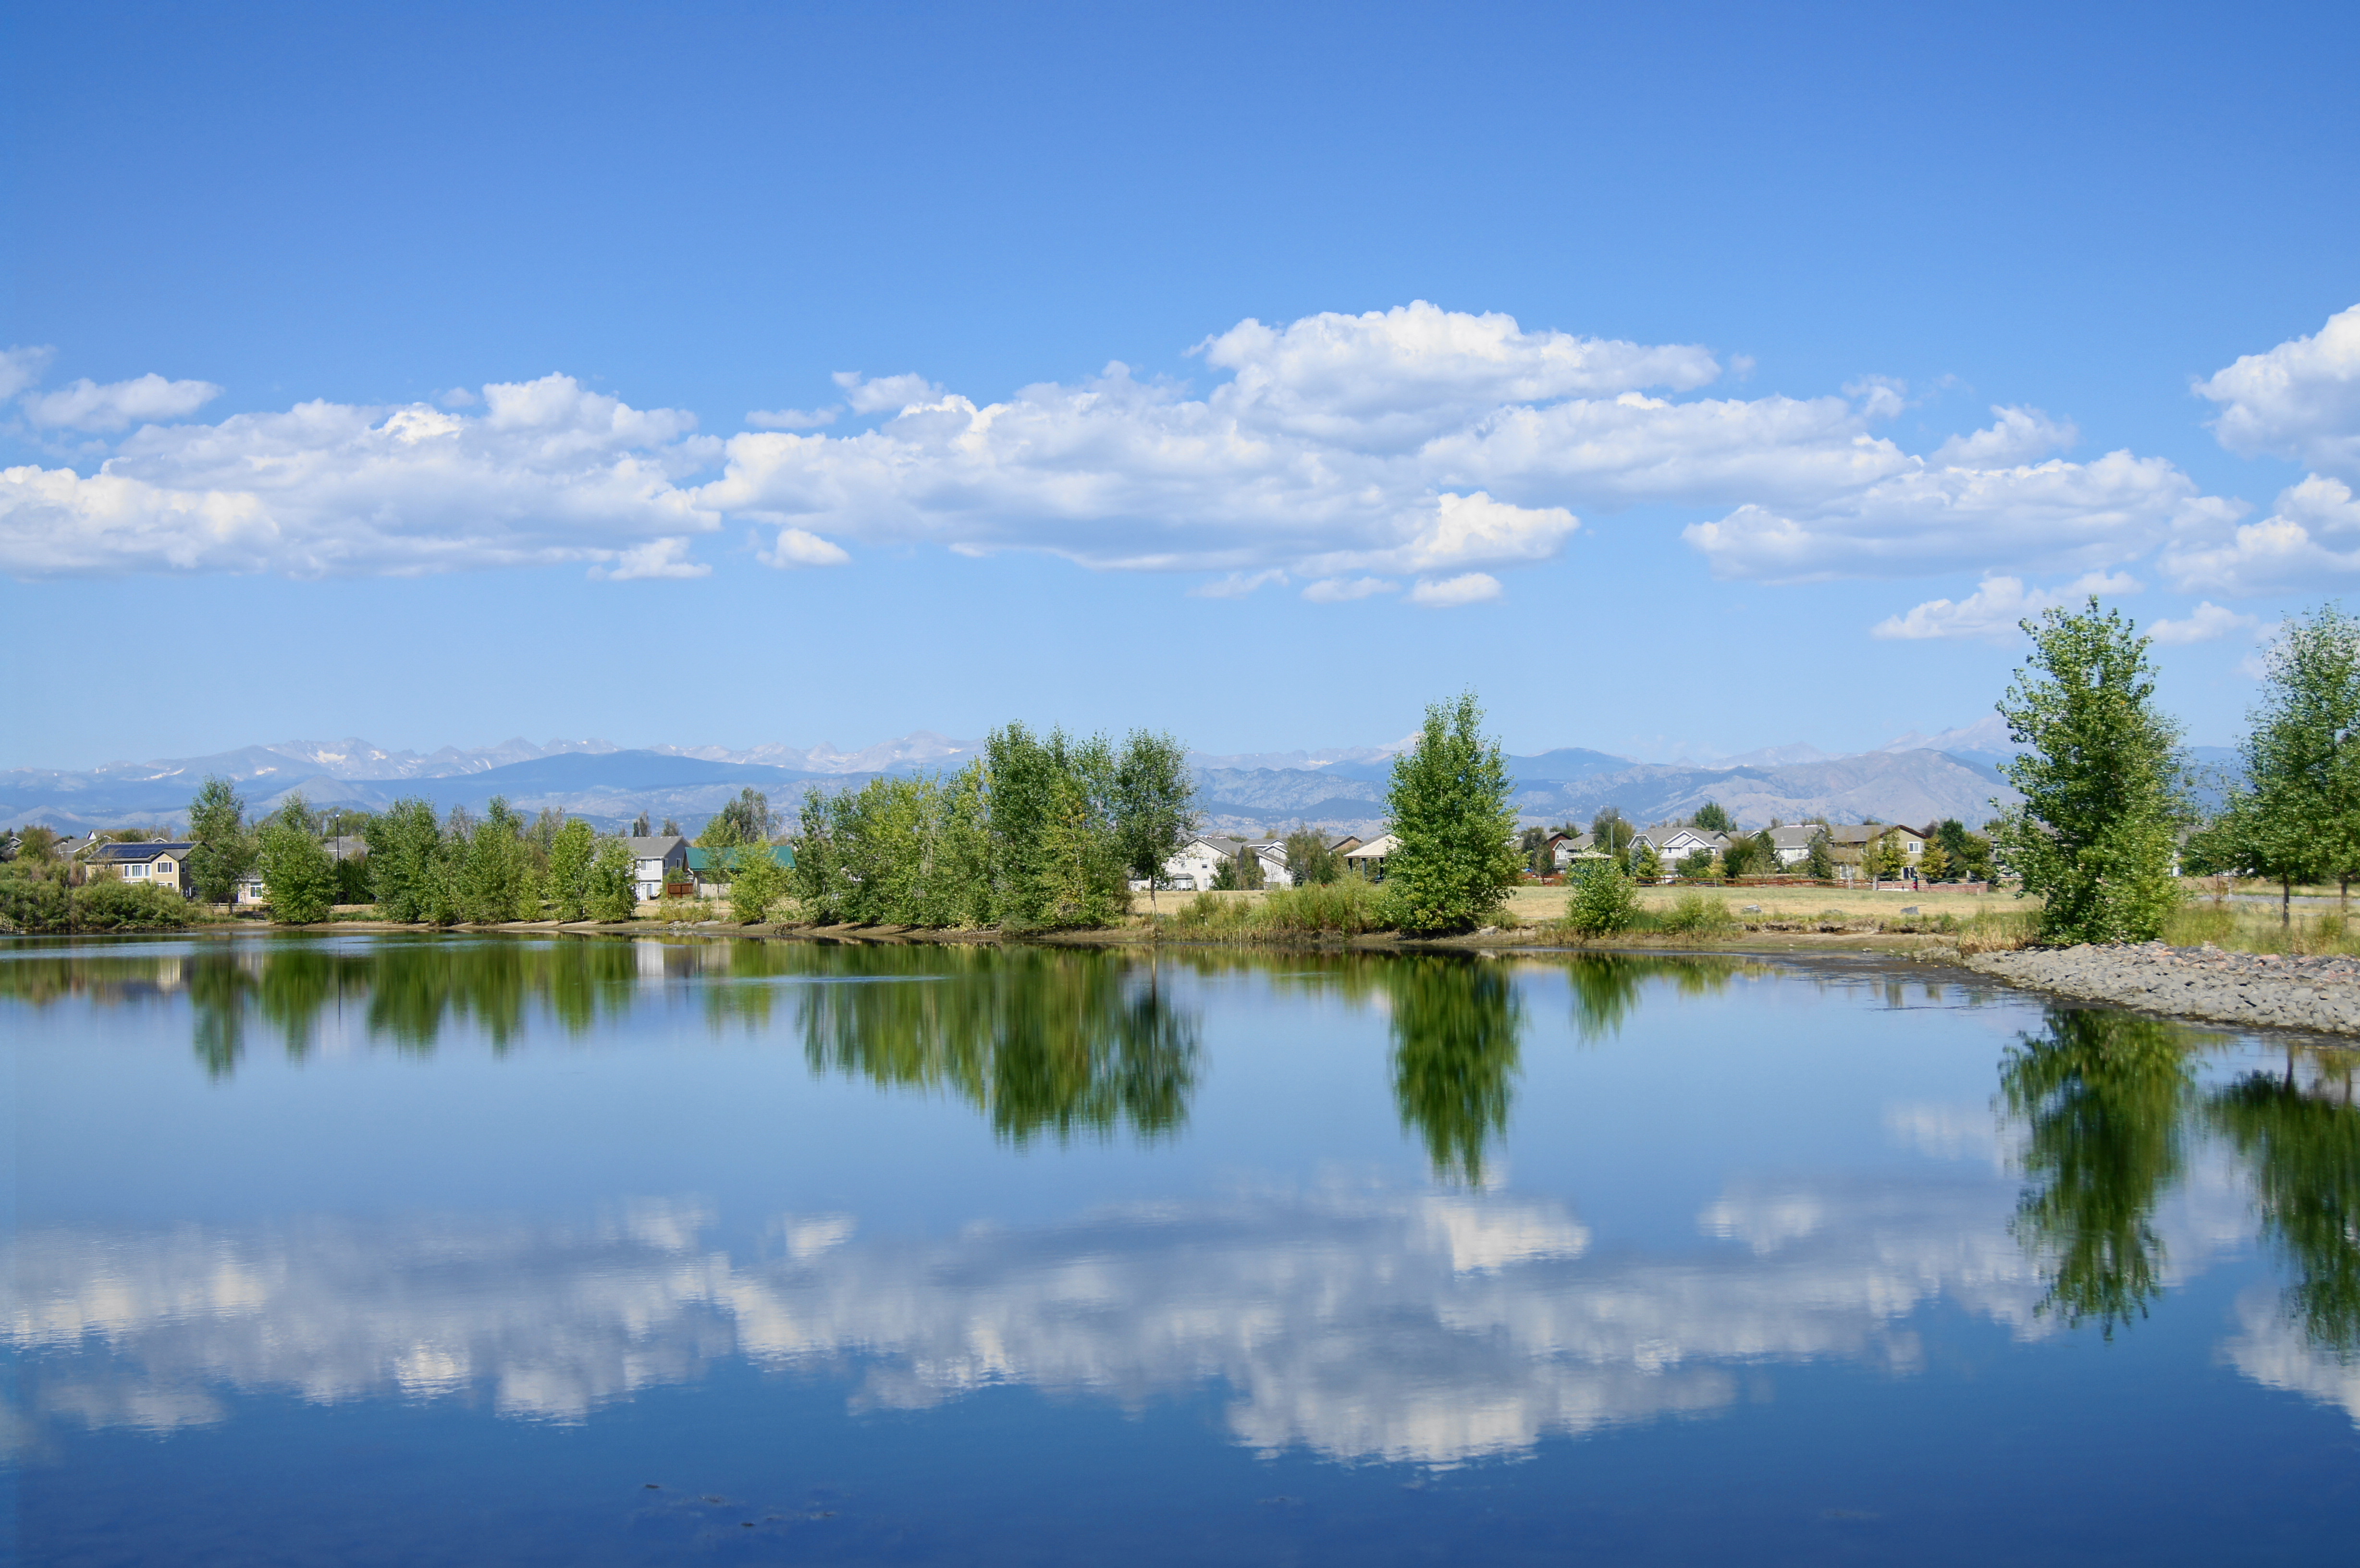
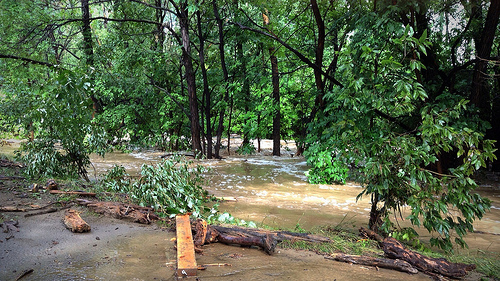
Colorado is a semi-arid region. In Boulder, we average just under 25 inches of precipitation. Our normal weather this time of year is clear and crisp with warm days and cool nights. If we do get rain, it comes from the west over the mountains and quickly passes to the east where the large storms form and move like islands across the Great Plains. However, starting on Monday September 9th, the convergence of a monsoon flow from the south met a stalled cool front from the north caused an unprecedented amount of rainfall. During a six day period we received almost 75% of our annual expected rainfall. The result was massive flooding. Here are some of my thoughts regarding what has happened and what might happen next. The Daily Camera has a comprehensive series of articles on the flood posted here. What I present here is just a small slice of the story as it pertains to me and to what I pay attention to. The Event:
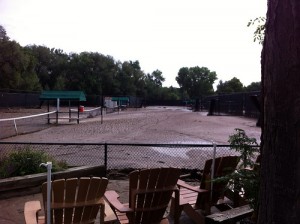
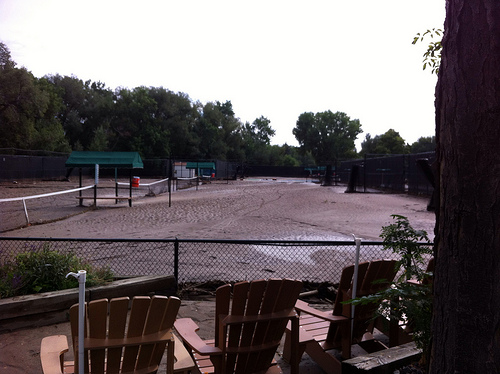
- When you think flooding, you think of major waterways becoming overwhelmed by water from the tributaries. What happened here was the result of wide spread, sustained rain that caused every ditch, canal and drainage to fill and many times overflow with water. The City of Boulder has made some great decisions over the years as the area around Boulder Creek was developed. Adjacent bike paths and designed drainage areas mainly contained Boulder Creek in a manageable way. Where the real damage was done was on the minor waterways and from sewer backups which resulted from the overwhelming of the system by rain and floodwater.
- Flooded basements were very common around town. There have been a few reoccurring stories of how basements filled with water. 1) As water ran down streets, through alleys and through yards water found its way into window wells, doorways and through vents into basements and crawlspaces. 2) As groundwater rose, water came up through the floor. This is what happened to us. Our sump pit had been bone dry for 7 years and when the time came for the pump to do its job we found that is was DOA. After bailing manually for a few hours we gave up and moved our stuff upstairs. A few hours after abandoning our efforts the water rose to 2.5 inches. 3) The third and most troubling way water found its way into local basements was through the floor drains or toilets in the form of a backup from the city sewer line. In the end, thousands and thousands of basements were flooded to the point where major cleanup was necessary.
-
Flickr photo courtesy of sebrenner
Regionally there was major damage to the infrastructure. The town of Lyons has been evacuated and the water and sewer infrastructure are inoperable. There is not a timeline established as to when residents will be able to move back in. Our mountain towns were hit especially hard with road damage. Many routes are impassible and it’s going to take many years for the rebuilding to take place.
The Cleanup:
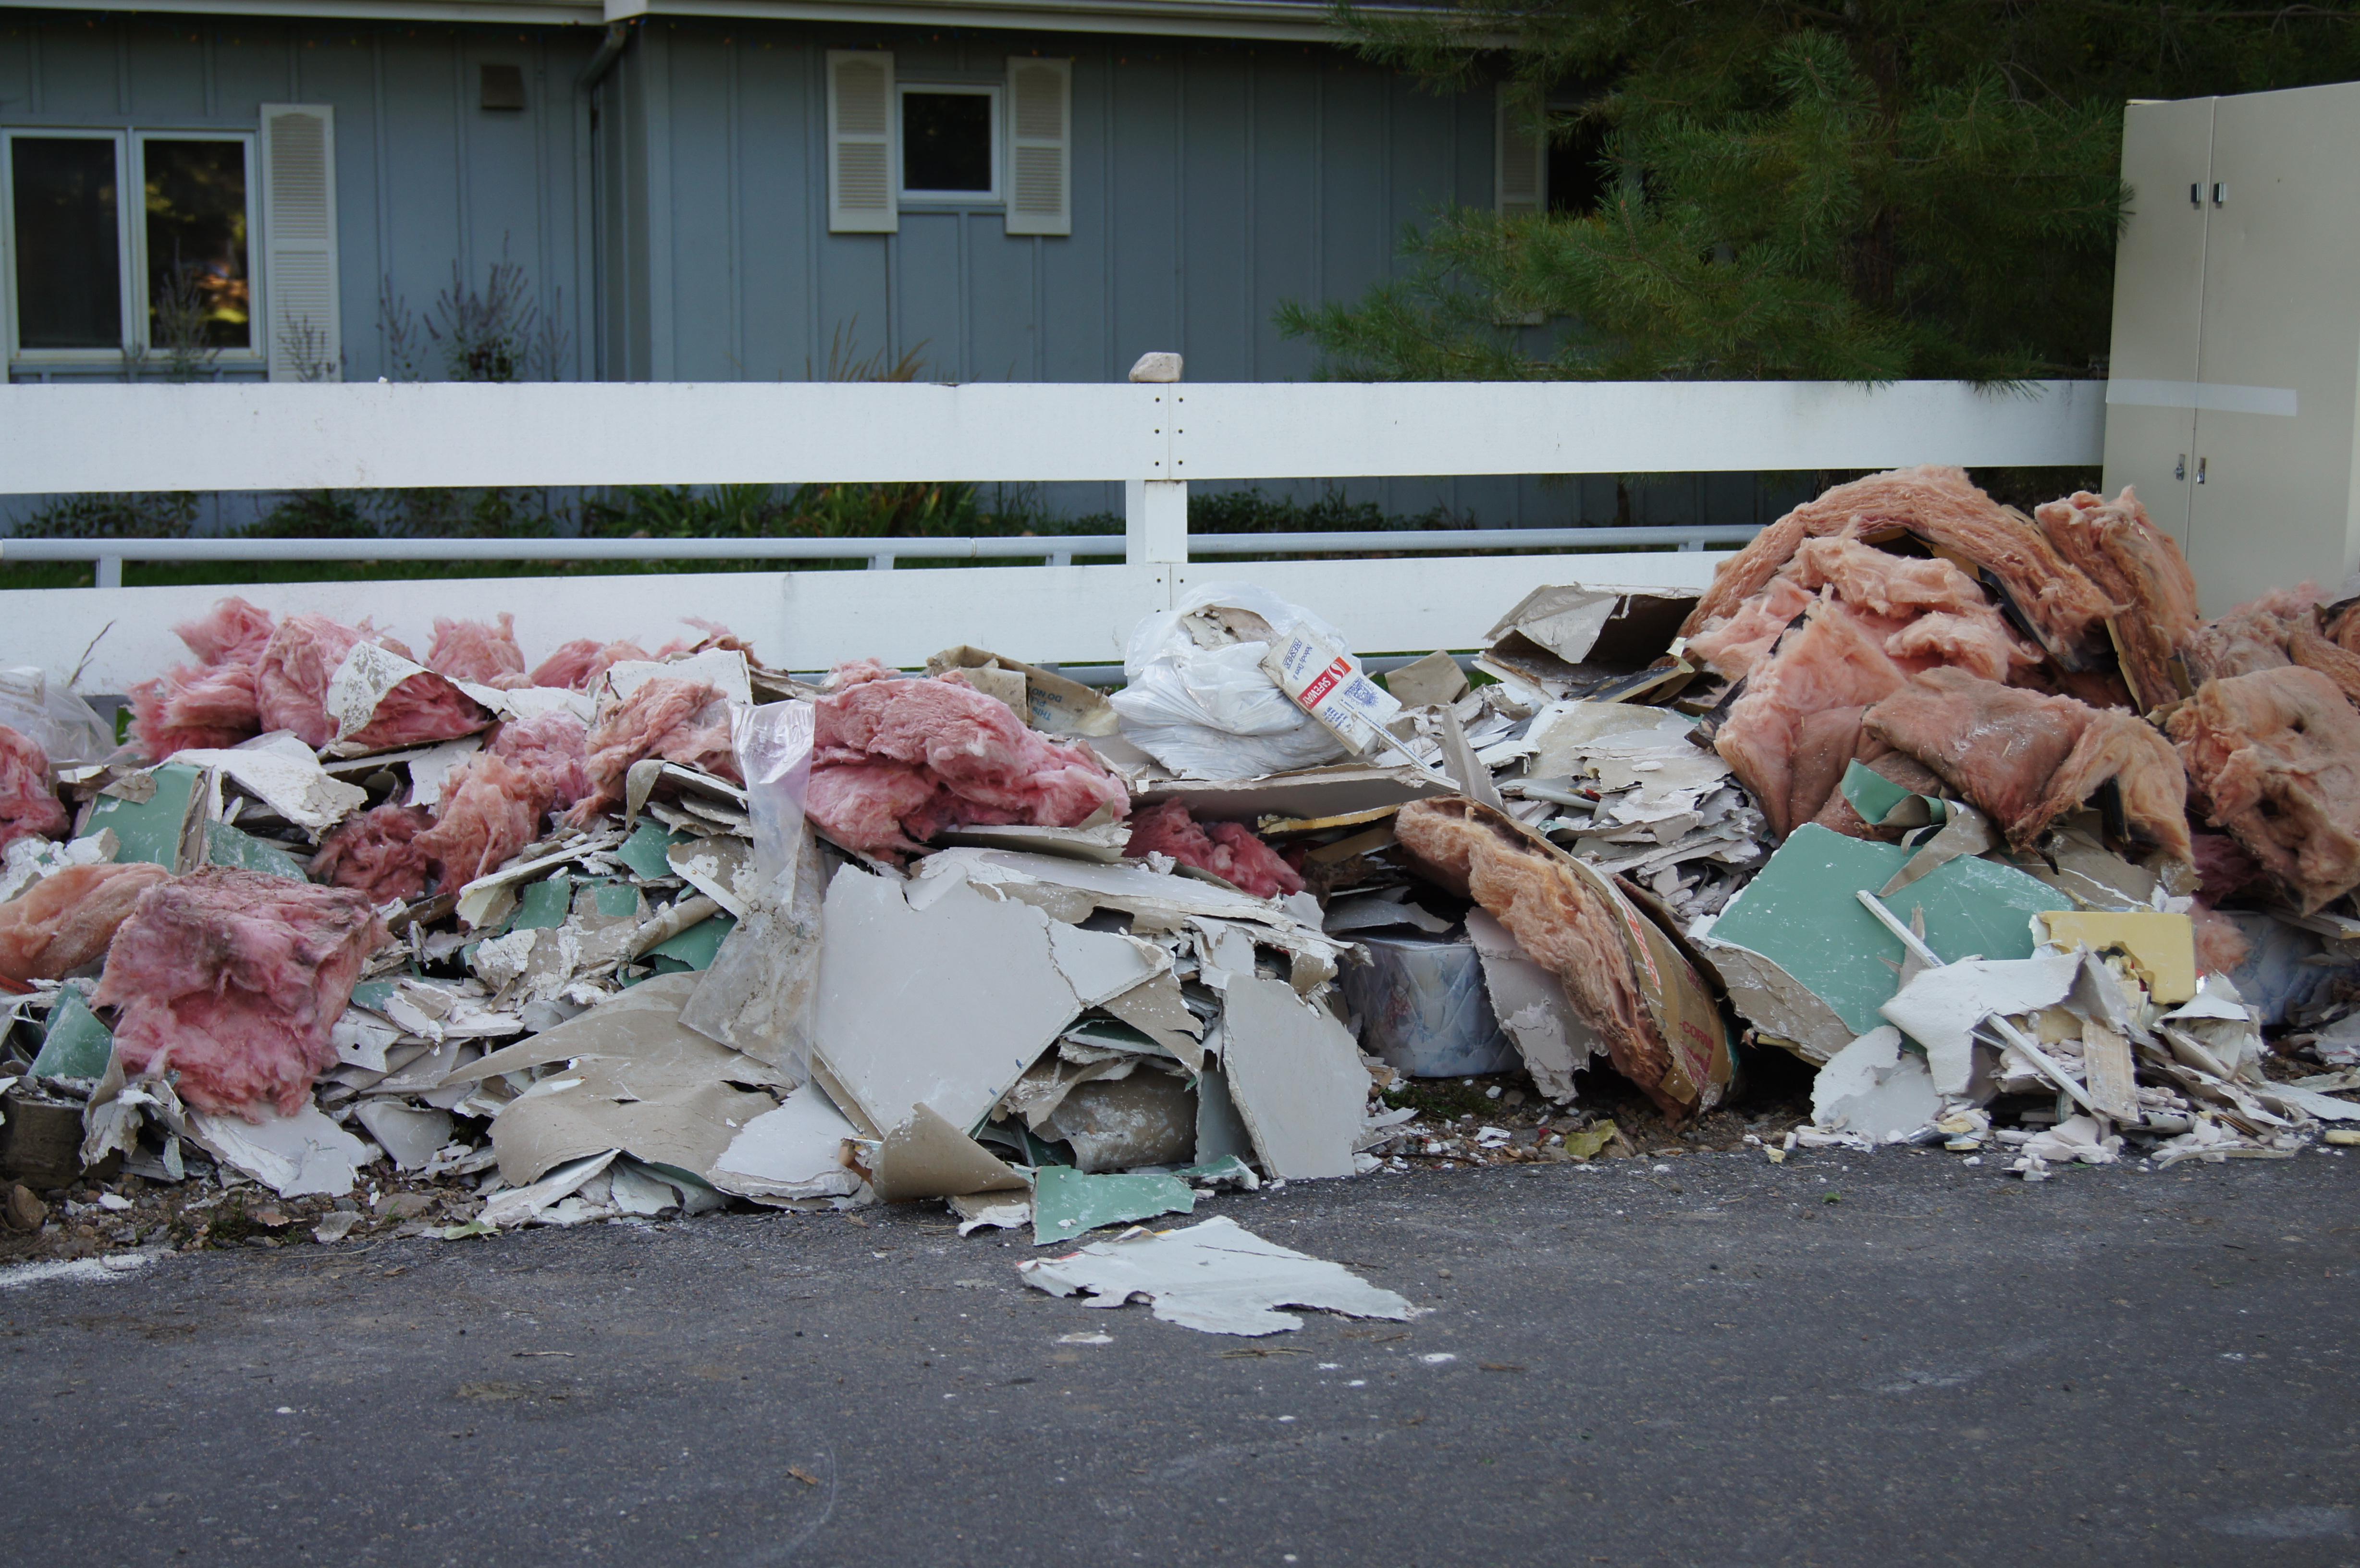
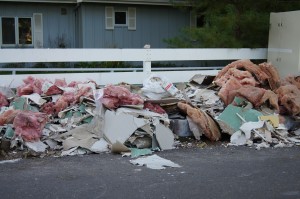
- As the rains subsided and the water ran downstream the damage to homes became apparent. I started Friday the 13th by cutting out and hauling outside a thoroughly soaked carpet and pad. We also had to move out all of the other stuff that was in storage. Many of it was lost due to water damage. So long old yearbooks, school notes and files. The city in conjunction with Western Disposal began to set out roll off dumpsters from residents to place flood damaged debris. Many of these locations were overrun and the overflow of destroyed items took over parking lots and streets.
- Cleanup is hard work and for those with sewage festering in the basement it is a dangerous and dirty job. The local restoration, cleanup companies were overwhelmed with the calls and soon there were trucks from all over the country in town to help with the cleanup. I’m lucky, I am handy, healthy and have the help of my family and the four of us were able to clear out, dry out, cut out the bottom 8 inches of drywall and haul it all away. But many needed others to help and while there were many, many volunteers who were the saving grace to some, many have been forced to pay the huge sums charged by cleanup companies to do the work. A typical charge was over $5000 to do the work.
What’s Next:
 Hardship: Most people have figured out by now that flooding of any sort isn’t covered by the typical homeowners insurance. This means that the cost of cleanup and repair will come directly out of personal back accounts. This hurts for some and is impossible for others. I suspect that many basements that were formally finished will remain at least partially unfinished for quite some time.
- Rebuilding: Being in the carpet, roofing or drywall business would be good right about now. There will be a huge effort to get work done and I suspect that many contractors will be busy for months to come making repairs, installing carpets and doing work that will help prevent it from happening again.
- Changes: We have been dodging this flood for a long time. We were overdue and historically we have flood events to some extent every 10 years or so. So what we can best do now beyond rebuilding is to learn from this and make sure we are better prepared for the future. This will hopefully happen at the community level but it needs to happen at the individual level as well. Each of us needs to make sure that we have the right tools (there were 1,000 people in line to get sump pumps on Saturday morning when a truckload arrived) and make sure our drainage is as minor as it could be.
The Real Estate View:
- Under Contract: I don’t have exact statistics on this but I heard many stories about damage to houses that were under contract getting ready to close. I lucked out, all of my pending sales were high and dry and my listings mostly made it out unscathed. What happens if there is damage to a house right before closing? Paragraph 19.1 in the Colorado Contract to Buy and Sell Real Estate address this instance. It says that the seller is obligated to repair any damage. If the damage isn’t fixed by closing or if the total damage exceeds 10% of the contract price then the buyer has a right to terminate the contract or to continue with the contract and work out the details of payment and repair with the seller and the insurance company.
- Disclosure: Sellers are required to disclose whether there has ever been any water problems in the house. There was a huge percentage of homes that had never had any water and now have to say “yes”. It is now important for sellers and those who will sell in the future (yes, this means you) to document the extent of the water, explain the reason and detail the cleanup methods and timing.
- Flood maps: It turns out that flood maps are theoretical and inaccurate. I have seen where the flow of Boulder Creek was characteristic of a 50 year flood. On the other hand, neighborhoods were flooded out that were outside of the 500 year flood zone. The bottom line is that the maps will need to be redrawn with actual data. I’m guessing the result will be more people in the flood zone.
- Insurance: Most people don’t have flood insurance. If you are outside the 100 year flood zone on the official maps flood insurance is optional. Homeowners insurance doesn’t include flood damage so most people with damage are left without financial assistance. FEMA assistance is available to those with damage (Call 800-621-3362) and many will be taking out loans to re-build. We had sump-pump rider on our policy and ended up with a check for $1500 which will help with new carpet and drywall repair.
After living in Boulder for over 40 years I now have a new appreciation for what is possible. I know I will be looking at real estate with a different eye.