
by Neil Kearney | Mar 19, 2020 | Boulder County Housing Trends, Videos
In the video above I give my perspective on how the current world situation is affecting the local real estate market as of now. Of course this situation changes daily and is subject to change but here are my current observations. The graphs below are featured in the video.
by Neil Kearney | Mar 10, 2020 | Uncategorized
Amid other pressing matters, here is a quick update on the Boulder County real estate market and statistics using the data available at the beginning of March. The real estate market has been very strong over the last three months. Sales are up double digits from a year ago, inventory is again falling and there have been many multiple offer situations so far this year. Going forward it will be very interesting to see how the worldwide health situation and the stock market drop and volatility will affect the local real estate market. In the short run interest rates will be positively affected. My guess is that higher priced homes will feel a definite slow down and lower price points won’t be as affected. Low mortgage rates help those with high mortgage balances the most, but locally, buyers of high priced homes tend to also have high down payments and money invested in the stock market.
See the ten slide, slideshow below for more commentary and details.
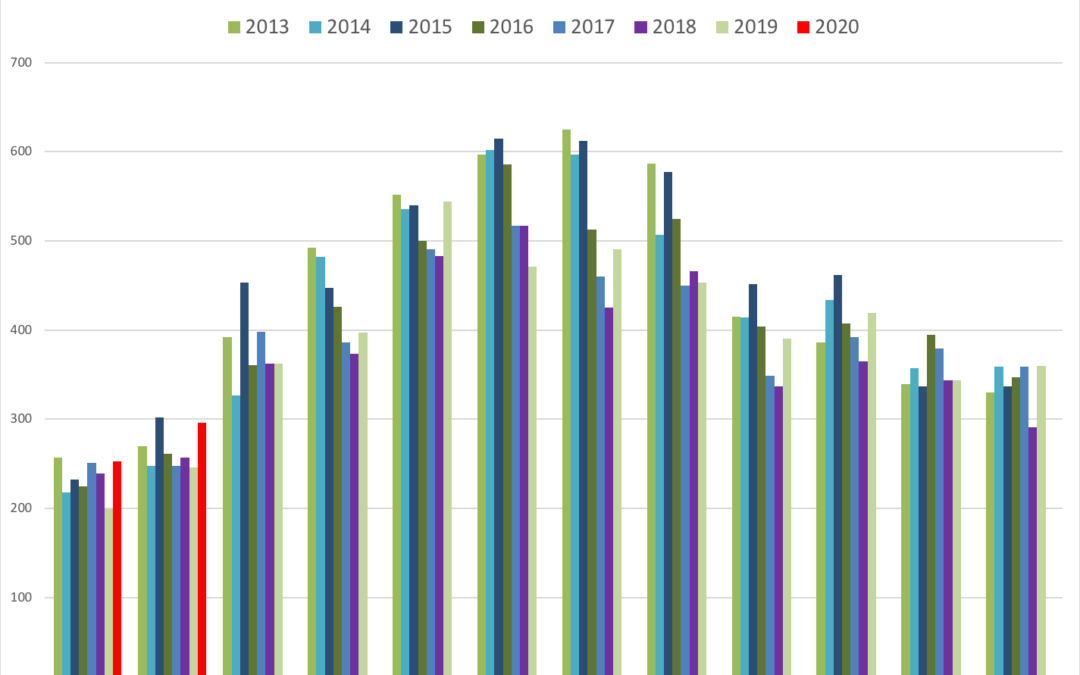
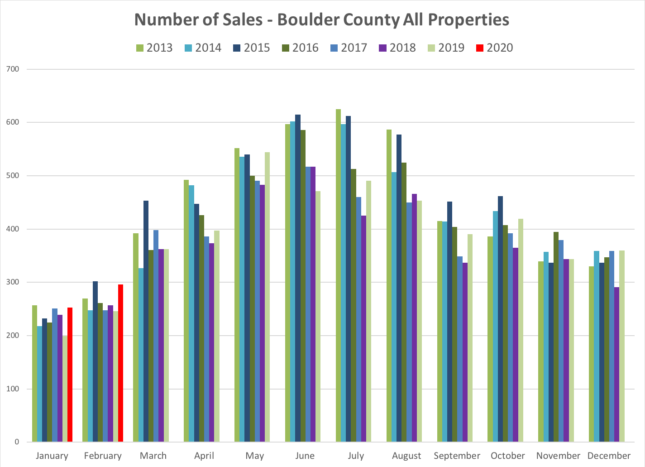
The first graph below shows sales on a monthly basis over the past eight years. The red bars on the left side show the strong sales recorded so far this year compared to past years.
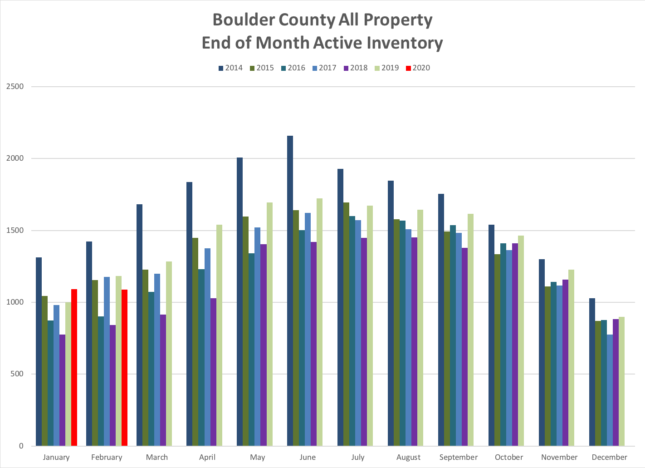
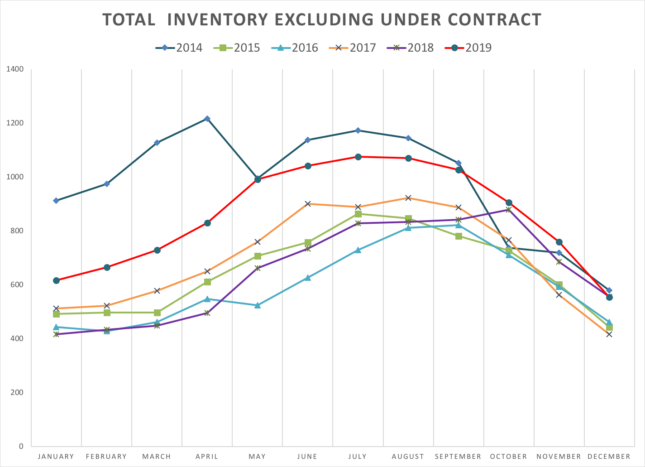
The graph below shows the total number of homes available at the end of each month since 2014. After a showing gains in inventory in 2019, we are seeing a drop due to strong sales.
by Neil Kearney | Feb 14, 2020 | Listings
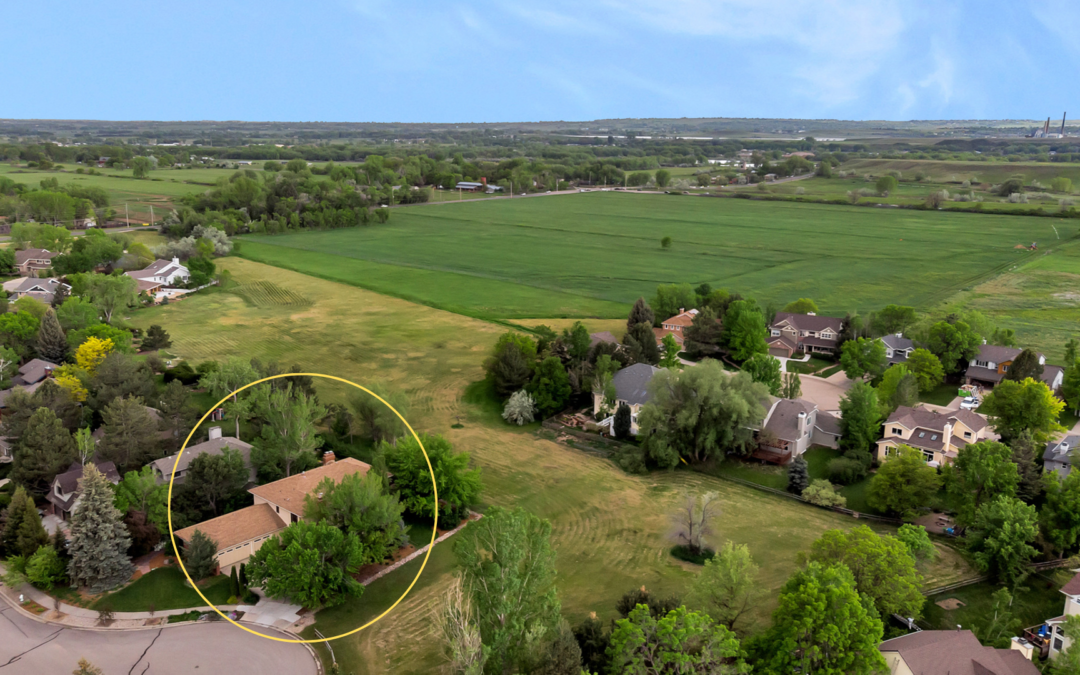
Beautiful + Large Home Surrounded by Private Open Space
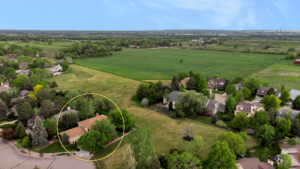 You will love this gorgeous, large home surrounded by HOA open space on two sides. This custom home features a fabulous, recently remodeled gourmet kitchen, comfortable and bright living areas, beautiful finishes, five large bedrooms, and an oversized three car garage. Located at the end of a large cul-de-sac with extensive open land to the side and behind, it’s a very short walk to parks, HOA pool, and the Twin Lakes trail system. A hidden gem just five easy miles to downtown Boulder.
- High-end Appliances (Including: Double Oven, Warming Drawer, Microwave, Refrigerator, Dishwasher)
- Beautiful custom knotty alder cabinetry, slab granite countertops, large island with seating for five.
- Induction cooktop and two kitchen sinks. Large pot filler at stovetop.
- Three fireplaces including a stacked stone surround in the family room
- Oversized three car garage
- Nest thermostat
- Many quality built-ins including a mud-room entry from the garage with individual lockers and drawers
- Large back patio
- Partially finished basement with the fifth bedroom and a large recreation room
- Four large bedrooms and three full bathrooms upstairs
- Five inch baseboard trim on main level
- Hickory floors
- Beautiful main floor half bath with wall of tile and decorative sink

by Neil Kearney | Feb 8, 2020 | Boulder County Housing Trends, Statistics
The real estate market in Boulder County is off to a good start! Sales were up by 27% from a year ago and were higher than the five-year average. I have been involved in three multiple offer situations in the past month. These were on homes that have been upgraded beautifully and buyers love a home that is ready to go! We are also seeing a steady flow of new listings to the market. This continues the momentum we had at the end of 2019.
by Neil Kearney | Feb 5, 2020 | Boulder County Housing Trends, Statistics
Boulder County Real Estate Market Update – 2019 Year-In-Review
2019 was another good year for the Boulder area real estate market. After, more than six years of high growth appreciation (more than 72% in the past 8 years!) we saw modest price appreciation over the entire market area.In general,I would characterize the market as being more balanced during 2019. Sellers with updated homes and realistic listing prices were able to sell fairly quickly and for close to (or slightly above) asking price. Buyers showed restraint and patience. Only acting quickly on homes that met all of their needs and were also priced well. This left homes that were dated or overpriced sitting on the market for extended periods.
Although sales actually increased for the year, there seemed to be less demand (as evidenced by showings and multiple offer situations) for any individual home. Inventory of available homes was higher in 2019 than at any time since 2014. Understanding that they had choices gave buyers space to compare and think about homes. Where in recent years, buyers soon found out that “thinking about it” meant missing out. This psychological change in buyer dynamics had much to do with the overall change that we felt in the market.
Here are some of the key statistics for Boulder County real estate in 2019:
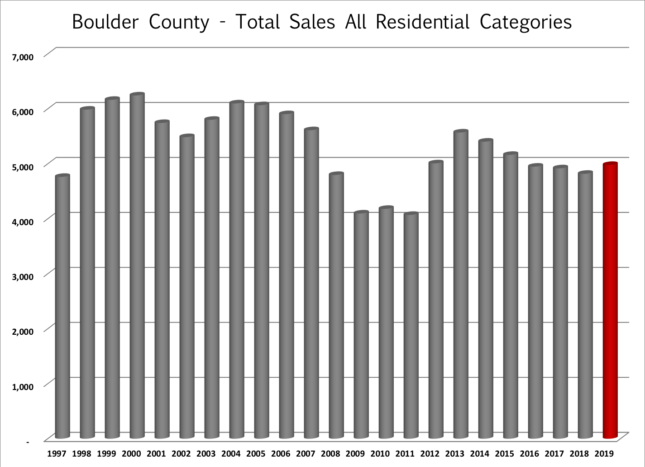 • Total sales increased by 3.3% to 4,979 sales. Despite the increase sales were still 10% lower than 2013 levels.
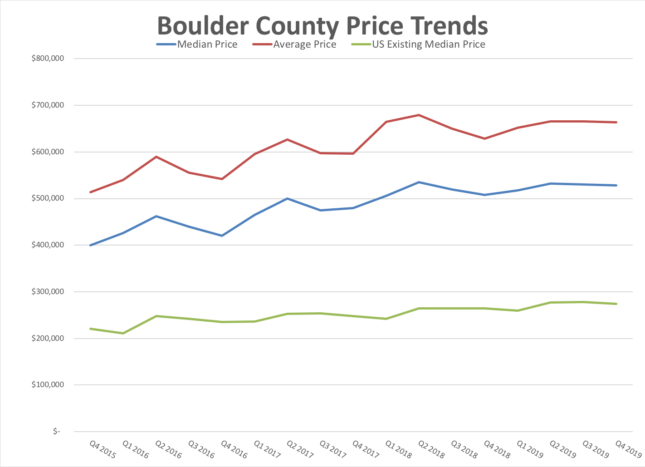 • Slower Price Appreciation – The median price for all sales in 2019 was $530,000 which is up approximately 3%.
 • Higher Inventory, But Still Lower than Historical Average – At the end of December there were just 899 properties on the market in Boulder County and 344 of those were already under contract.This is more than we had on the market a year ago, but much lower than historical averages.
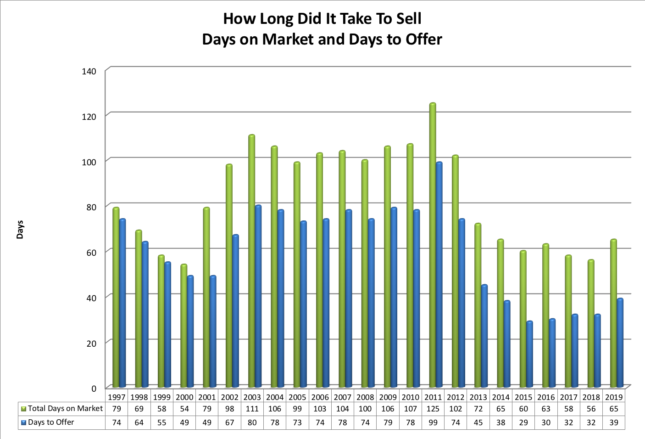 • Longer Time to Sell – Average days to offer was 39 (Higher than last four years and similar to 2014)
• Slightly More Negotiation – Average negotiation off of list price 1.2% (last year was slightly lower at 1.14%)
• Fewer multiple offer situations – 21% of properties sold for a price above the list price (last year was 32%). The average premium paid for these sales was 2.5% (last year the average premium when paid was 3.3%)
• Offers below listing price was the norm – 55% of properties sold for a price below list price (2018 = 45%). The average discount on these sales was 3.1% (2018 = 3.2%).
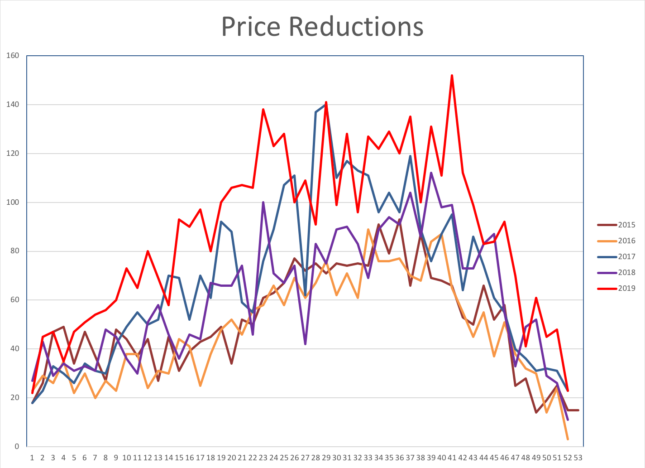 • More Price Reductions – We saw more price reductions by Seller’s this past year than in any recent year.
What’s In Store for 2020 and Beyond?
In the Kearney Report for the 3rd quarter of 2019, it was shown that we are no longer in the expansion phase of the real estate cycle.Locally we seem to be in the “hyper supply” phase which is characterized by increases in inventory, new construction catching up to the market, purchase prices appreciating a lower rate, and increase in interest rates.All of these seem to be tracking as expected except increasing interest rates.Barring a large external event which negatively affects the economy, I expect that our current market conditions will continue for a few more years.Sales will continue at similar levels, prices appreciation will be positive, but less than 4% and Buyers will continue to gain power in negotiations.No big changes just a gradual move around the real estate cycle.
Quarterly Trends
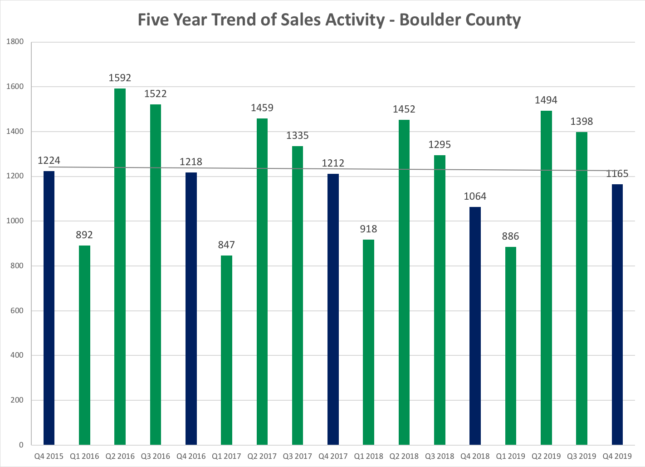
- Sales for the fourth quarter increased by 101 properties. The five-year trend is flat.
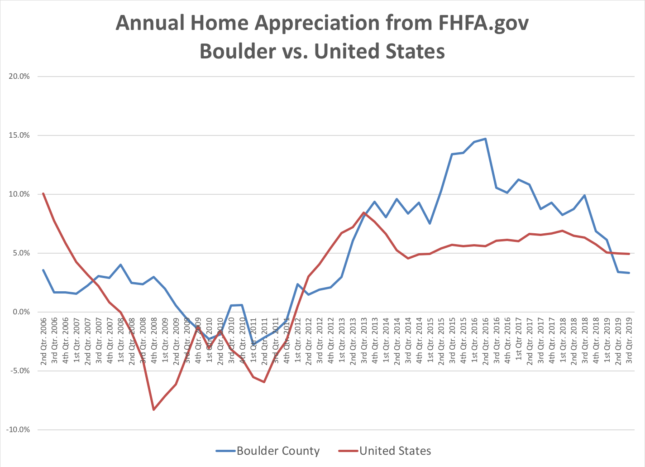
- The graph below shows the average annual price appreciation for both Boulder County (blue line) and the United States (red line) since the second quarter of 2006. Each data point shows one year of appreciation on a quarterly basis. The most recent quarter shows Boulder’s four-quarter appreciation was 3.32% which ranked it 185th out of 231 areas in the study. The average home appreciation in the US over the past year was 4.94%. Boulder County’s appreciation had outpaced the nation’s average since the third quarter of 2013. This trend ended during the second quarter of 2019. Over the past five years our cumulative appreciation was 53.25%, while the nationwide average was 32.93%.
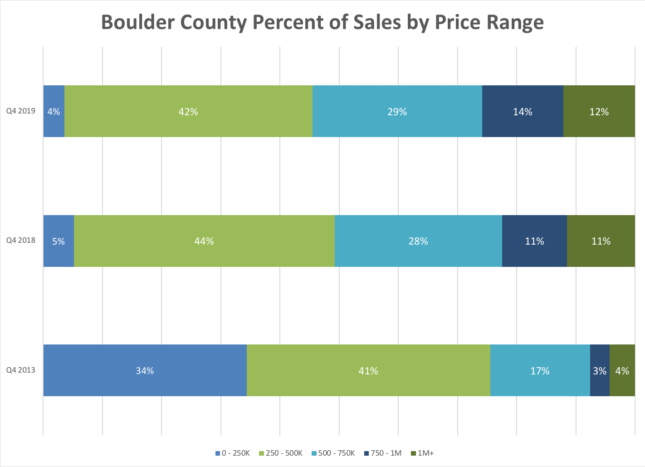
- In Boulder County during the 4th quarter just 4% of all sales were for $250,000 or less. Compare this to five years ago when 34% of sales were for less than $250,000. During the most recent quarter 26% of sales were for $750,000 and above. Five years ago it was 7%.


