by Neil Kearney | Mar 13, 2013 | Boulder County Housing Trends, Statistics
The attached slideshow shows all of the details for the past month but some of the highlights of the Boulder County real estate market right now are:
- Dropping inventory
- High buyer demand
- Multiple offers
- High under contract percentage
When there is low inventory and high demand the result is always high competition for a scarce resource. What we have seen is multiple offers for well priced homes and lots of showings but no offers on obviously overpriced homes.

by Neil Kearney | Feb 13, 2013 | Boulder County Housing Trends, Statistics
Real estate sales in Boulder County continued the strong trend which began last year. Sales were up 27% in the first month of the year. Helping the sales numbers was a jump in available inventory. As of the end of January the number of homes on the market equaled last year. We will need to continue to add new listings to keep the market strong into the spring.
Interest rates have gone up a bit lately and I’m sure that has something to do with the early activity in the market. Also helping the market this January and February is unseasonably good weather. I noticed my bulbs are starting to sprout in the front yard. Where is winter this year? The attached slideshow shows the activity in the market for the month.
by Neil Kearney | Jan 17, 2013 | Boulder County Housing Trends, Statistics
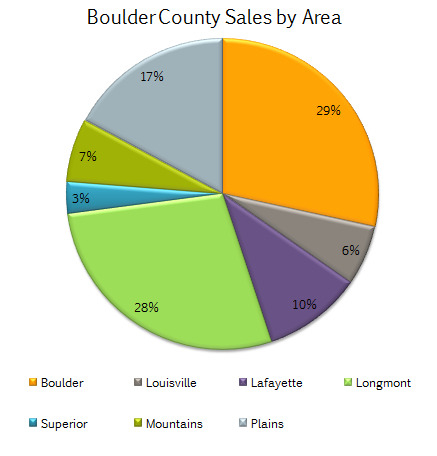
Since the trap door fell out on the national economy, the housing market has been wallowing in a dark cellar looking for sparks of optimism from which to ignite. This past year the sparks caught and the housing market began it’s path toward recovery. Today I will begin highlight a few of the more interesting statistics for the year. To get a full view of what is happening in the different market segments, I encourage you to get a copy of The Kearney Report (to be released soon) and study the graphs and explanations included therein.
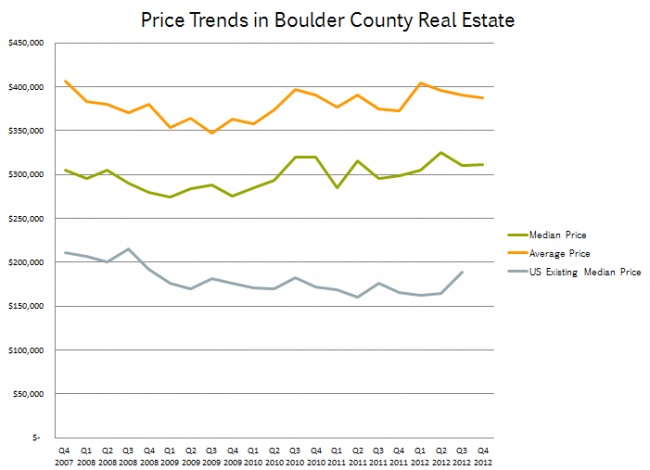
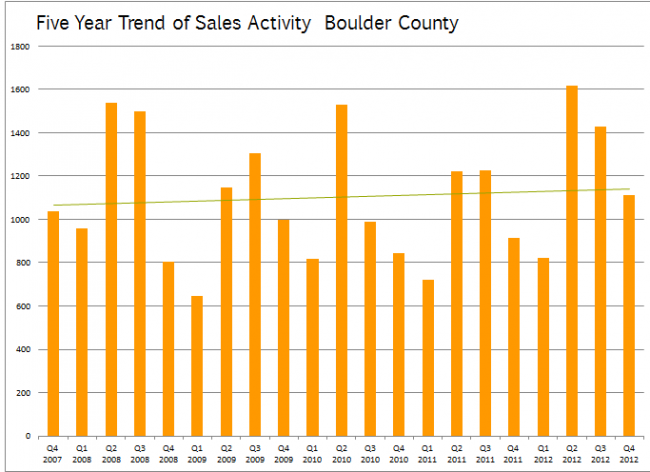
The number of residential properties that sold in Boulder County was up 23% during the year. On a monthly basis, each months sales eclipsed the sales of the same month in 2011 so it was a consistent recovery not one weighted to either end of the year. After five years of stagnant to slightly negative appreciation we saw once again prices of homes rising. This was especially true as we closed the year. Many factors go into home price trends but the largest factor locally was basic supply and demand. As the year progressed the activity in the market remained strong but the number of homes on the market dwindled. By the end of the year the number of active homes on the market was down to about half as many as were on the market at the same time in 2009. This competition for good listings is leading to multiple offers and upward pressure on prices.
Low interest rates are definitely a driving factor in buyer demand. The affordability of homes (total monthly outlay compared to income) is at a historically high rate. That is when a buyer purchases a home now they can afford more home because the prices have not been rising with inflation and the interest charges are way down. Add to this the tight rental market where rents have been rising and good properties have been hard to find, and you get a really strong environment for buying homes.
The market is off to a strong start this year. All indications show that we will have good buyer demand. The only unknown variable is if we will have an ample supply of homes on the market. If you have been thinking about selling but have been putting it off, we would love to explore that possibility with you and let you know if it makes sense for you.

by Neil Kearney | Jan 10, 2013 | Boulder County Housing Trends, Statistics
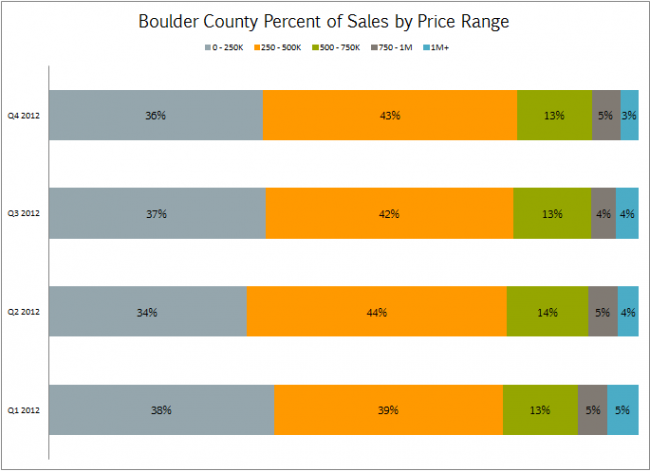
2012 was a great rebound year for Boulder area real estate. Sales were up approximately 23% for the year. The improvement was across the board, each month of the year had more sales than the same month during 2011.
At the end of December we had 30% fewer listings on the market than we did at the same time last year. 34% of those listings are under contract. More inventory will be a key to the continued improvement of the Boulder area market in 2013.

by Neil Kearney | Dec 7, 2012 | Boulder County Housing Trends, Featured, Statistics
The market continues to be unusually strong. Real estate sales in Boulder County were up 29% compared to last November. This is really surprising given the fact that inventory of available homes are down 35% from last year. The combination of these two factors leads to a market filled with tension. Buyers are out ready to buy but there are not many homes to buy. This type of tension is good for sellers and lead to increased prices.
November is not normally known as a prime selling month. But this year we have had a great fall and the sales are more like March than November.
Here are some quick market facts:
- Year-to-date sales are up 23%.
- Inventory is down 36% from November 2007.
- 35% of available single family homes in Boulder County were under contract as of November 1st.
For more details view the slideshow below.


