
by Neil Kearney | Jan 14, 2014 | Boulder County Housing Trends, Statistics
 The sales in December showed an unexpected 12% increase. There were 330 sales (residential, Boulder County) in December 2013 and there were 295 sales in December of 2012.
The most notable statistic for the month is the total inventory. The number of available homes for sale has fallen from 1,507 at the end of 2011 to 946 at the end of 2013. One would expect that we would start seeing more new listings this time of year but we have much ground to make up in order to meet the buyer demand. The market keeps turning.
The slideshow below presents total sales, under contract percentage, inventory, sales by week, new listings and under contract by week.

by Neil Kearney | Dec 10, 2013 | Boulder County Housing Trends, Statistics
Sales took a big drop in November. Down 8.4% from last November and down 12% from October. After 21 straight months of increased year-over-year sales we have now had two straight months of decline.
Year-to-date sales are still up 9.6%.
Inventory, or lack thereof, continues to be a challenge. At the end of October there were just 1440 total listings on the market (single family and condos). This is down from 1818 just two months ago.
We are like a two cylinder car running on full capacity, however we are, figuratively speaking, topping out at just 45 mph. In order to have the market moving forward in 2014 we need to run on 8 cylinders with plenty of gas. We have the capacity all we need are the listings. I suspect the first six months of 2014 will be especially busy. If you are considering selling your house give me a call now so that we can discuss the timing, pricing and getting your house ready to go.
View the slideshow below to see all of the details.

by Neil Kearney | Nov 13, 2013 | Boulder County Housing Trends, Statistics
The Boulder County real estate market is predictably starting to slow as we get nearer the holidays. For the first month this year sales were lower in October (by just 1%) than they were a year ago. Inventory continues to fall. There are currently 31% fewer listings than there were at the same time two years ago. Sales for the first ten months of 2013 are up just over 11% however I expect this number to fall before the end of the year. Last year we had a very strong fall and winter with sales actually increasing during the fall months and this year we are seeing a normal pattern of declining sales as we near the end of the year.
The slide presentation below shows the current statistics compared with the last four years of data on a monthly basis.
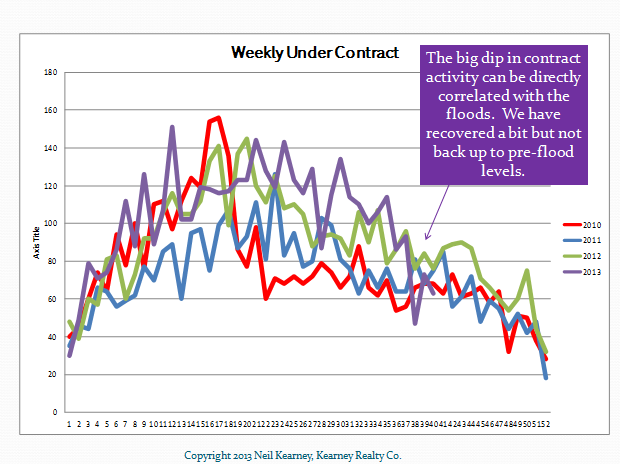
by Neil Kearney | Oct 7, 2013 | Boulder County Housing Trends, Statistics
September was a very interesting month for the Boulder real estate market. Sales were strong, but the mid-month flooding definitely broke some momentum in the local home market. Sales of all residential properties increased by 18.6% over September of 2012 and this stretched our year-to-date increase to 12.5%. At the end of the month the percentage of homes that were under contract fell roughly 3 points from a month ago to 26%. This was all good and strong information.
Flooding hit the area starting September 12th and during the next week we saw very little activity in the real estate market. Many homes that had water damage that were on the market were pulled from the market and those that might have come on the market during September didn’t as owners cleaned up and fixed up as needed. The inventory of single family homes on the market in Boulder County dropped 24% from August 31st to September 30th.
As mentioned above the percentage of homes that are under contract fell just three points as compared to last month. However, the gross number of homes that went under contract during the month fell by a significant 25%. Since the number of homes on the market decreased at roughly the same pace of the fall in contracts the overall “under contract %” doesn’t jump out at you until you take a closer look.
To view all of the statistical graphs with my annotations click on the slideshow below.

by Neil Kearney | Sep 11, 2013 | Boulder County Housing Trends, Statistics
Sales were strong again in Boulder County in August. In fact there were 23% more closings this year than there were during August of last year. Year-to-date sales have increased roughly 12%. Sales peaked in July this year with 625 closings throughout the county. In August 587 properties closed which is just 10 units below June.
The current under contract percentage is hovering at 30%. Still a good indication of a strong market but interestingly, this is the first month since May of 2011 where we saw the previous year outpace the current month. Maybe a sign of a slowing market.
Inventory has been gradually increasing since March but we are still 12% the inventory levels of a year ago.
To get a full visual picture of the market please view the slideshow below.

