
by Neil Kearney | Aug 6, 2020 | Boulder County Housing Trends, Statistics
 Click here to view and download the entire report
We have all been on a wild ride this year! As we started 2020 none of us could have predicted how flexible we would need to be as the world has changed around us. Face coverings, social distancing, Zoom meetings, cancellations, working from home,… these have all become a part of our year. We have seen some businesses adjust and thrive, and others close for good. We have seen the stock market tank and then rebound. Unemployment climb to record high levels and interest rates fall to all time lows. Real estate sales have been on a big pendulum as well. Low sales in April and May reflected the stay-at-home orders announced in March but have rebounded strongly this summer.
Everyone needs a place to live, and when we are forced to stay in our house for weeks on end it leads to decisions stemmed from change. Change is what drives the real estate market. As younger home buyers take advantage of low interest rates, we have seen especially strong sales of the lower priced homes in our market. It’s taking a bit longer for the sales to trickle all of the way up to the luxury market, but it is happening. One thing we are seeing, is people being drawn to our beautiful and less crowded area from the big cities. Some who have the financial means to move away from the big city are looking into a change of lifestyle . A few weeks ago I got back to back calls from potential buyers from Miami who inquired about land in our area. This could be a trend that fuels our market into the future.
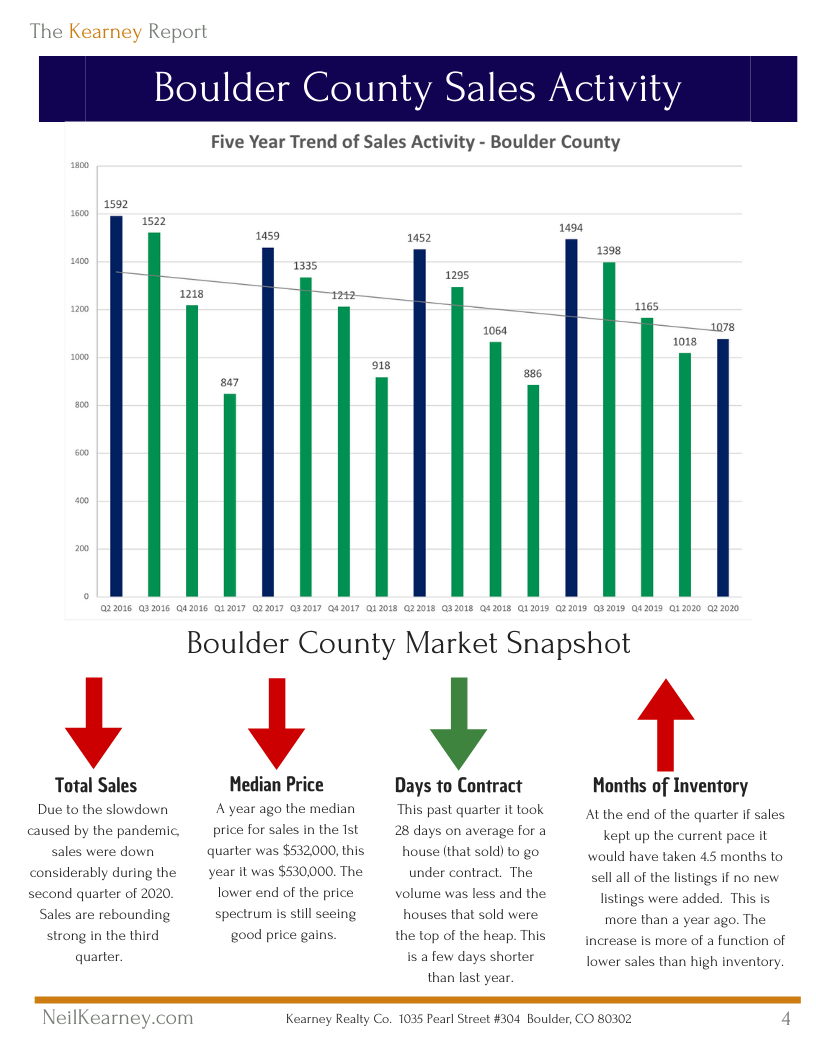
This is a strange year for statistics. Of course sales were down for the second quarter. We were all staying at home and taking family walks for two months instead of looking at real estate. But the graphs seen in this report do show that we had a very strong start to the year and have had a very strong rebound. The first part of the rebound was made up of buyers and sellers who were planning to buy or sell just as the pandemic hit. After all, March, April and May are our busiest months of the year. Those transactions were pushed back a few months. Now we are seeing another wave of activity fueled by low interest rates, a recovery in the stock market and people feeling more stable in their jobs. With those foundation points in place, people are able to dream of a different place to live that fits their needs better than where they are now.
Obviously it’s not a clear path ahead. This is an election year (different than any I have been a part of) and we are still trying to balance getting back to work and keeping our population safe. How this will affect small business, higher education (a big deal in our community), and commercial real estate are just three of the upcoming unknowns that may have large repercussions. We will all need to be flexible as we make plans based on past assumptions that may not hold into the future.
Homes continue of sell and as always I’m actively helping buyers and sellers successfully close transactions. I’m always here for you to be of service. Enjoy the report and stay in touch!
The Kearney Report 2nd Quarter 2020 (1)

by Neil Kearney | Jul 22, 2020 | Boulder County Housing Trends, Statistics
There were many questions as to how the real estate market would react to the pandemic. In Boulder County we are getting the short term answer. Sales have recovered quite nicely, and activity is back up to normal levels for this time of the year. Overall, inventory is dropping back to pre-2017 levels and with nearly half of active listings already being under contract inventory is low in some sub-markets and price ranges. The lower end of the market continues to outperform the higher end. Price reductions have been increasing in recent weeks as sellers who are not finding traction in the market find ways to compete in the market. What will happen in the long term is still an open question. Here are some of the many possibilities.
- Locally will we see more people drawn to the area from large urban areas?
- Will the importance of housing (after being stuck at home for months) translate into more sales?
- Will millennials continue to be a driving engine in the lower end of the market?
- Will we see more relationships ending? Resulting in the need for more housing?
- Will the economy continue to improve even after the unemployment benefits and other stimuli run out?

by Neil Kearney | Jun 8, 2020 | Boulder County Housing Trends, Statistics
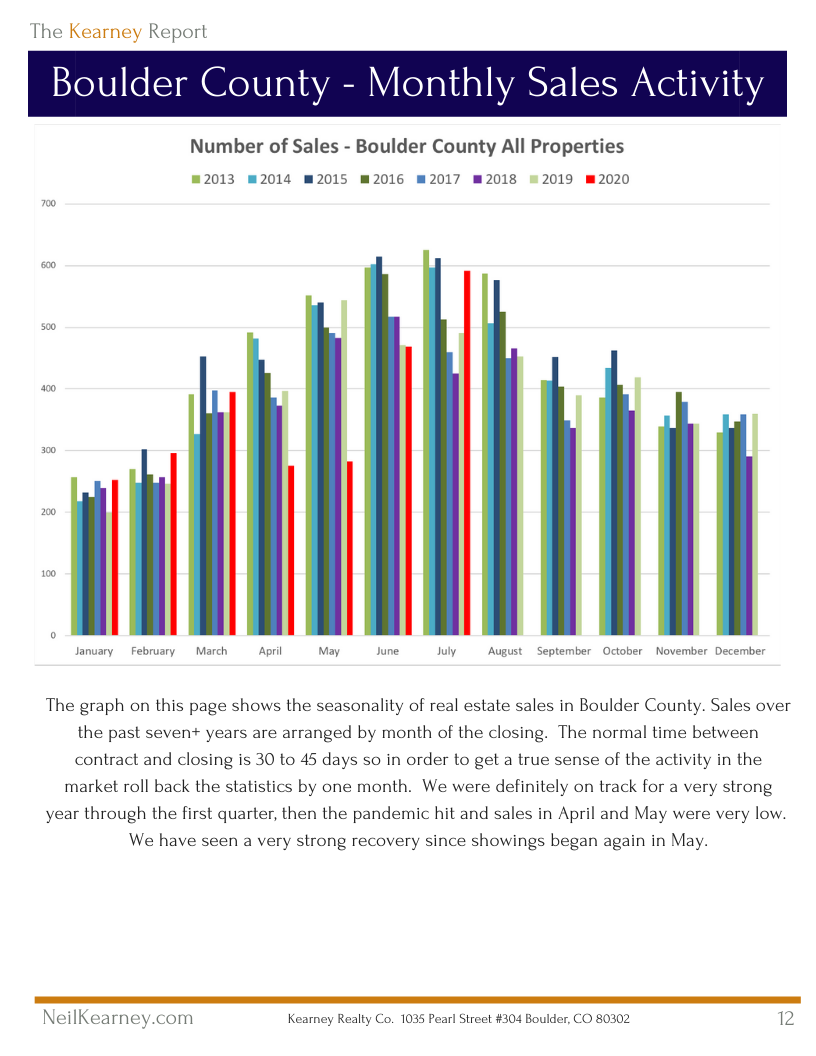
There is a lot to process this month. Definitely not just a continuation of our usual spring market. Sales are down significantly compared to past years (down 48% in May), but this is due to the forced showing moratorium. Sales are a lagging indicator. Looking forward, we have seen a nice rebound in the market in the last few weeks. Showings have increased and the number of contracts written are surprisingly strong. I’m still seeing much more activity in the lower price ranges and not as much in the luxury range, but overall I’m encouraged with the strength in the recovery so far.
The University of Colorado and its students have a big ongoing impact on our local market. CU has announced a hybrid model to conducting their fall classes, using a mix of online and in-person classes. It will be interesting to watch how this will affect the demand of housing as time goes forward. For now, I hope you find the slides below informative.
by Neil Kearney | Jun 4, 2020 | Boulder County Housing Trends, Statistics
This past week really felt like we were back up to speed. Showings stayed strong and the number of properties going under contract this past week surged to a level higher than any of the last four years during the same week. The higher price ranges are still lagging, but we are seeing an increase in showings. Closings are still down, but there was an increase for the week due to the end of the week.

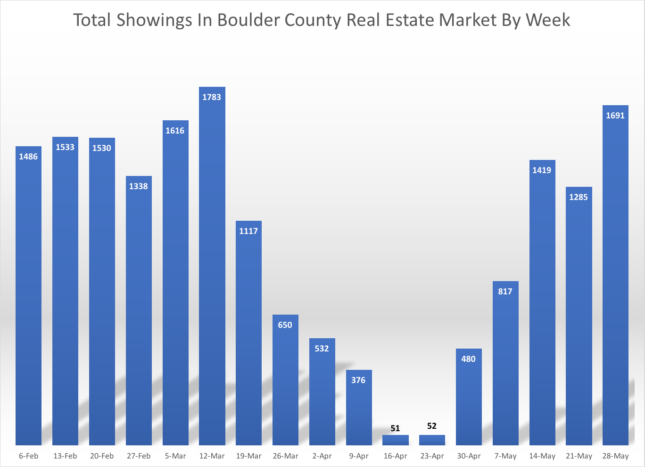
This graph shows the total showings for the week in all price ranges. Showings seem to be at a near normal level.

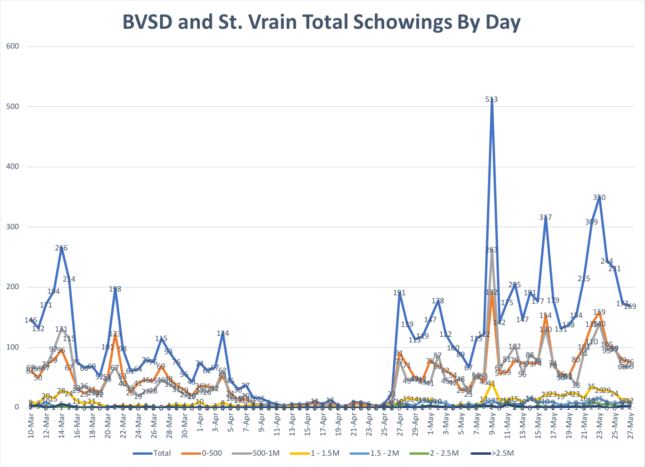
This graph shows the number of showings in the Boulder/Longmont area by day since March 10th. We are seeing a surge of activity on Saturdays.
There was a big surge in accepted contracts this week. Surprisingly the number of contracts accepted this past week exceeded any other single week over the past four years.

Since there is typically a 30-45 day lag between contract acceptance and the closing, the number of closings is still is lower than normal. Given the number of accepted contracts recently, it appears that we may be back up to normal numbers by the end of June.
by Neil Kearney | May 28, 2020 | Boulder County Housing Trends, Statistics
Our communities are taking steps to open up the economy. I’ve definitely noticed more traffic, filled parking spaces downtown and a few businesses using their space again in my office building. Some restaurants began to seat customers yesterday and more and more buyers and sellers are slowly coming back into the local real estate market. On an aggregate basis showings were up 31% this past week. Up to 1,691 showings (data from ShowingTime). We were last at this level in early March. Progress.
Usually Memorial Day week is fairly slow. But we saw a nice surge of new listings and the number of new accepted contracts stayed strong. Much of this activity is in the lower price ranges, but not exclusively.
Here is a breakdown of inventory and the percentage of those listings which are under contract by price. Residential listings in Boulder County.
$0 - $500k
Total Listings = 448
57% are under contract
$500k - $1 Million
Total Listings = 651
45% are under contract
$1 - $1.5 million
Total Listings = 162
23% are under contract
$1.5 - $2 million
Total Listings = 79
18% are under contract
$2 - $2.5 million
Total Listings = 41
19% are under contract
More Than $2.5 million
Total Listings = 76
9% are under contract
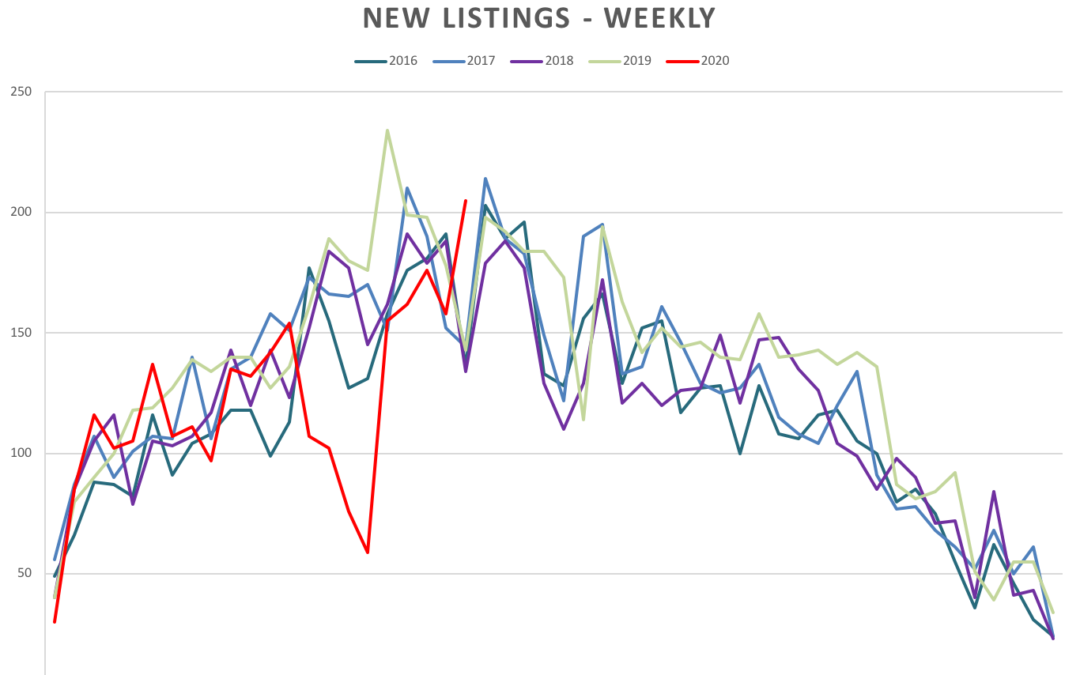
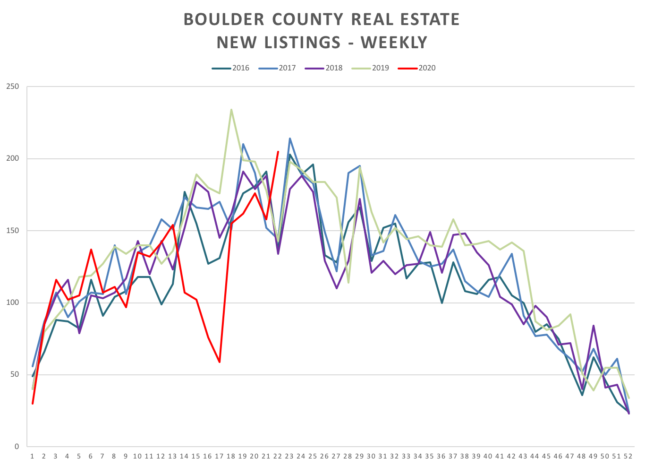 The graph above shows the new listings which have come on the market on a weekly basis over the past five years. The red line shows the activity this year. We have seen many new listings hit the market in May.
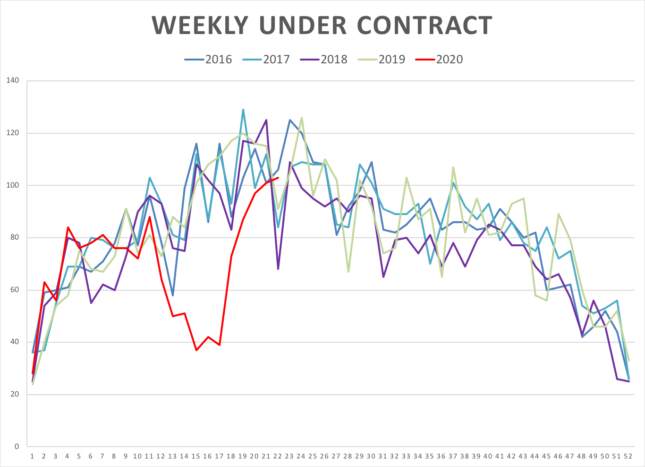
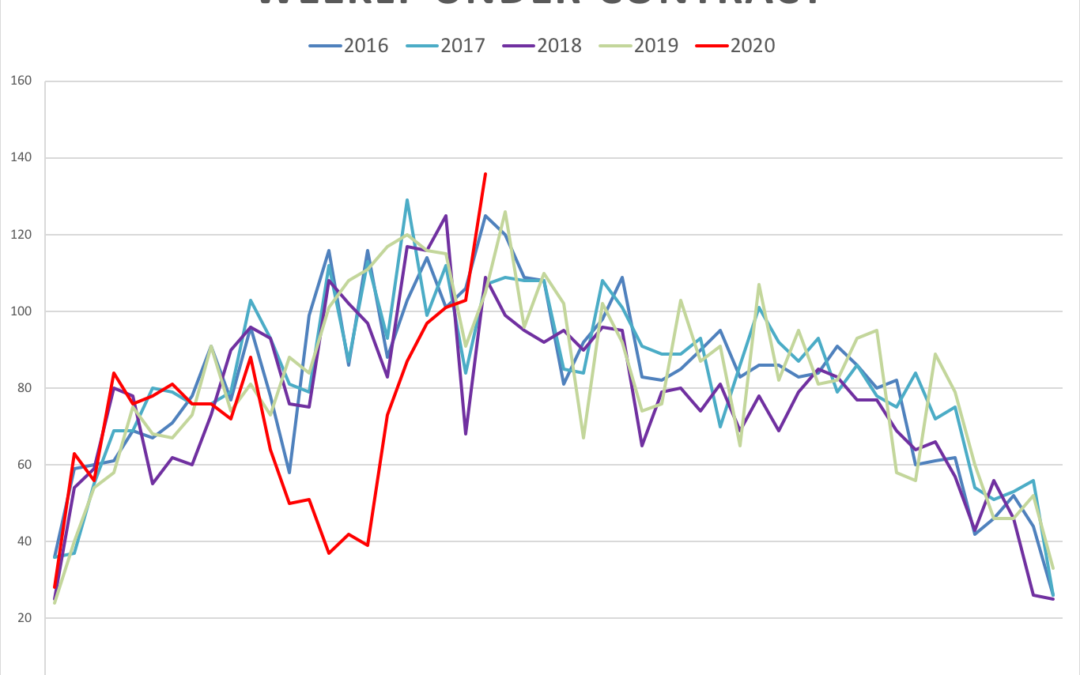
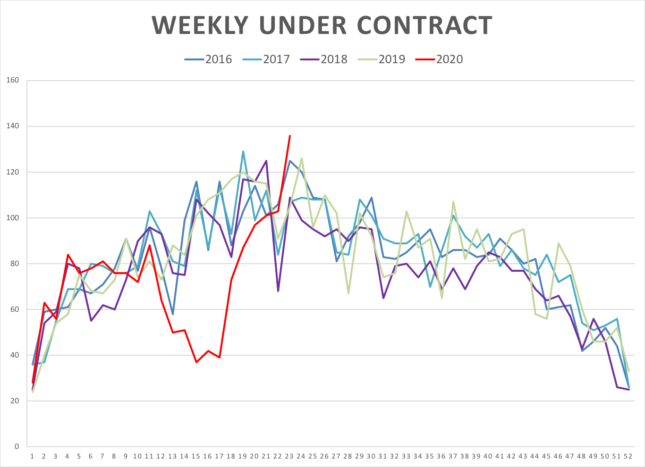
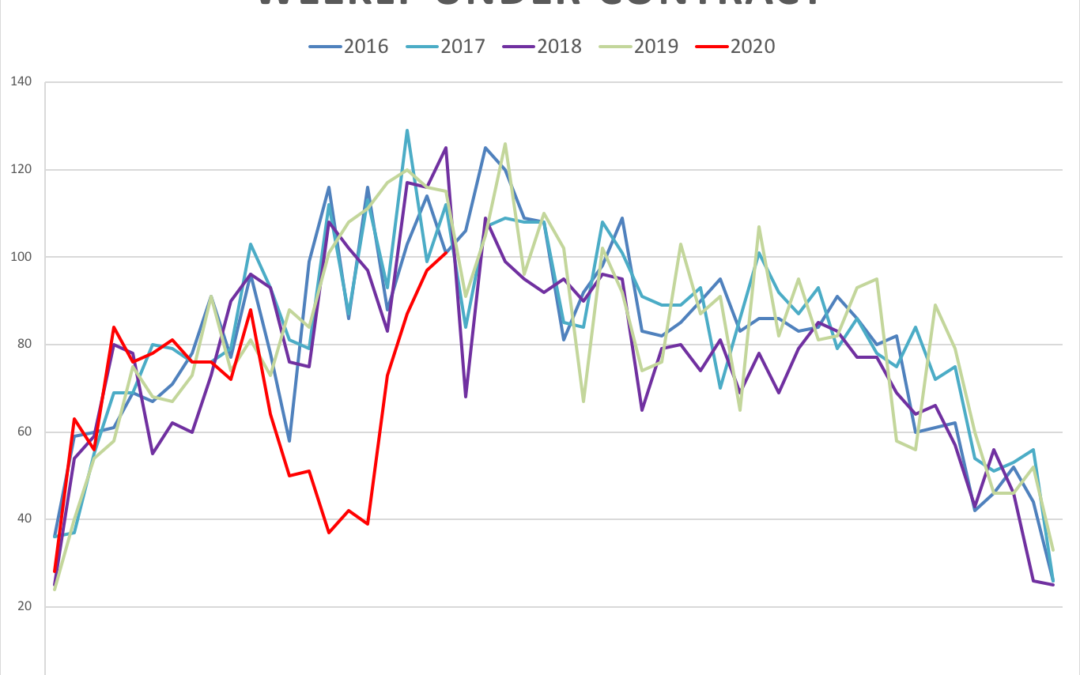
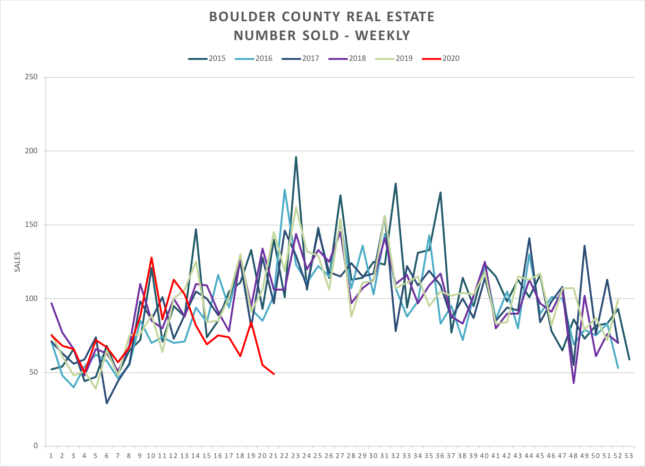
The graph directly above shows the number of listings that have gone under contract on a weekly basis. Since showings were again approved we have seen good contract activity. From the information above (orange toggles) you can see the strongest market is below $1,000,000.
As the weeks progress and as people get back to work it will be interesting to see if there is a surge in buyer activity. If not, we may see an increase in inventory. This isn’t a bad scenario since we have been low on listings for a number of years. But the risk of an imbalance (more supply than demand) is that it will take longer for homes to sell and there will be overall negative price pressure. As long as interest rates remain low and buyers can obtain mortgages, this is a good thing for buyers.
by Neil Kearney | May 21, 2020 | Boulder County Housing Trends, Statistics
Showings on occupied listings have been up and running (with safety restrictions) for almost two weeks. It was a strong week of activity. 101 properties went under contract. This is down just 14 properties from the same week last year. There were 158 new listings during the week which is comparable to a normal year. Price reductions have been increasing as sellers get serious about selling, now that showings have resumed. Predictably the number of closings continues to slow. This is the result of the complete shut down in late March and April. For more information see the captions of the graphs below.

101 properties went under contract during the week in Boulder County.
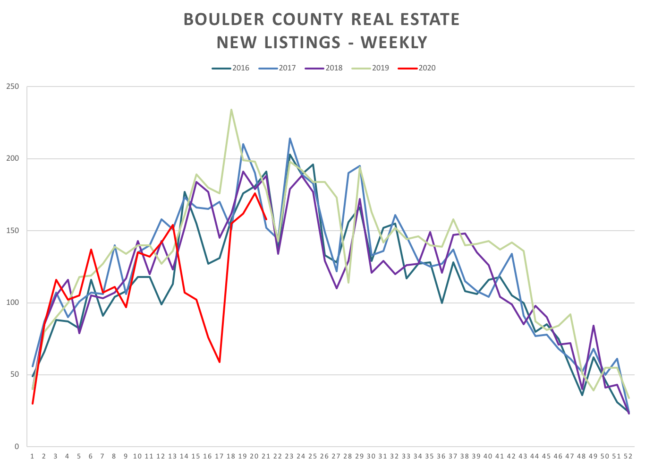
New listings have climbed steadily over the past few weeks. Many sellers who had planned to list in March or April are now testing the market.
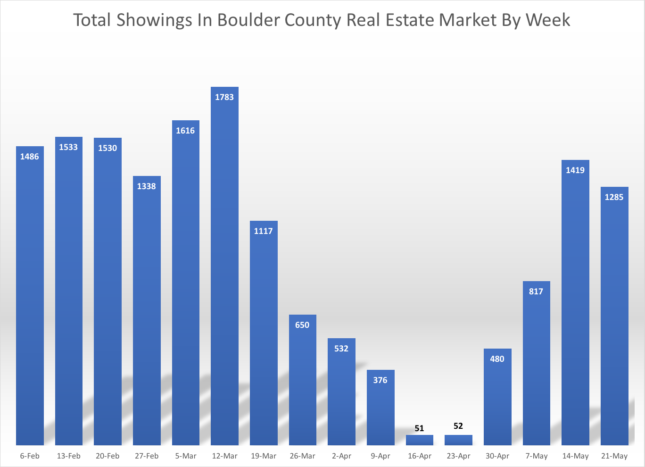
Showings for the week were active, but showed a decrease from the week before.
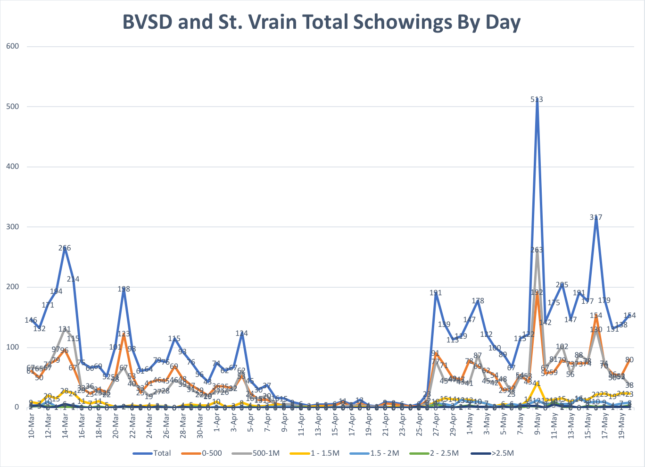
Showings are still much more active in the lower price ranges.
Showings happening now are the result of contracts written in March and April. We should see a decline for a few more weeks before it starts to recover.
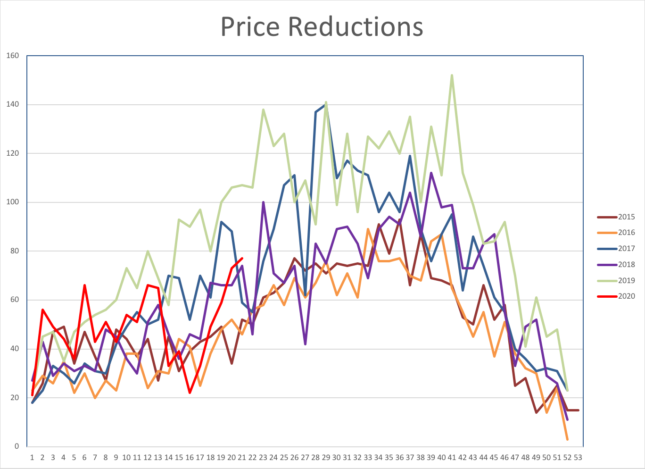
Price reductions are a measure of the overall strength of the market. As houses stay on the market longer sellers decrease the price, trying to attract buyers.

