In Boulder we are having a late season snow day. We are working our way up to a foot of fresh, wet spring snow. Today is a nice day to be at home. I started these weekly updates roughly a month ago, just after the ‘stay at home’ orders were made in Colorado. Those orders have not been lifted and the effect throughout the world has been and will continue to be quite staggering. In this post, I will quickly highlight the activity in the Boulder area real estate market and then think aloud as to what we might see when the economy is un-paused.
Just over a week ago the Attorney General of Colorado and the Colorado Real Estate Commission gave clarification regarding the essential services provided by the real estate industry which are exempt from the Governors ‘stay at home’ orders. Essentially we were directed that marketing efforts such as: listing appointments, showings and open houses are not essential and should be avoided. All functions that facilitate transactions working toward a closing, such as inspections, appraisals, walk-through’s and closings can be performed using social distancing safety protocols. It’s clear that this is not business as usual. The activity statistics bear this out.
For a larger view of the charts below just click on the image.
Technical notes regarding the gathered statistics, feel free to skip this paragraph. The graphs above are indicative of the market activity but there are a few factors that might make them less accurate than normal. The vast majority of showings are set through a company called Showingtime and this is where I get the showing statistics. However, given the personal nature of showings right now, vacant vs. occupied, health questionnaires, under contract vs. active… I suspect that a number of showings are being set directly with the listing agent. The weekly Under Contract chart shows the number of homes that change their status in the IRES MLS system to Active/Backup on a weekly basis. This allows continued showings and backup offers. There is another status, ‘pending’ which also indicates an accepted contract but signals no backup offers and no more showings. Many times properties that are initially market ‘active/backup’ are later changed to ‘pending’ when certain contingencies are met. I try not to double count by not including pending listings and in the end this consistency allows for proper comparison over time. However, I suspect that as a percentage, more properties would go directly to the pending status right now and therefore the numbers for under contract may be slightly under counted.
Because of the lag time between contract and closing, the number of closings is still hanging in there. But as we move into May and June our current activity will be reflected in very low closings.
The debate is going on in all sectors of the economy about whether this will be a “V” shaped recovery or one that lingers into a deeper recession. The longer this goes on the harder it will be to turn on the switch and expect that all will be well. Damage is being done to the balance sheets of governments, companies and individuals and when we do go back to work it would be naive to think that all of the 16 million newly unemployed would be hired right back. Unexpected events like this (aren’t they always unexpected?) catch many with their pants down (so to speak). From governments down to individuals, it seems that not enough planning is done to withstand the unknown challenges of the future. Therefore a furlough of six weeks for an individual who is living paycheck to paycheck has effects both up and down the economy.
Factors that will help toward a “V” shaped recovery in real estate:
In comparison to the Great Recession and its affect on real estate, we as a whole are in much better shape than we were a dozen years ago. Mortgage reform has forced homeowners to have more equity and the long bull market has enhanced that position for many.
Speculative buying and using your home as an ATM to fund an upside down lifestyle have not been prevalent lately.
Low interest rates.
Banks are in better shape, so competitive mortgages should still be available.
With so much time at home buyers may realize that they need a different situation.
Challenges for the housing market going forward:
Consumer confidence has been negatively affected.
First time buyer market will be depleted for a time with the break in income for many.
When restrictions are lifted, there may be a big supply of homes coming on the market which may not be matched by an equal demand.
A supply/demand imbalance will result in homes staying on the market longer. If the imbalance persists, it will put pressure on prices.
We have been in an eight year expansion in the real estate cycle. Signs were pointing toward a gradual shift even before the Covid-19 recession. My guess is that this will shift us toward a shift in the cycle. Remember cycles are normal.
I’m taking this opportunity to get some projects done around the house. I hope you are staying productive and positive as well.
When you look to the future and predict where the market will go, rarely do we think about large outside influences like a global pandemic. But here we are. The health crisis has caused a global financial crisis. How deep this recession will be won’t be known until we get back to work and see how quickly the workforce gets reabsorbed back into jobs. The housing market was just coming into the most active time of the year so many plans are paused if not changed. Right now I’m seeing most of the in-process transactions make it to the closing table (although definitely not all), but we are definitely seeing a huge drop in showings and new contracts written. It will be interesting to see if the busy time of the year is just delayed or if the normal bubble of activity just pops for the year. For now we are seeing some activity in the lower price ranges in our market and very little in the upper price ranges.
Here are a few of the graphs for the month. But to get the entire picture see the annotated slideshow below.
As an industry, we are finding ways to conduct business in a reduced, yet responsible manner. Here are a few of the actions I have seen implemented in the past week:
Real estate attorneys at the Bar Association quickly created an addendum related to the uncertainty of current business environment. It provides automatic extensions if transactions are interrupted because of outside factors.
Listing agents have instituted strict showing protocols including: questions about health and travel; strict time frames on showings (time in house and time between showings); instructions on using provided disinfectant and sanitizer, etc.
The use of 3D and other virtual tours have been utilized in order to enhance the online experience.
Title companies have instituted closing procedures that include “curbside” closings, where the title officers go to the clients cars to get signatures. As much as possible is being done in advance electronically.
We are all adapting while trying to adhere to the ‘spirit’ of the stay at home directives as well as social distancing. I’m so thankful that so much can be done electronically these days! We are still able to keep transactions moving forward and to help those clients who really have a deadline in terms of housing.
As far as the market is concerned, it is obviously much slower than normal. But there are still new listings coming on the market (still over 100 new listings last week in Boulder County), showings taking place (about 1/6 of our normal amount this time of year) and contracts being written (this past week had about half as many as were written during the same week a year ago). The graphs below tell a good story about the activity in the market there is a brief caption below each graph.
51 properties went under contract during the past week. A year ago 105 went under contract during the same week.
This graph shows total showings for the week in the Boulder/Longmont area. Showings dropped to about one third of what we were seeing at the end of February.
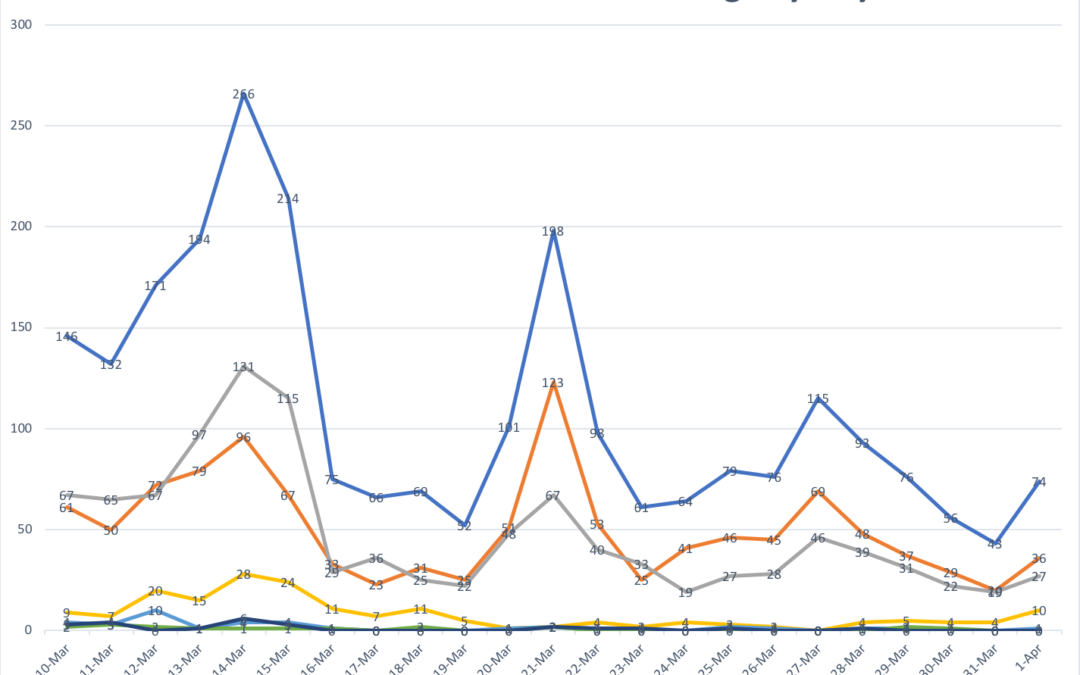
The graph above shows the number of showings each day in the Boulder/Longmont area by price. The top blue line shows the total listings and the lines below show the breakdown by price. Homes below $1 million are getting most of the showings. There are very few showings happening in the higher price ranges.
The number of new listings dropped this past week but it is still higher than I thought it might be. 107 new listings came on the market. Of those 13 went under contract right soon after listing.
Other agents and title officers have told me about deals falling apart because of the financial uncertainty caused by the pandemic. But for the most part transactions are still going through. March closings will still be strong. We will see the effects in the form of lower sales numbers in future months.
I hope everyone is adapting and doing fine. It’s certainly a new experience for all of us! I have appreciated the opportunity to get some projects done on my website and for upcoming listings, that I have been on my ‘to-do’ list. I’ve also been able to get some home projects completed. I’ve appreciated the steady stream of walkers and bikers traveling behind my house on the multi-use trail. Many of these neighbors I haven’t seen before. I’ve also appreciated the quiet at night when I take my dog for a walk before going to bed. Maybe some of these new patterns and activities will remain with us and become a positive in our lives when we get more back to normal. Stay well, productive and active!
As we go through this unprecedented time of “Stay and Home” orders and business closures (hopefully most of them temporary), I am providing weekly updates on how the real estate market is reacting to the changes. In this weeks video I highlight showings on homes, new contracts written, closings and new listings. The graphs in the photos are below along with links to a few local organizations who are making a direct impact in our community for those most in need. I welcome you to join me in supporting these two organizations.
Showings dropped by about one half this past week and are about one third of the usual number we see this time of year.
The number of homes that went under contract in Boulder County dropped quite a bit, but not as low as I thought they might. There are a number of buyers who need to move and they are making deals
The number of closings held steady, just about where they should be. Thanks to our great title companies and mortgage companies and other ancillary services doing great work.
Surprising to me was the large number of new listings hitting the market this past week.
Here are some links to the donation pages of Impact on Education and EFAA. Both of these organizations are doing great work in our local community.
The real estate market in Boulder County is off to a good start! Sales were up by 27% from a year ago and were higher than the five-year average. I have been involved in three multiple offer situations in the past month. These were on homes that have been upgraded beautifully and buyers love a home that is ready to go! We are also seeing a steady flow of new listings to the market. This continues the momentum we had at the end of 2019.
2019 was another good year for the Boulder area real estate market. After, more than six years of high growth appreciation (more than 72% in the past 8 years!) we saw modest price appreciation over the entire market area.In general,I would characterize the market as being more balanced during 2019. Sellers with updated homes and realistic listing prices were able to sell fairly quickly and for close to (or slightly above) asking price. Buyers showed restraint and patience. Only acting quickly on homes that met all of their needs and were also priced well. This left homes that were dated or overpriced sitting on the market for extended periods.
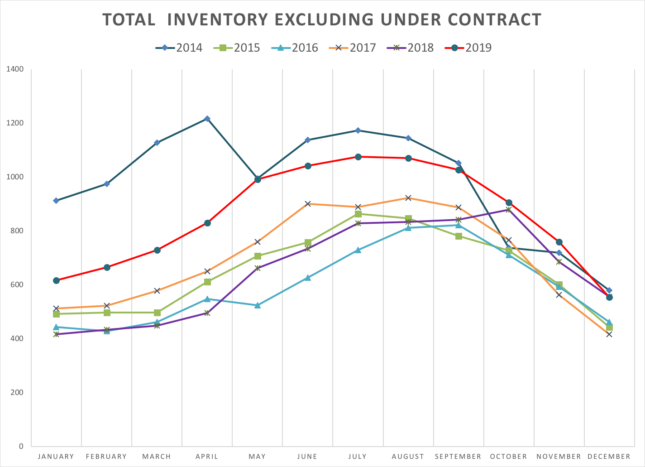
Although sales actually increased for the year, there seemed to be less demand (as evidenced by showings and multiple offer situations) for any individual home. Inventory of available homes was higher in 2019 than at any time since 2014. Understanding that they had choices gave buyers space to compare and think about homes. Where in recent years, buyers soon found out that “thinking about it” meant missing out. This psychological change in buyer dynamics had much to do with the overall change that we felt in the market.
Here are some of the key statistics for Boulder County real estate in 2019:
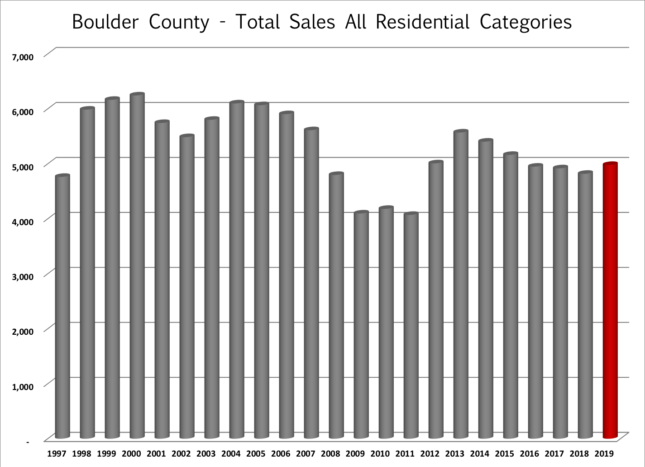
• Total sales increased by 3.3% to 4,979 sales. Despite the increase sales were still 10% lower than 2013 levels.
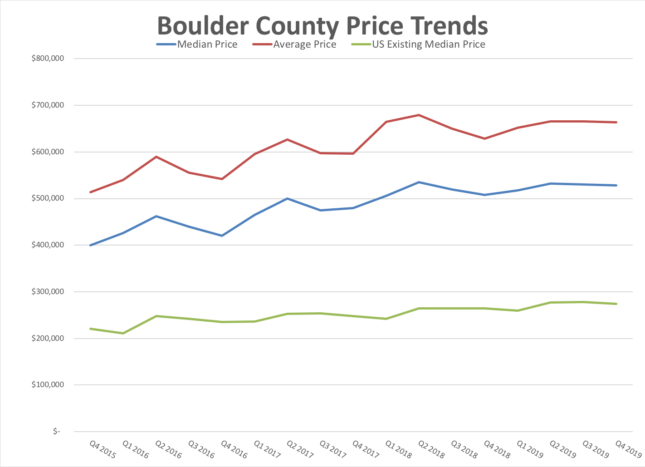
• Slower Price Appreciation – The median price for all sales in 2019 was $530,000 which is up approximately 3%.
• Higher Inventory, But Still Lower than Historical Average – At the end of December there were just 899 properties on the market in Boulder County and 344 of those were already under contract.This is more than we had on the market a year ago, but much lower than historical averages.
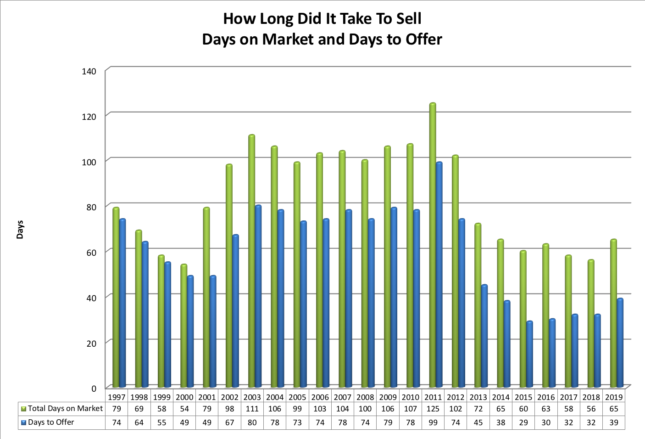
• Longer Time to Sell – Average days to offer was 39 (Higher than last four years and similar to 2014)
• Slightly More Negotiation – Average negotiation off of list price 1.2% (last year was slightly lower at 1.14%)
• Fewer multiple offer situations – 21% of properties sold for a price above the list price (last year was 32%). The average premium paid for these sales was 2.5% (last year the average premium when paid was 3.3%)
• Offers below listing price was the norm – 55% of properties sold for a price below list price (2018 = 45%). The average discount on these sales was 3.1% (2018 = 3.2%).
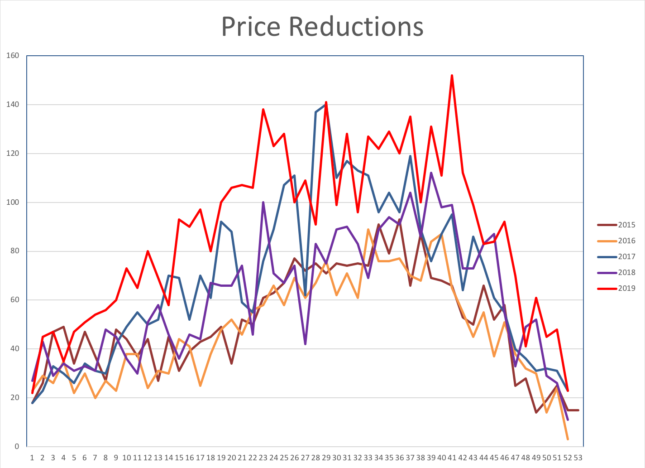
• More Price Reductions – We saw more price reductions by Seller’s this past year than in any recent year.
What’s In Store for 2020 and Beyond?
In the Kearney Report for the 3rd quarter of 2019, it was shown that we are no longer in the expansion phase of the real estate cycle.Locally we seem to be in the “hyper supply” phase which is characterized by increases in inventory, new construction catching up to the market, purchase prices appreciating a lower rate, and increase in interest rates.All of these seem to be tracking as expected except increasing interest rates.Barring a large external event which negatively affects the economy, I expect that our current market conditions will continue for a few more years.Sales will continue at similar levels, prices appreciation will be positive, but less than 4% and Buyers will continue to gain power in negotiations.No big changes just a gradual move around the real estate cycle.
Quarterly Trends
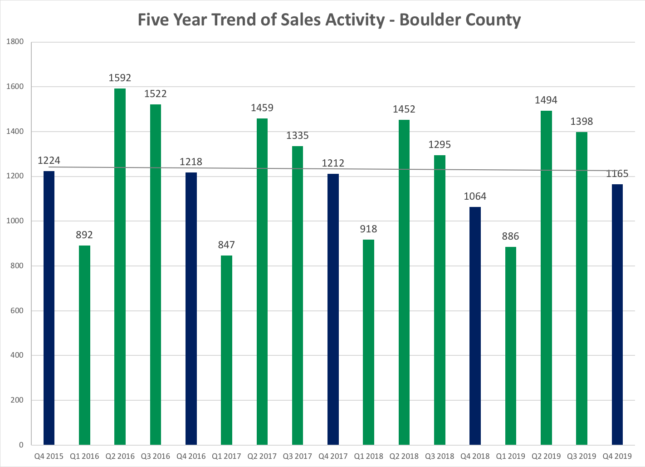
Sales for the fourth quarter increased by 101 properties. The five-year trend is flat.
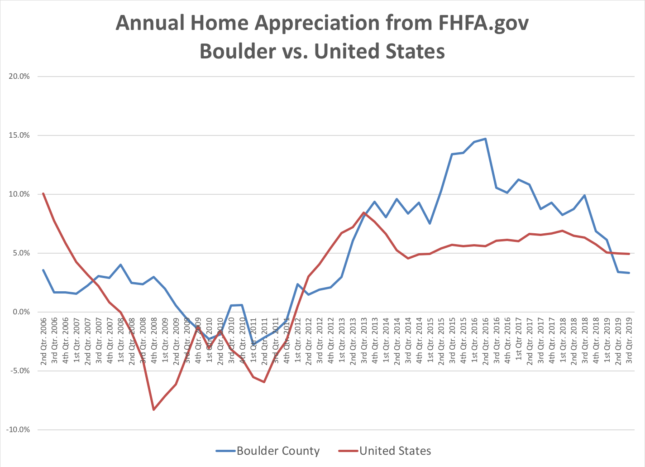
The graph below shows the average annual price appreciation for both Boulder County (blue line) and the United States (red line) since the second quarter of 2006. Each data point shows one year of appreciation on a quarterly basis. The most recent quarter shows Boulder’s four-quarter appreciation was 3.32% which ranked it 185th out of 231 areas in the study. The average home appreciation in the US over the past year was 4.94%. Boulder County’s appreciation had outpaced the nation’s average since the third quarter of 2013. This trend ended during the second quarter of 2019. Over the past five years our cumulative appreciation was 53.25%, while the nationwide average was 32.93%.
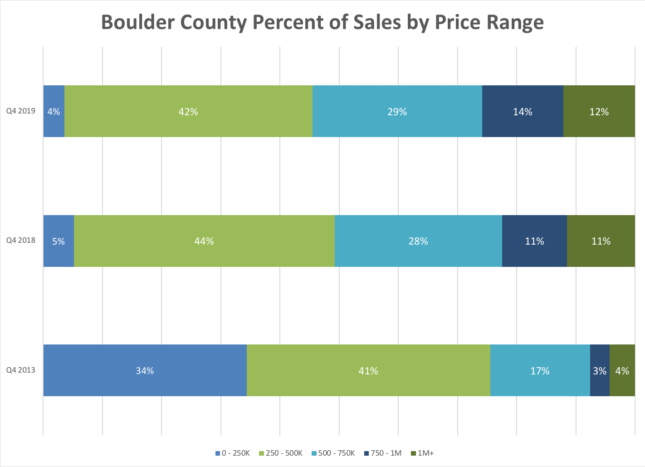
In Boulder County during the 4th quarter just 4% of all sales were for $250,000 or less. Compare this to five years ago when 34% of sales were for less than $250,000. During the most recent quarter 26% of sales were for $750,000 and above. Five years ago it was 7%.