by neil kearney | Jul 22, 2010 | Boulder County Housing Trends, Statistics
What is happening in the Boulder real estate market? That’s a tough question but I think I will answer by giving some perspective.
The normal cycle for selling homes in the Boulder Colorado starts slow in the winter, then activity picks up during the spring until it reaches its peak in May or June. After the peak we usually go in a stair step pattern back down to the holidays. The shape of the sales curve during most years is a bell curve. This picture only includes sales so for contracts written you must move the curve to the left 1 month. So where does this put us now that we are in the last week in July? By all accounts we have reached our peak for the year, the only question is how strong the rest of the year will be.
Interest rates are incredible and any buyer who is sitting on the fence worried about the state of the market will be kicking themselves if they don’t take this opportunity. NOW is the time to act!

The chart above shows weekly activity in the Boulder County real estate market since April of 2009. Here you can see the cycles of accepted contracts in blue and closed sales in red. I have highlighted the time frame of late June to late July during 2009 and this year so that it is easier to compare market activity. This year after reaching a climax in contracts on April 30th (end of tax credit) we have seen a sudden a sharp drop which has now stabilized at about 70 contracts accepted in any given week. This is about 10 below last year.
Another measure of if houses are selling is under contract percentage. The higher the percentage, the more activity in the market. As a rule of thumb anything above 15% is considered healthy and strong. Here are some current market statistics for Boulder County.
- All price ranges – 12% of active homes are under contract.
- $400,000 and less – 13.7% of active homes are under contract.
- $400,000 – $800,000 – 13% of active homes are under contract.
- $800,000 – $1.2 million – 8% of homes are under contract.
- Greater than $1.2 million – 4.2% of active homes are under contract.
- City of Boulder – 12.3% of active homes are under contract.
So the answer to the question ‘Are Houses Selling in Boulder County?’ is yes! There is still market activity but frankly I’m surprised more buyers are not taking advantage of fixed rates that start with a “4”.
by neil kearney | Jul 19, 2010 | Boulder County Housing Trends, Statistics
One of the most common questions of potential home buyers and sellers in Boulder County is “have homes appreciated or depreciated”. The best way to answer this question is to have me or another qualified Realtor out to your house to do a comparative market analysis. But many people are not that serious and are just curious how their biggest investment is faring in today’s tough real estate market.
The next place people seem to look is Zillow.comor other online home price estimation tools. Easy, absolutely! Accurate, not so fast. To see more on the accuracy of Zillow, take a look at a previous blog post of mine titled “How Accurate is Zillow?” The gist is that on a bulk basis their algorithm seems to work pretty well but on an individual basis the value quoted I have found to be quite wrong.
Another tool which I find interesting is the “Home Price Calculator” on FHFA’s website. This tool asks for two inputs; the price of the house at time of purchase and the quarter in which a house was purchased. The tool then takes the average appreciation for the whole metropolitan area in which the house sits and gives you a value to the nearest quarter.
Let’s look at this a bit more closely to see how well it works. I chose 3 properties at random from today’s sold list. The only criteria was that they needed to have been sold at least one other time since 2006.
Property 1: 207 Iroquois Boulder, CO 80303 – Sold May 2002 for $362,500 and sold again for $415,000 on July 19, 2010.
The actual appreciation was 14.5% and the predicted price appreciation was 15.4%. Here is a screen shot of showing the estimated value of $418,199. Very close to the actual of $415,000. The predicted annual appreciation for this Boulder house was an average of 1.9%. The actual annual appreciation was 1.8%.

Property 2: 227 Springs Cove Louisville, CO 80027 – Sold for $277,000 in April of 1998 and then sold again for $453,000 on July 16, 2010.
In this case the actual appreciation was less than the model expected. Actual home appreciation was 63.5% or 5.29% per year. The predicted appreciation was 71% total or 5.9% per year.

Property 3: 6156 Willow Lane Boulder, CO 80301 – Sold for $177,500 in December of 2002 and then sold again for $199,500 on July 10, 2010.
The appreciation of this Gunbarrel condo again matched closely to the predicted model. Actual average home appreciation was 1.7%, predicted appreciation was 1.8%.

This tool seems to work well but it does have limitations. I tried to chose houses that did not have any major upgrades. The model does not allow for any upgrades, therefore it doesn’t account for any increases in value in comparison to the average.
As always, the current price is what a willing buyer pays a willing seller. As a Realtor I can’t change market value but I can provide you the best information and marketing so that you can maximize your proceeds.
Quick Fact: Average annual home appreciation in Boulder from 1993 – 2009 = 11.1%
by Neil Kearney | Jul 8, 2010 | Boulder County Housing Trends, Statistics |
http://viewer.docstoc.com/var docstoc_docid=”46408166″;var docstoc_title=”Boulder Real Estate Statistics June 2010″;var docstoc_urltitle=”Boulder Real Estate Statistics June 2010″;
Boulder Real Estate Statistics June 2010
- Sales for June reflected the residual sales from the tax credit.
- All residential sales are up 23% year-to-date. June sales were up just .5% compared to June 2009.
- The momentum has shifted and sales will slow going forward.
- Interest rates and move-up buyers continue to fuel growth.
by neil kearney | Jun 30, 2010 | Boulder County Housing Trends, Statistics |
The sales statistics for the Boulder Colorado area continue to be strong but closings are only part of the story. Real estate transactions have a lag time and this months closings are a result of past months activity. We are just a day away from the original closing deadline for the tax credit so the stimulus effect officially ends this week.
It looks as though we were helped immensely by the tax credit but as it expired our market slowed down again. Showings seem to be down quite a bit but what is dramatic and telling is the under contract percentage. Here is breakdown of under contract % by area:

The activity has dropped in every local locality since early May. Most dramatic are 12% drops in Louisville, Lafayette and Longmont. Boulder dropped 11%. Not a very good indicator for the coming months.

The table above shows the under contract percentage in Boulder County by price range. Not suprisingly, the largest decrease was in lowest price range where the tax credit had the most effect.
Here is the data with a few more dates in a visual format.


by Neil Kearney | Jun 22, 2010 | Boulder County Housing Trends, General Real Estate Advice, Real Estate 101, Statistics
What makes home prices fluctuate? There are many underlying reasons why home prices rise and fall but when you get right down to it is is good old supply and demand. If there are many buyers and few sellers prices will rise because of the scarcity. The converse is also true, if there are many homes on the market and few people want to buy them prices must come down in order to motivate and attract would-be buyers. Economics 101, right?
Home prices around the United States have been declining over the past few years. We haven’t lost population but with the poor economy and tight credit which still prevails there are fewer buyers purchasing homes.
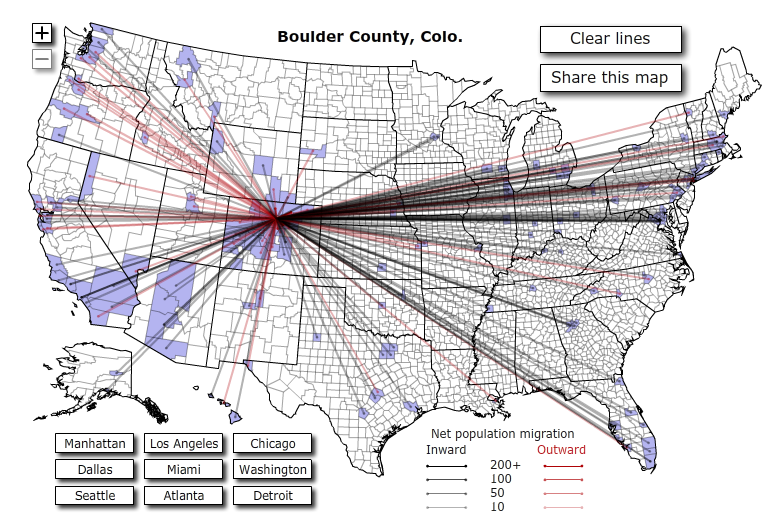
A few days ago a very cool population migration map was brought to my attention. The interactive population map which is presented on forbes.com shows, by county net migration and immigration. The really cool part about this tool is that is shows where the people are going and to what degree. To play with the map yourself go to here. I’d recommend it.
I also am a big fan of the Federal Housing Finance Agency’s quarterly housing price index. The index shows how home values have fared in 300 metropolitan areas throughout the United States on a quarterly, 1 year and 5 year basis. It then ranks home price appreciation using that data.
I thought I would see if there was a link between home values and the migration patterns. I hope you find some interest in the following presentation.
After studying it, I am struck by how good our position is here in Boulder County going forward. All predictions show that we are going to continue to gain population. We have a stable economic base. One of the best technology centers around, a vibrant university and a emerging industry to be as ConocoPhillips moves to our area in a few years.

by Neil Kearney | Jun 17, 2010 | Boulder County Housing Trends, Statistics
The National Association of Realtors (NAR) has just released a local market report for Boulder County. It is quite thorough and I’d thought I would pass it along. If you don’t want to wade through the details here are some highlights. All data and conclusions drawn are based upon data ending March 31, 2010.
Sales Data:
- 1 year appreciation in Boulder County +2.3%. (US -.5%)
- 3 year appreciation in Boulder County -9.4% (US -22.1%)
- 3 year housing equity gain -$34,900 (US -$47,333)
- 7 year housing equity gain $31,400 (US -$467)
- 9 year housing equity gain $41,400 (US $22,733)
Local Financial Fundamentals:
- 12-month job change -3,300
- 36-month job change -7,800
- Current unemployment rate 6.4%
- Year ago unemployment rate 6.8%
- Commentary – Job losses are a problem and will weigh on demand, but layoffs are declining which could help buyer confidence. Unemployment in Boulder is better than the national average and improving.
- The current level of construction (as measured by new permits) is 82% below the long-term average.
- Single family housing permits are down 16.3% lower from last year but they may have bottomed.
- Local affordability is improved. Locally 16.5% of income goes towards mortgage payments. Our historical average is 20.6%. Houses are more affordable (lower prices, low interest rates).
Foreclosures:
- 92.3% of local mortgages are prime (not sub-prime or no-doc, interest only, etc.). The national average is 88.5%. This stability in type of loan has allowed us to have been less affected by foreclosures.
- The percentage of prime loans in foreclosure at the end of February was .9% (US 2.7%)
- The percentage of subprime loans in foreclosure at the end of February was 11.9% (US 17.9%)
- The percentage of Alt-A loans in foreclosure at the end of February was 4.9% (US 14.8%)
- The number of 60 day and 90 day delinquencies continues to rise both locally and nationally.
The report is filled with reports and graphs and has additional commentary. It is quite robust and it supports my overall view of the market. In my view we are plugging along but not out of the woods. Overall we are doing much better than the nation as a whole.
Click here to view and or download the NAR report on Boulder County.

