by Neil Kearney | Jan 18, 2018 | Boulder County Housing Trends, Statistics |
2017 Year In Review
Half-way through 2017 we saw a shift in the Boulder area real estate market. The first half of the year was a continuation of the very hot market we experienced in 2014-2016 with rapid price appreciation, low inventory and a strong sellers’ market. During the second half of the year we experienced a softer market characterized by homes staying on the market longer, more price reductions and more balanced negotiations.
Here are some of the key statistics in Boulder County from 2017:
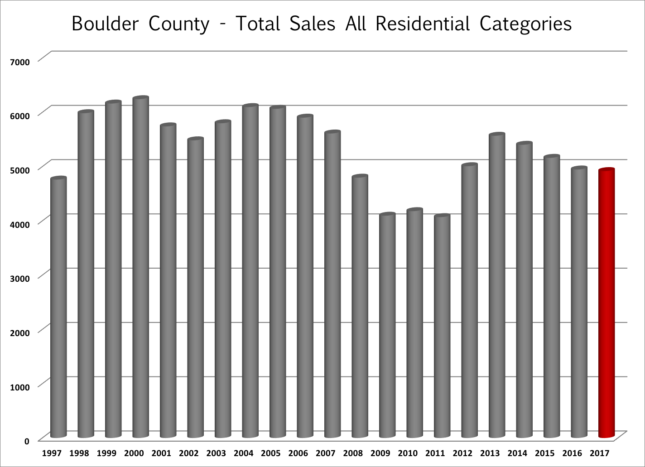
- Total sales were down 5% to 4,680 sales.
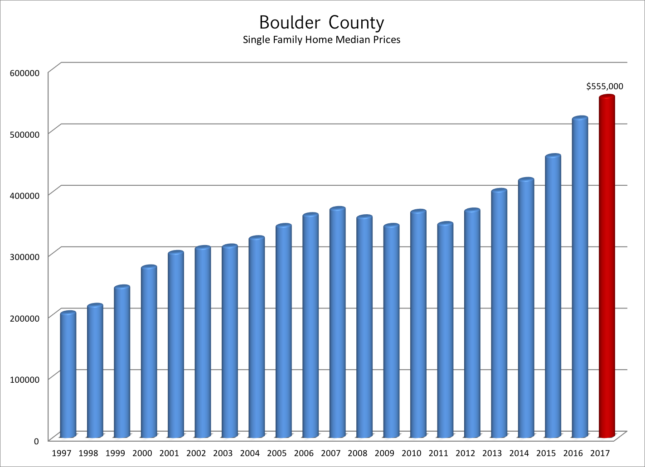
- The median price for all sales in 2017 was $480,000 which is up 6% from 2016.
- There were 490 sales that exceeded $1 million during the year which is 64 more than a year ago, 124 more than two years ago and 301 more than five years ago.
- At the end of December there were just 777 residential properties on the market in Boulder County and 331 of these were already under contract. This represents a low mark since I have been keeping track.
Over the past 10 years, owning real estate in Boulder County has been a great investment. Cumulative appreciation since 2007 has exceeded 60% with most of that occurring during the last five years.
What’s Been Driving The Market?
The United States is 8 ½ years into an expansion. This represents the 3rd longest consecutive expansion period since the Great Depression.[1]Colorado and especially Boulder County have benefitted from the strong economy. Colorado added approximately 60,000 new residents from migration and 56,300 new jobs in 2017. The unemployment rate in Colorado is 2.5% which is second best in the nation. Boulder County’s unemployment rate is 1.9%.
People come to Colorado for the strong economy, the sunny climate and the outdoor lifestyle. Telecommuting, e-business and a proliferation of startups is allowing many people to make their Boulder dreams come true. Colorado has an especially young population, 55% are between the ages of 20 and 59 and 25.4% are 19 or younger.[2] Despite earlier reports, millennials are in the market for and are buying homes.
Colorado’s population is expected to continue to grow. The current population of 5,538,180 (in July of 2016) is expected to grow to 8,461,000 over the next 30 years. With the proliferation of young, educated and a relatively highly paid workforce ($54,664 in Colorado and $74,615 in Boulder County[3]) it seems that Colorado in general and Boulder County in particular are set for continued growth.
Recently there has been a shortfall in new residential housing. Builders are building and neighborhoods are sprouting up wherever there is vacant land but the demand from newly formed households still exceeds the supply. Many of the newly constructed units of the last few years have been rental apartments and it seems that there is a bit of softening in the “for rent” market.
Where Are We In The Real Estate Cycle?
Real estate is cyclical. There are many factors involved, but the peaks and valleys of the real estate demand and value have been shown to have a relatively consistent cycle of approximately 18 years. Economist Homer Hoyt made a detailed study of the Chicago real estate market and the broader United States real estate market and found that it has run its course in a steady 18 year rhythm since 1800. There have been exceptions that have disrupted the normal cycle such as The Great Depression, World War II and the post war boom; but on average, the business cycle and the real estate cycle have been very consistent including the 18 year cycle than ended in 2008.
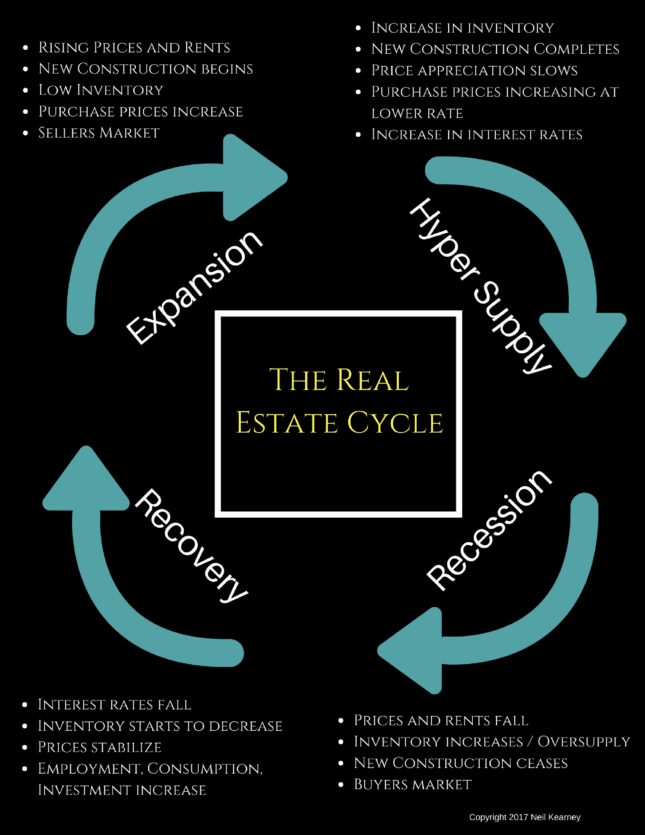
The infographic on this page shows the four phases of the real estate cycle; recovery, expansion, hyper-supply and recession. The last cycle ended in 2008 and we are almost 10 years into the recovery and expansion. To read more about this subject including the details of each stage of the real estate cycle go to www.NeilKearney.com/ 2017/12/05/the-real-estate-cycle-where-are-we-now/
The difficult question in any market is to know where you are now. First let’s eliminate where we know we are not. We are not in recession, nor are we in recovery. Over the last ten years, the Boulder area real estate market has come through the recession phase and then quickly moved through the recovery phase. I say quickly because we were fortunate not to have a big back log of foreclosure homes that needed to be sold. Since mid 2012 we have been in the expansion phase.
Throughout the Denver Metro Area we have seen unprecedented construction of rental apartments. We have seen a steady stream of new residents drawn to our area by a good economy and a great lifestyle.
We have seen compounding double-digit real estate appreciation that rivals the top markets in the nation. Early this summer, the temperature of the expansion seemed to have been turned down a few notches and we are now seeing a slowing in price appreciation and a bit less demand. However, our inventory is still very low and the overall economy is still doing well. We seem to be at the beginning of a cycle of increasing interest rates but a 30 year mortgage is still around 4%. To me it seems like we are still in the expansion phase, but if each phase was a day we would be definitely in the afternoon. Here are the next signs we need to look for which would indicate a shift toward the hyper supply phase: 1) increased vacancy rates on rental properties 2) Meaningful increase in interest rates 3) Increased inventory of resale homes for sale 4) New home builders offering incentives and price reductions.
If we are to believe that the real estate cycle runs in an 18 year cycle, we would expect our next major recession in 2024.
Home Price Appreciation
Since the second half of 2012 strong price appreciation has been the direct outcome of the positive household creation, lack of inventory, low interest rates and a growing economy. During the first two quarters of 2017 we saw a continuation of this strong trend. According to FHFA.gov the average home appreciated by 3.03% during the first quarter and 3.4% during the second quarter. The third quarter results from FHFA showed that Boulder had -.59% appreciation. This snapped a five year run of positive quarterly returns and may have signaled a change in the market. I will continue to track this to see if this was just a short break or if it was a shift.
One statistic that points to the fact that it may be an anomaly is active inventory. In a market that is losing steam you would expect to see a measureable gain in inventory, homes on the market. But at the end of December, and throughout the year inventory has not increased much at all.
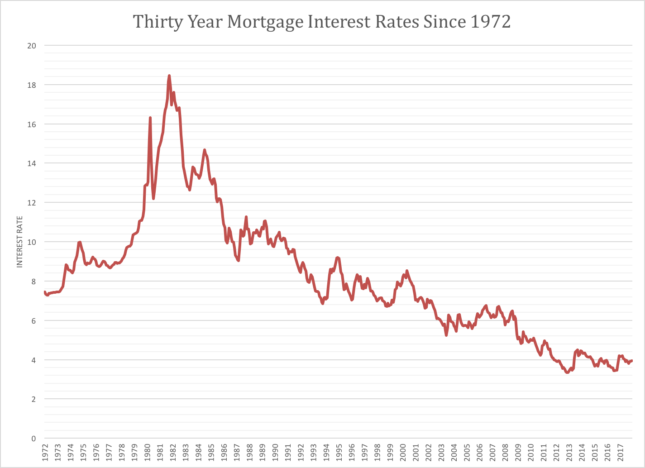
Affordability
As this is written in early 2017 long term mortgage rates are still hovering below 4%. This rate is still near the all-time lows (see the figure below). The Federal Reserve Bank is beginning to raise their short term interest rates and this might be the year that interest rates rise enough to cut into affordability. Affordability is the balance point for each potential purchaser between price, cost of money and income. Incomes are rising in Colorado but very slowly when compared to the increase in the price of real estate over the past five years.
The New Tax Bill and Its Effect On Real Estate
The recently passed federal tax bill will definitely have an impact on real estate. In general markets with high taxes and high values will be most affected. Despite the recent increase in local property taxes, Boulder County is considered a low property tax area compared to other parts of the country. However, we are a high value market. The issue is the reduction in the cap for eligibility for the mortgage interest deduction. Previously the cap was $1 million and it has now been reduced to $750,000. Not many people have loans in excess of $750,000, but in our area where the luxury home market is very robust, we may see fewer buyers able to make those purchases.
The Boulder County Treasurer was inundated before the new year with property owners pre-paying their property tax bill in advance. This was in response to the section of the tax bill which caps the deduction for state and local taxes at $10,000. Previously, homeowners were able to deduct from their federal tax return the amounts paid for state income tax, various ownership taxes and property taxes without limit. Now the deduction is limited to $10,000. Buyers may shy away from a house with a large tax bill knowing that payment will no longer reduce their tax bill.
The tax bill also increased the standard deduction and reduced business tax rates among many other changes, so it’s not easy to compute the individual effect. What has become apparent, is that the subsidy of real estate through income tax deductions is now reduced and it may affect property values.
The Future
It’s much easier to report the past than it is to predict the future. But that doesn’t stop us all from looking forward and trying to make sense of what is to come. The local real estate market did slow down last year. I don’t think anyone expected that it was to go forward at break neck speed indefinitely. However, I think there is still strength in the market. Population is growing, we have a shortage of homes, the economy is strong and people want to live here. One of our main challenges is reduced affordability caused by high prices and increasing interest rates. The 2018 Colorado Business Economic Outlook put out by the Leeds School of Business predicted home appreciation in the 3-5% range. This seems about right to me.
Now, more than ever you need a real estate advocate who has the experience and knowledge to lead you through this market. Neil Kearney, the owner and managing broker of Kearney Realty Co. has been a trusted resource for his clients in the Boulder real estate market for over 25 years. If you plan to buy or sell real estate, go with a local, trustworthy, award winning Realtor. As you start to plan a move, call Neil for a no obligation consultation.
[1] Leeds Business School’s “Colorado Business Economic Outlook 2018”
[2] IBID
[3] IBID
by Neil Kearney | Jan 15, 2018 | Boulder Real Estate, For Buyers, For Sellers, Statistics
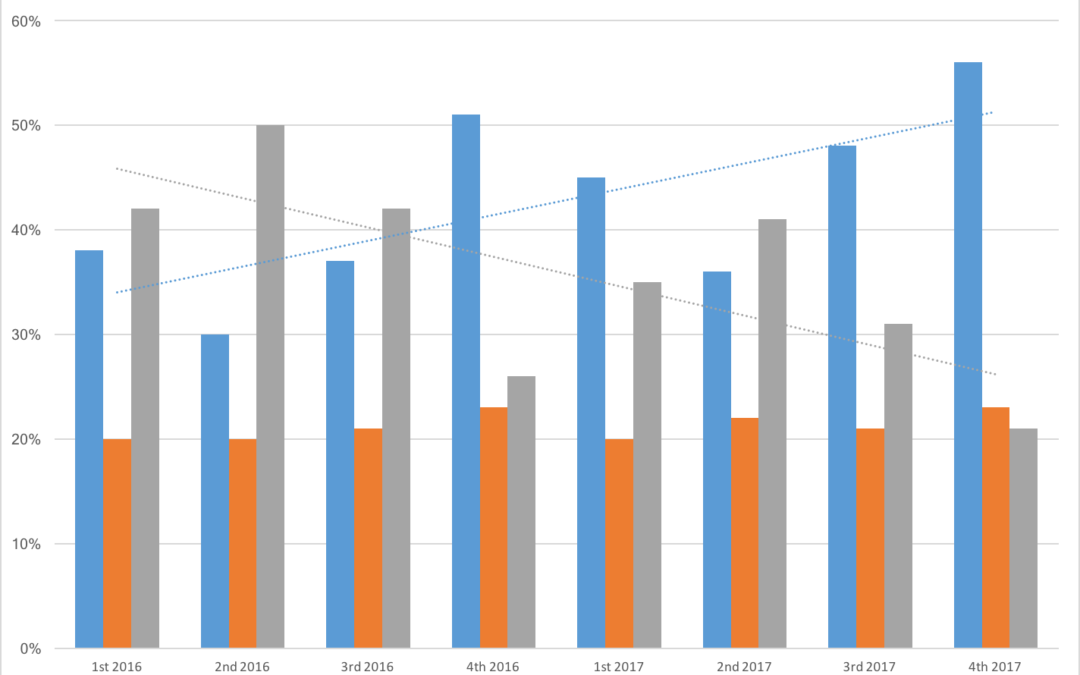
In 2017 in Boulder County, the average negotiation off of list price for all sales was 1.3%. In 2016 it was .36%. However, when you look at it more closely both over time and across price ranges there are some good market insights. The chart below shows the sales in each of the last four quarters separated into three categories; those that sold for below the list price (blue), those that sold for exactly list price (orange), and those that sold for above list price (grey). As an example, let’s look at the second quarter of 2016 which is the second group from the left. During that quarter Boulder County was ranked #1 in the nation for appreciation by FHFA.gov. During the quarter, 30% of the sales went for less than the asking price, 20% went for exactly the list price and 50% of the sales sold for a price in excess of the asking price. This past quarter 56% sold for less than list price, 23% went for exactly asking price and 21% went for above the list price. The overall take away is that buyers have gained some traction in negotiations. There are two trend lines that intersect. The upward trending blue line represents the trend of properties selling below the asking price. The downward trending grey line shows the trend for homes selling at a premium.
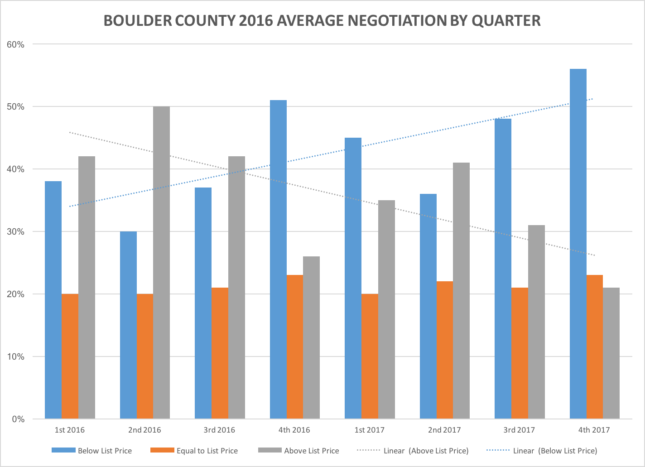
With the information above we can conclude that the overall market is trending away from a strong sellers market. But in real estate broad generalities are not always accurate. When we look at individual price ranges we find that the lower range is still very strong and in the luxury ranges the market has shifted more strongly toward the buyer. During 2017 the average sales price to list price ratio was 98.7%. In other words, on average buyers were able to negotiate 1.3% off of the list price. However, when we break this down by price range we find that during 2017:
- Homes that sold for $500,000 or less sold for .9% above list price.
- Homes that sold between $500,000 and $1,000,000 sold for .4% above list price.
- Homes that sold between $1,000,000 and $2,000,000 sold for 2.75% below list price.
- Homes that sold for prices above $2,000,000 sold for 4.17% below list price.
The bottom line is that if you are buying a house in the entry level of any of the Boulder County communities you won’t have much wiggle room on price. If you are in the market for a home in the luxury range you will have much more room for negotiation. Don’t be fooled by averages.
by Neil Kearney | Dec 13, 2017 | Boulder County Housing Trends, Statistics
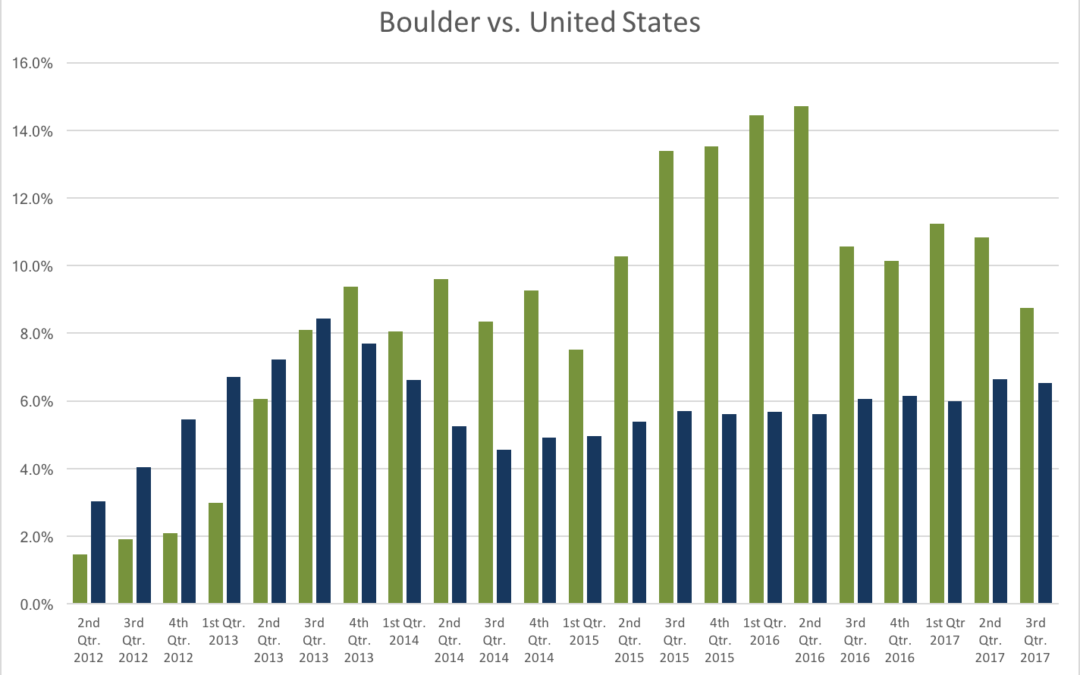
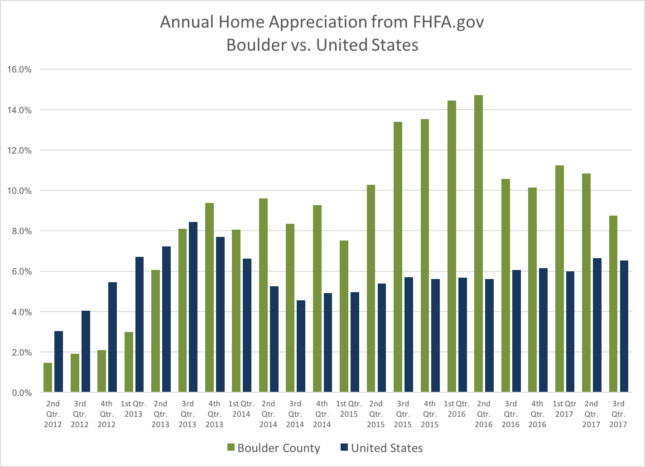
I began reporting in June that the market had shifted around Memorial Day. Since then, sales have declined when comparing same month closings. FHFA.gov recently released their quarterly “U.S. House Price Index” which reports on price appreciation in the 253 metropolitan areas in the United States. Looking at yearly appreciation, Boulder (the Boulder MSA includes all of Boulder County) shows an annual increase of 8.57% which is 57th best in the nation. Boulder County has been ranked in the top 20 each quarter since the 2nd quarter of 2015 so this recent ranking is a bit of a fall from the lofty perch we have recently been inhabiting. However, nearly 9% annual appreciation is still impressive and certainly above our historical average.
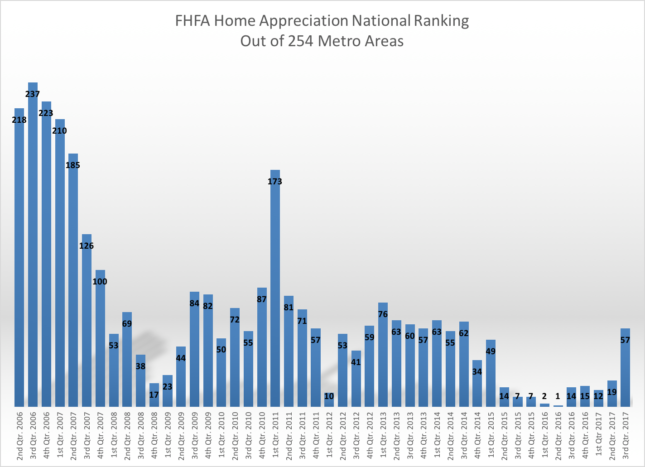
What was more concerning in the report was the appreciation rate for the 2nd quarter. The average home appreciation in Boulder County between July 1 and September 30th was a negative .59%. This is the first negative quarterly reading since 2nd quarter 2012, just before our market took off. This quarterly appreciation rakes us 12th from the bottom of the 253 markets. One quarter does not a trend make but it is something to watch and confirms the shift in the market. The first chart below shows the four quarter trailing annual appreciation for Boulder County and the United States. Over the past five years the cumulative appreciation has been 58.29%. The second chart below shows the ranking since 2006 (lower numbers show a better ranking).
Here are some other related articles that may give you some added context:
https://www.neilkearney.com/2017/09/05/summer-wrap-whats-next-boulder-real-estate-market/
https://www.neilkearney.com/2017/06/05/tracking-boulders-home-appreciation-time/
The Real Estate Cycle – Where Are We Now?
by Neil Kearney | Nov 6, 2017 | Boulder County Housing Trends, Statistics
Sales Down – Inventory Stable – Increased Price Reductions and Negotiation
As we head toward the holidays and the end of the year it is normal to see a slow down in the market. During October sales were down 3.7% from last October and down 17% from two years ago but they were actually up by 12% from sales in the previous month. So while the overall trend shows a general slowdown in the market that started around Memorial Day, there is still some life in the market and sales are still happening. In October there were 392 closings in Boulder County.
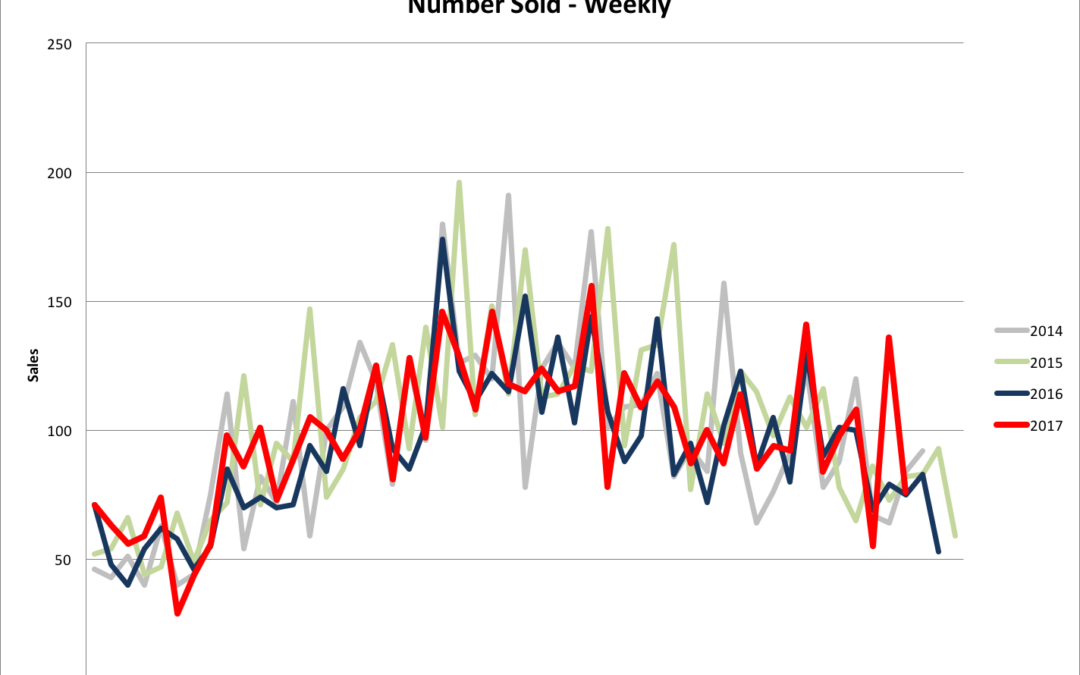
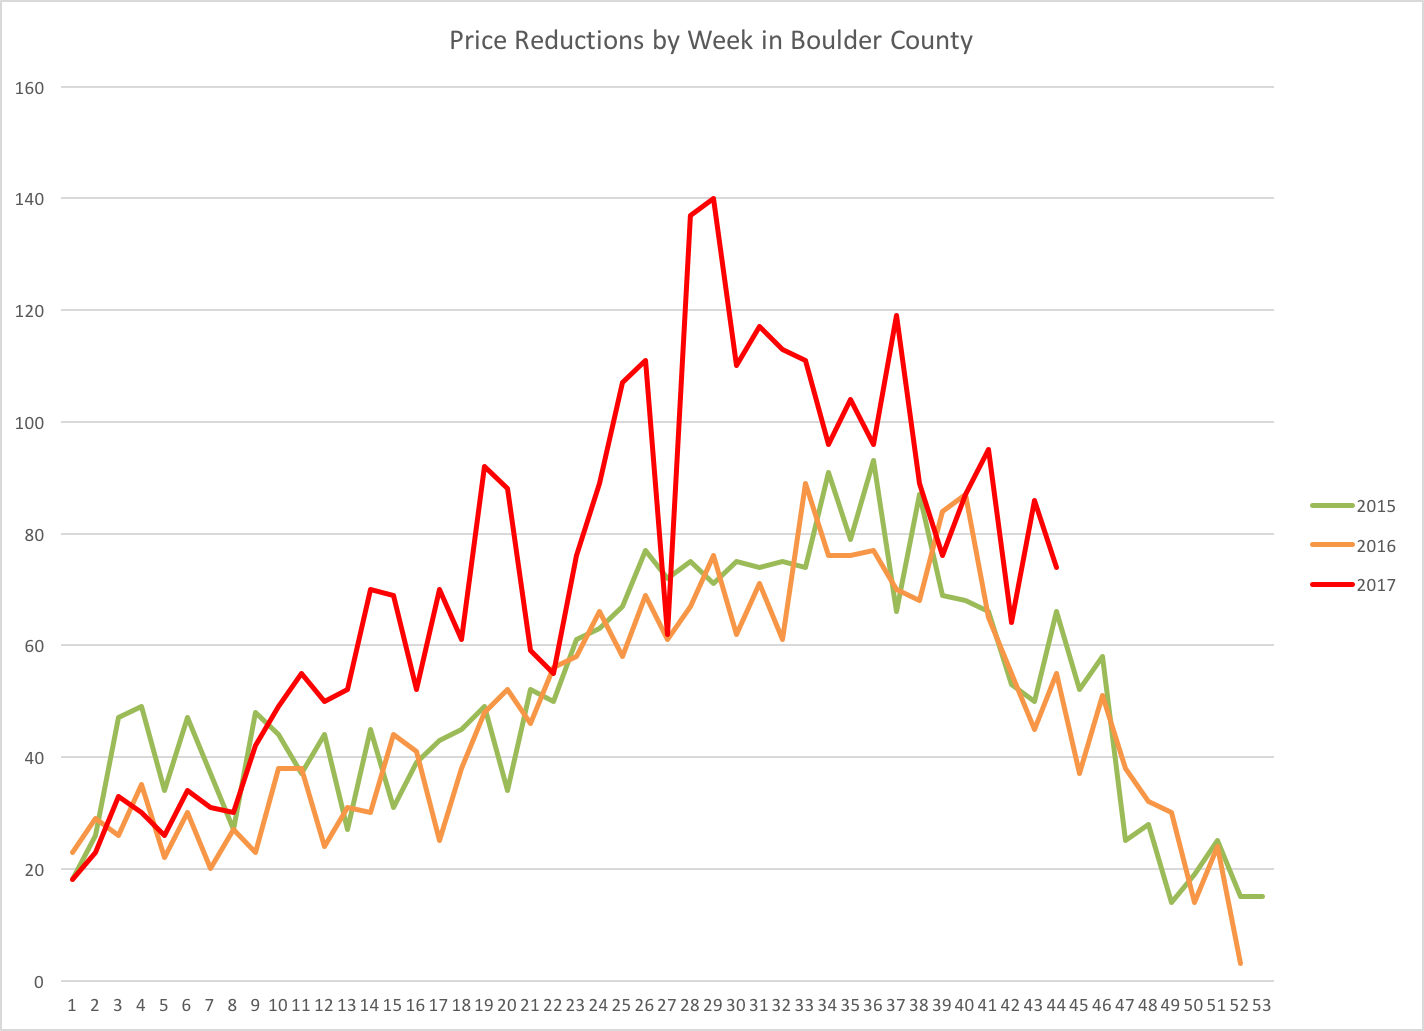
Inventory showed some good improvement during the first half of the year but over the past few months it has reverted to levels that are lower than last year. As the market has slowed we have seen a bit more negotiation (on average homes sold for 97.4% of list price which is roughly 1.4% lower than a year ago) in the market as well as many more price reductions (see the graph directly below).
All of the trends in the market are highlighted in the slide presentation below.