by Neil Kearney | Jun 16, 2018 | Boulder County Housing Trends, Statistics
The number of sales in the month of May in Boulder County were down by just over 4%. Year-to-date sales are also down by roughly the same amount.
This spring the market has again been strong. In many ways it was similar to the past few years. 37% of sales during the first five months of the year resulted in a price above the list price with an average premium of 3.68% for those that did sell above list price. Last year that number was was similar. Sales are down roughly 4%for the year and from my experience in the market representing both buyers and sellers is that there have been fewer bidders in multiple offer situations. More like two rather than five.
Here are the current months of inventory by price range:
$0- $500k – 2.6 months
$500k – $1M – 4.2 months
$1M – $1.5M – 6.8 months
$1.5M – $2M – 6.7 months
$2M – $2.5M – 5.8 months
$2.5M – $3M – 19.6 months
>$3M – 25 months
A balanced market is 6 months. Anything less is a seller’s market any more is a buyers market.

by Neil Kearney | May 27, 2018 | Boulder County Housing Trends, Statistics
The low inventory throughout Boulder County has resulted in a decrease in sales compared to last year. Sales are down roughly 4% through the first four months of the year.
One trend that is new list year is the large increase of sales in the highest price ranges (greater than $2 million). During the first four months of 2017 there were 16 sales over $2,000,000. this year during the same time frame there have been 39 sales. This is a mix of new construction and resales.
The market is moving quickly and we are still seeing many buyers moving in from out of town.

by Neil Kearney | Apr 15, 2018 | Boulder County Housing Trends, Statistics
 The Kearney Report – First Quarter 2018
To download and view the report, click this link –The Kearney Report 1st Quarter 2018
Or you can view the entire report online below.

by Neil Kearney | Apr 10, 2018 | Boulder County Housing Trends, Statistics
How’s the market? Overall it’s good. Sales are down roughly 4% through the first three months of the year. To me the market demand seems strong enough, but the low inventory has reduced the possibilities of a buyer finding the right house. It’s
The strength of the market definitely depends upon the price of the home. Here is a quick indication of the strength of the market by price range:
Price Range Active Listings # Under Contract % Under Contract
Under $1 Million 376 424 53%
$1 – $2 Million 121 69 38%
Over $2 Million 79 17 18%
View the slideshow below for a complete update on the market including comparison over the past five years.

by Neil Kearney | Mar 19, 2018 | Boulder County Housing Trends, Statistics
It seems that the spring market is in full swing. Inventory is low and we are seeing multiple offers across many price ranges. Especially competitive are lower price ranges in each of the communities across Boulder County. See the full presentation of the monthly statistics to see the full picture.

by Neil Kearney | Feb 1, 2018 | Boulder County Housing Trends, Statistics
 The Kearney Report – 4th Quarter 2017
I have just finished up The Kearney Report for the 4th Quarter 2017. This report gives an in depth view of the real estate market in Boulder County as well as in the sub-areas of; City of Boulder, City of Longmont and East County (Louisville, Lafayette, Superior, Erie). To download and view the report click this link The Kearney Report 4th Quarter 2017 I always provide my reports to you free of charge and without the need to sign up for a list. You can also view it online below.
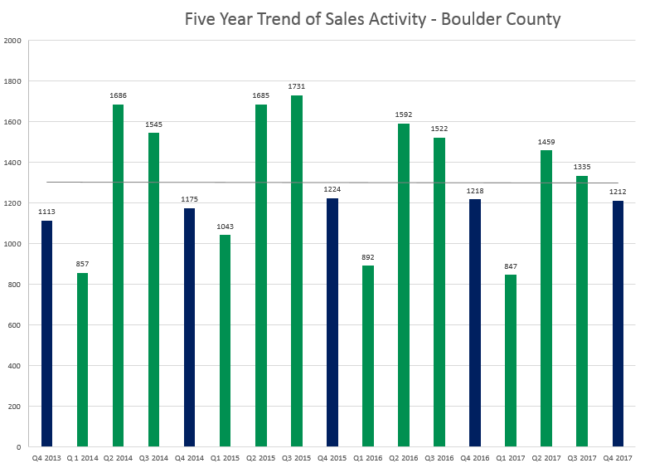
We saw a big drop in sales and activity during the 3rd quarter. During the 4th quarter the market stabilized. Sales in Boulder County were roughly equal to where they were during the 4th quarter of 2016. Here are a few highlights for the quarter (mostly compared with 4th quarter 2016):
Boulder County:
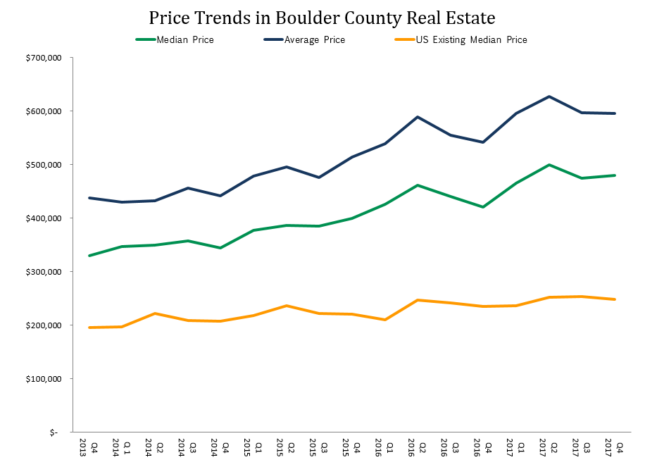
- The median price for the quarter was $480,000. This represents a 14% increase from the same quarter last year.
- It took 5 days longer to sell a home during the 4th quarter.
- There were 3.5% fewer homes on the market at the end of the year.
- At the end of the year there were 3.34 months of inventory on the market. Still a seller’s market.
City of Boulder:
- Sales during the quarter increased by 8.5%.
- Median price of $686,300 (for both condos and single family homes) up 12.5%.
- It took 7 days longer on average to get a home in Boulder under contract. Now 29 days.
- 3.65 months of inventory at the end of the quarter. Just a bit higher than the county but still a seller’s market.
- The average negotiation during the quarter was 2.18% Last year during the 4th quarter it was 1.9%.
City of Longmont:
- Total sales increased by 5% for the quarter.
- Median prices increased by 12% to $374,000.
- Average negotiation off of list price was just .36%.
- On average it took 25 days to get a house under contract.
- At the end of December there were 2.86 months of inventory on the market in Longmont.
East County (Louisville, Lafayette, Superior, Erie):
- Sales were down 1% for the quarter.
- Median prices increased by 4% to $484,770.
- Average negotiation for the quarter was 1.6%.
- On average it took 28 days to sell a home in this area.
- At the end of December there were 3.11 months of inventory in East County.
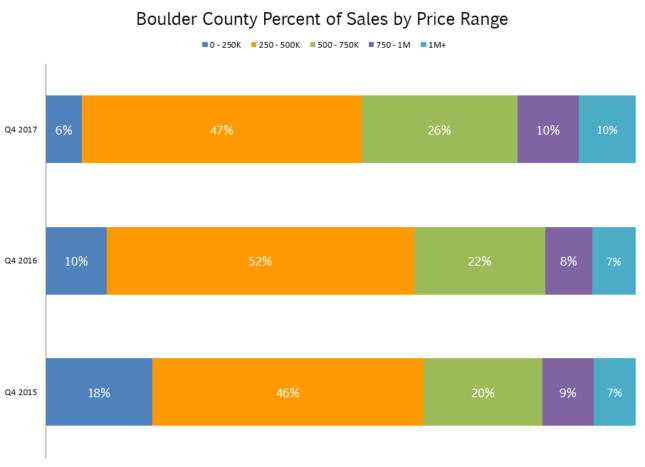
Here are some selected graphs from the report.