The Kearney Report – First Quarter 2019

The Kearney Report – First Quarter 2019

The Kearney Report 1st Quarter 2019Click here to download the latest Kearney Report The Kearney Report 1st Quarter 2019

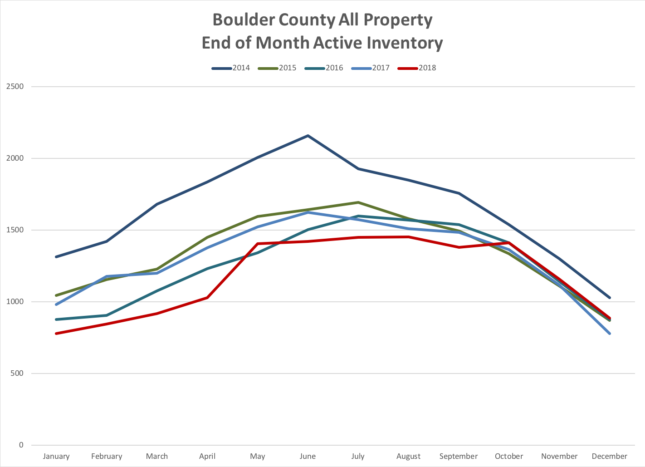
The first quarter of 2019 began as the fourth quarter ended, slower than normal. Through February sales in Boulder County were down 10%. In March sales rebounded a bit and through the first quarter sales were down just 3.2%. The inventory of available homes has been increasing, time on the market is increasing and price reductions are also increasing. I have been describing the market as choppy. Some sellers have found ready buyers and have sold their home quickly. While for others are finding their homes sitting on the market longer than expected.

The pace of appreciation has slowed. In fact, during the fourth quarter FHFA.gov showed negative appreciation in Boulder County. On average prices increased around 6% during 2018 with much of the increase coming early in the year. During the first quarter 22% of homes sold for above list price, 25% sold for at list price and 53% sold for below list price. For comparison, two years ago 35% of the sales ended up above asking price. For the homes that sold, it took on average 42 days to find a buyer. This is roughly 10 days longer than the 2018 average. The average negotiation off of the list price was 2.09% which was roughly .7% more than last year during the same time period. There were also many more price reductions during the quarter (see the graph on page 13). As you look through the report, keep your eye out for the bar graph that shows “Sales by Price Range” for each area.  The inclusion of 2012 as a comparative year in this graph gives a strong visual representation of how the entry level price range has increased over the last six years.  It is really hard for young people just getting started to afford that first home. Starting salaries have certainly not kept up with home prices. Most startling is in Longmont, where in 2012 63% of the sales were for $250,000 or less.  This year just 4% sold in this price range! Many families are being priced out of the market.  Especially as interest rates rise.

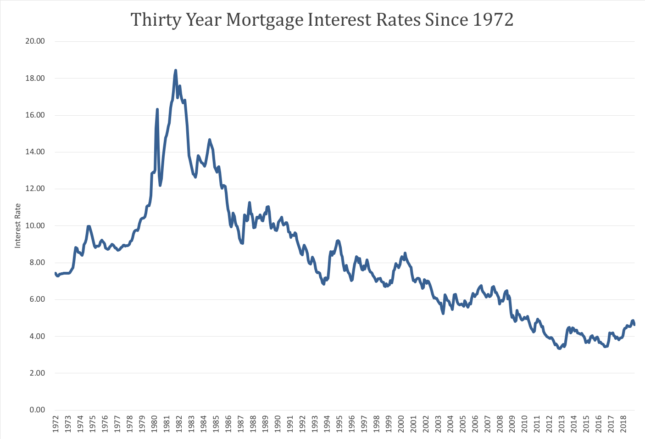
During the first quarter interest rates decreased and the stock market has rebounded nicely after a sharp drop during the fourth quarter. Lower interest rates provide much needed affordability in our high price environment and a strong stock market provides confidence and liquidity for down payments. Especially for buyers in our higher price ranges.

As we come into the traditionally strong late April through June real estate market in Boulder County I’m seeing more activity than we have seen over the past six months but it is definitely more of a balanced market than we have seen in quite some time. The percentage of homes that are under contract is roughly 8% lower than a year ago, inventory is rising and I’m seeing buyers more and more selective and deliberate as they decide on their next home. Never forget that real estate is cyclical. In our area we haven’t seen the wide swings like other high appreciation areas but it seems we are tilting back toward equilibrium. I’m always happy to be of service. Enjoy the report!

Here are three of the sixteen graphs featured in the report.

Boulder County Home Sales

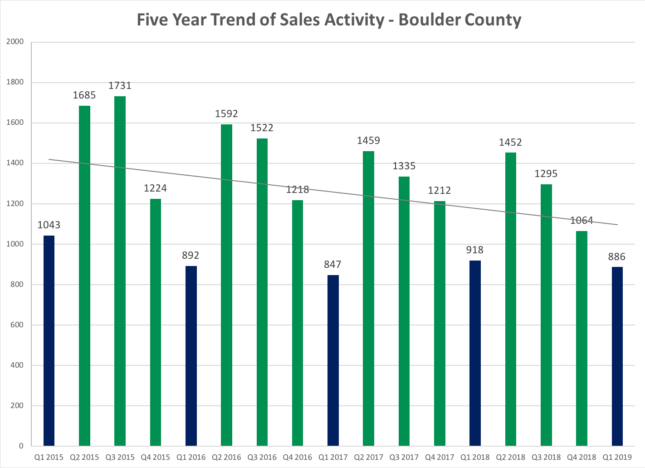
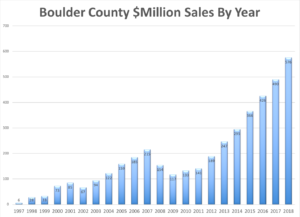
Comparing 1st qtr. 2019 to 1st qtr. 2018 sales decreased by 32 sales or 3.5%. The first two months of the year were down by more than this and March was a better month and helped the average.


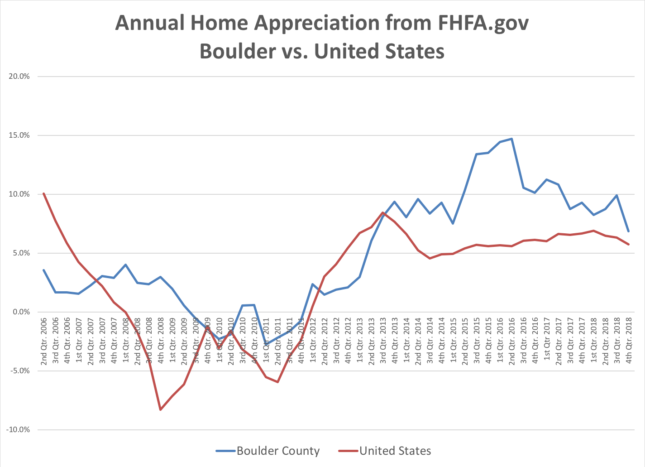
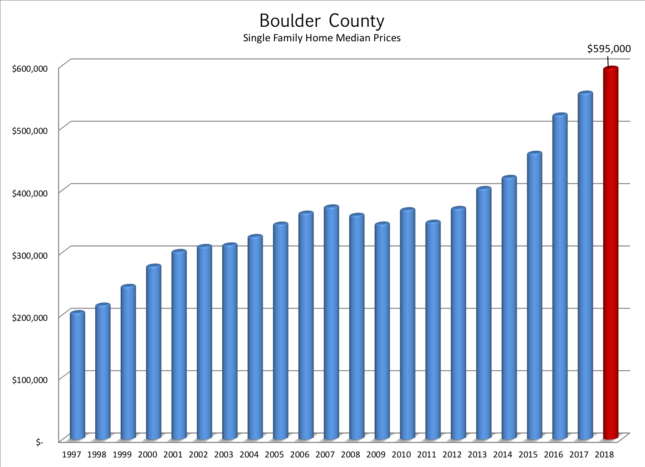
The graph above shows the median price for both Boulder County (blue line) and the United States (red line) since the second quarter of 2006. Each data point shows one year appreciation on a quarterly basis. The most recent quarter Boulder’s four-quarter appreciation was 6.85% which ranked it 97th out of 245 areas in the study.  Over the past five years our cumulative home appreciation has been 60.11% which ranks 14th best in the nation.

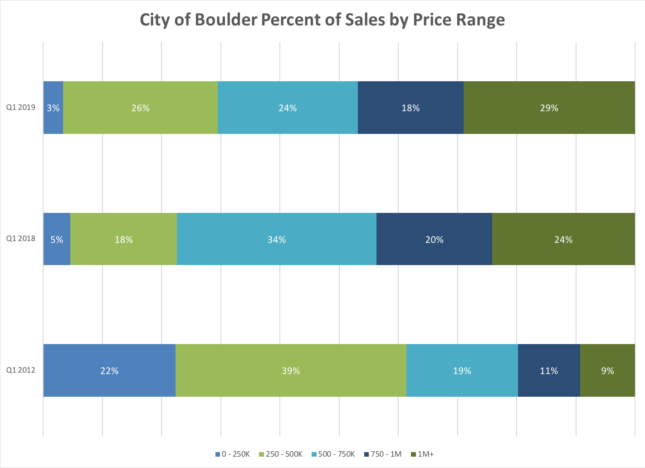
The bottom graph shows the sales which occurred in each price range during the quarter.  The top bar is the most recent quarter, the middle bar is the 1st quarter a year ago.  The bottom bar for comparison represents the sales mix during the 1st quarter in 2012.  This graph is a good representation of how prices have increased, the entry level has shifted considerably to the right and the luxury market has grown.

March 2019 Boulder County Real Estate Statistics

March 2019 Boulder County Real Estate Statistics

The market is choppy.  Some listings are selling quickly and with multiple offers.  However, this is happening less than the past three years and it is common to just have two offers rather than a handful.  Other listings are sitting on the market longer or are needing to reduce the price in order to attract buyers.  The inventory is higher than the past few years which gives buyers more homes to look.  Correct pricing is a must for sellers serious about attracting buyers in that critical first two week period.  Recent activity is strong which is a good sign as we enter the typical busiest month of the year in our market.

Here are a few key slides from the full slideshow below.

As more homes stay on the market for a longer time. Sellers need to compete by lowering the price.  So far this year we are seeing quite a jump in price reductions throughout the market.

At the end of March 43% of of listed properties were already under contract.  This graph shows the number of active homes on the market that weren’t already spoken for.  The pool of showable listings is higher than at any point during the last five years. 

The Pulse of the Market – February 2019 Statistics

The Pulse of the Market – February 2019 Statistics

There has been a lot of press lately reporting that the market has shifted.  Prices are flattening, inventory is rising, sales are falling.  During February, sales were down 4.3% from the previous year.  This however was an improvement in the trend of double digit declines that we saw during the fourth quarter. We are seeing houses stay on the market a bit longer and also more price reductions.  Inventory is also higher than it was in 2018 with more new listings coming online and fewer sales.

In my recent experience, I have seen some really good houses get multiple offers and some good homes sit on the market for quite awhile.  Buyers are picky and it is really hard to tell which homes are going to go fast and those that will sit.

March will be an important month.  Will we see a continuation of the improvement in the recent trend that we saw in February or will we see another dip?  If you look at slide #6 in the slideshow below you see that the contracts accepted during the first two months in March are lagging behind. Enjoy the slideshow and please let me know if you have any questions or comments.

Data is from the IRES MLS system and compiled by Neil Kearney.

January 2019 Real Estate Statistics

January 2019 Real Estate Statistics

Sales in January picked up where the fourth quarter left off.  Sales for the month were down 17%.  This isn’t too surprising since most of January’s closings came as a result of contracts written in December and the market was definitely slow in December.

During January the number of listings that are went under contract on a weekly basis (see slide #5 not including the title slide) definitely picked up but are still below previous years.  Interest rates seem to have stabilized for the moment below 5% and the stock market is rebounding, both of which will help buyers as they consider buying a home.

Boulder County Real Estate – 2018 Year-In-Review

Boulder County Real Estate – 2018 Year-In-Review

2018 Boulder County Real Estate Market Report

Overview

2018 was another strong year for the Boulder area real estate market.  During the first half of the year, the combination of low inventory and strong demand extended the “sellers market” that we have been experiencing since mid 2012.  However, even in the spring, we saw fewer multiple offer situations and fewer overall showings.  During late summer, the market began to show signs of weakness.  We saw more price reductions, it took longer for homes to go under contract, there was more negotiation favoring the buyer and overall sales (compared to the previous year) began to fall.  During the fourth quarter, sales were down 12% compared to the previous year and during December sales were 18% lower than they were for the same time period in 2017.

Here are some of the key statistics for Boulder County real estate in 2018:

  • Total sales were down 4.7% to 4,459 sales. Down 17% from 2015.  (See first large graph below)
  • The median price for all sales in 2018 was $520,000 which is up 8% from 2017.  (See second large graph below)
  • There were 576 sales that exceeded $1 million during the year which is 86 more than a year ago. Not surprisingly, an all time record! See the graph on this page to see the steady climb of + $1 million sales. There are two factors at work here.  First is the cumulative price appreciation. Second is the improvement in the housing stock.  There are many new homes and many significantly remodeled homes which make comparing the present sales to those a decade ago similar to comparing oranges to tangerines.  (See inset graph to the right)
  • At the end of December there were just 885 properties on the market in Boulder County and 328 of those were already under contract. This is more than we had on the market a year ago, but much lower than historical averages.
  • Average days to offer – 32 (Equal to 2017)
  • Average negotiation off of list price 1.14% (1.29% in 2017)
  • 32% of properties sold for a price above the list price. The average premium paid for these sales was 3.3%
  • 45% of properties sold for a price below list price. The average discount on these sales was 3.2%.

Over the past 10 years, owning real estate in Boulder County has been a great investment!  Cumulative appreciation since 2008 has exceeded 60% with most of that occurring during the last six years.

What Caused the Slowdown during the Fourth Quarter?

Affordability – We are 6 ½ years into an unprecedented bull market. While we haven’t yet peaked, there are more and more signs that the market is slowing down.  The main factor buyers look at when they consider a house is “can I afford it?”. There are three parts to this answer; price, income and  interest rates.

Prices are up over 60% over the past five years. Homes were certainly more affordable five years ago, but crying over spilled milk doesn’t help a new resident to the area.  The question is “can I afford it?”.

Incomes in Colorado have increased on average 5.2% over the past five years.[1]  Helpful towards affordability, but with a lower baseline potential buyers are losing ground to prices nonetheless.

Interest rates have been the saving grace for buyers since 2012.  30 year mortgages in the 3’s and 4’s have made home buying (especially as rents have increased) affordable.  But as prices have risen and now as interest rates have increased (see graph below) buyers are finding affordability more of an issue.

Wealth Effect – According to a Daily Camera article in 2015, 36% of sales in Boulder County were all cash transactions. I suspect we were in that range again last year.  We are seeing a huge influx of people coming to Boulder to telecommute or to retire.  Those who are choosing Boulder for the lifestyle have cash to spend.  The stock market is in the midst of the longest bull market in history.  When a correction takes place as it did in the fourth quarter, investors tend to 1) ride out the correction and wait for improvement to their “new normal” and 2) feel less wealthy and therefore delay non-essential purchases.  It seems that we may have seen some of these effects locally as the S&P 500 decreased by 14% during the last three months of the year.

Supply and Demand – What to look for…

When looking at the local real estate market supply comes from two sources – people who list their homes for sale and new construction.  Since the economic crisis in the late 2000’s, the flow of homes to the resale market has decreased consistently.  I have monthly data going back to 2014 and the number of homes on the market in 2018 is over 30% lower than it was in 2014. (see graph below)  Historical inventory is even higher than 2014.  To exasperate this even further, with the strong market, at any given time 40% – 50% of the active listings are already under contract.  When supply at such low levels, buyers face more competition from other homebuyers and prices tend to increase.  In order for the market to shift from a seller’s market to a buyer’s market inventory will need to rise and we haven’t yet seen that happen.

The demand for homes is based upon new people moving to the area. Colorado has been one of the top states in the nation when it comes to net migration.  People are moving here for the lifestyle and the jobs.  In Colorado there were 65,000 new jobs created in 2018. These new jobs attracted 46,059 new residents to the state.  Over the next seven years the State Demographic Office has predicted that Colorado will see 600,000 new residents.[2]  Each of those new households will need housing.

Market inventory is a statistic that gives an indication as to the balance between supply and demand. Simply put, it measures how long it would take to sell all of the listings in a given area if the sales flow would remain constant and no new listings would come on the market.  A balanced market is around 5 – 6 months.  Anything shorter is a seller’s market and anything longer is a buyer’s market.  At the end of December the inventory in Boulder County was 2.23 months, still a strong seller’s market.  It’s interesting to see how this inventory statistic increases across the price ranges.

  • Up to $500,000 – 1.9 months
  • $500,000 – $1 million – 2.6 months
  • $1 million to $2 million – 3.4 months
  • Above $2 million – 8.9 months (buyer’s market)

After a long time of low production and inventory, new home builders seem to be catching up.  Over the past half-decade we have seen many thousands of apartment units built.  These have provided housing for many of the new residents. Recently, vacancy rates have increased and rents have decreased  a bit.  Single family home permits were up 13% and new home sales were up 9% for the year through the third quarter.[3]

Looking Ahead

After a slow fourth quarter, the spring market will be especially indicative about the direction of the market.  As discussed earlier, there is still demand and low inventory, so I don’t expect a big shift in the market.  However, it seems that the rate of appreciation is slowing and that continued rising interest rates will have a negative effect.  I expect sales to decrease slightly and for prices to increase again but more slowly.  This should continue until we start to see increases in inventory.

[1] 2019 Colorado Business Economic Outlook – CU Leeds School of Business

[2] IBID

[3] IBID

2018 Market Highlights

A

Total Sales Down 4.7%

A

Median Prices Up 8%

A

Average Days to Offer = 32

A

Record Low Inventory

You Might Also Be Interested In…


Sign Up For My Monthly Email Newsletter

* indicates required
 

Input the main text content for your module here.

December Sales See Sharp Decline

December Sales See Sharp Decline

Residential real estate sales were down 18% during December compared to a year ago.  This finished up a quarter where sales dropped 12%.  After a strong start to the year, sales for 2018 were down 4.7% compared to 2017.

We are moving towards the spring market, which is traditionally our busiest time of year.  Sales and activity will increase, it will be interesting to see how much.  My expectation is that it will be more of a balanced market rather than a sellers market.  However, despite lower sales over the past few months, inventory is still low.  Fewer homes to view and consider causes buyers to jump on the new listings that are exceptional.  Take a look at the annotated slideshow below to get a better sense of the market.

As always, I’m here to help.