
by Neil Kearney | Jan 24, 2020 | Boulder County Housing Trends, Statistics
The market ended up very strong in 2019, up 5% for the year. We are also seeing some good early activity in the early weeks of 2020. Buyers seem very interested in ”turn key” properties and not as interested in homes that need work. Appreciation for 2019 definitely was less amplified than recent years, but it was still positive. See the slideshow below for more details.


by Neil Kearney | Dec 6, 2019 | Boulder County Housing Trends, Statistics
This time of year the market slows down. Some sellers choose to take their homes off the market for the Holidays and others delay putting their home on the market until after the new year. November sales were down nearly 18% from the previous month but were equal to a year ago. In general, it has been a good year for real estate sales in Boulder. Appreciation has slowed and we are not seeing as many showings or multiple offer situations as we have in past years. Take a look at the slideshow below for a full picture of what is going on.

by Neil Kearney | Nov 22, 2019 | Boulder County Housing Trends, Statistics
October sales surprised me! An increase of 15% from a year ago showed the strength in the market even as showings were slow and inventory was high. The average negotiation off of list price during October was 2.42%, which is up from 1.87% a month ago. We are still seeing a good number of price reductions but those are slowing. As we slow down for the holiday’s we will see a number of active listings go off the market and resume again after the new year. Check out the slideshow below for more details.


by Neil Kearney | Oct 24, 2019 | Boulder County Housing Trends, Statistics
(or you can read it on this page in a viewer below)

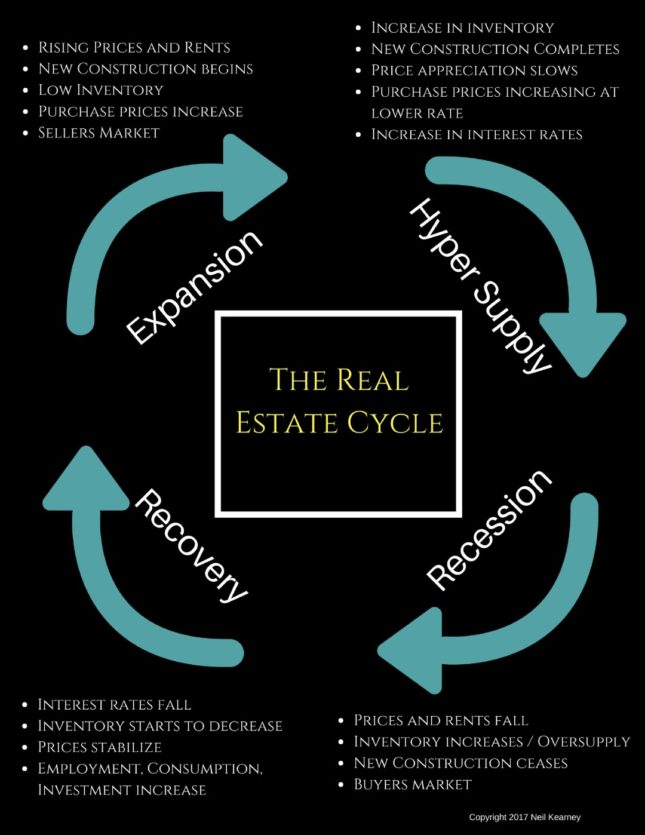
Sometimes it’s easy to forget that change is the only constant. A few years back I created the graphic below. It depicts the real estate cycle and I find that it’s really good to refer to it periodically. It seems that much of what is happening in our current market can be found in the upper right hand corner, “hyper supply”. Of course, it’s not always as easy as pointing to the wisdom of the past and predicting the future. But it’s a good place to start!
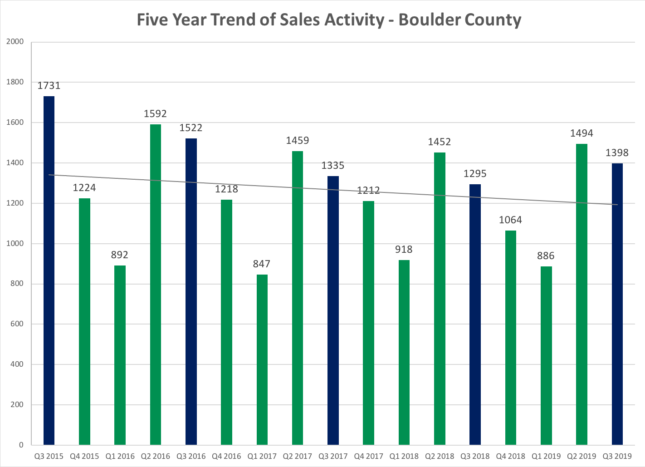
Sales during the third quarter of 2019 were higher than a year ago, up by 8%. However, the market dynamics have changed. Instead of lack of inventory and a strong sellers market, we are seeing increased inventory, longer time on the market, more price reductions and fewer showings. In summary, demand has slowed and supply has increased. This has resulted in less upside pressure on prices and the balance of power in negotiations is shifting away from sellers and towards buyers.
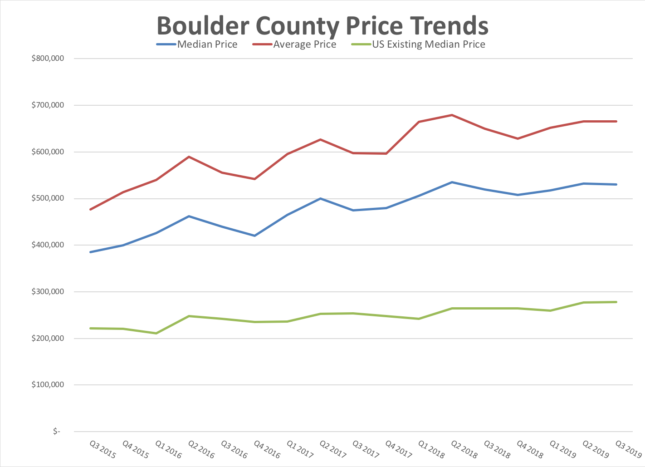
We are not alone, many of the strongest markets over the past five years are seeing softening. This includes San Francisco and Seattle, among others. For the one year period ending June 30th, appreciation in Boulder County was 3.41%.
This ranked us in the bottom half of U.S. metropolitan areas and below the U.S. average of 4.99%. For reference Colorado’s appreciation was 5.36%, San Francisco’s was -.05% and in Seattle it was 1.37%. As the graphic says, purchase prices are increasing, but at a lower rate.
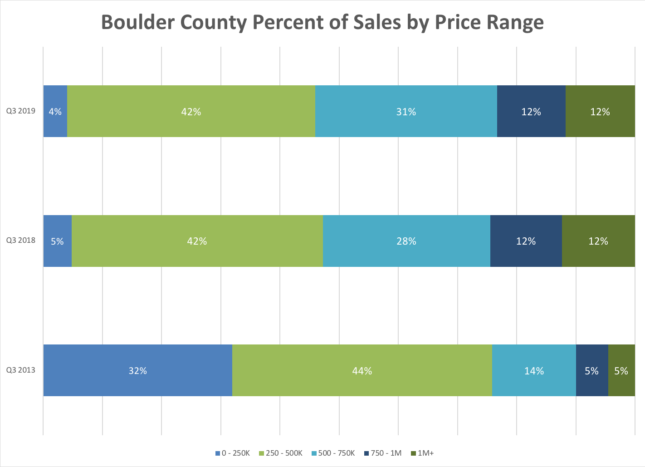
 Inventory hasn’t recovered to historical levels, but there are more properties on the market now than at any time since 2014. Over the past few years buyers have been operating in a scarcity mindset – “not enough homes to buy, better act quickly”, “not my ideal house, but I better grab it”, “how much over full price do I need to pay?” Now that there are multiple choices available for most buyers, they are taking their time, pouring over the details of each home and then considering offer price carefully. Higher inventory also has led to more sales – more buyers are able to fulfill their goals in a shorter amount of time. From the Seller’s perspective, there are fewer showings and pricing is more important than it has been for a long time. We are seeing many price reductions as Sellers and their agents try to capture the attention of prospective buyers. A recent search in Longmont between $300k and $500k resulted in over 100 active listings!
The economic conditions that drive our local market are still very positive. In Boulder County unemployment is under 2% and Boulder businesses are still creating jobs. Our area is still on the national radar as a place to live if you value a vibrant, outdoor lifestyle as well as a strong economy. People are still coming to the area for a variety of reasons and there are many housing options out there to fill the demand. As we have moved through past real estate cycles we have seen prices go flat, not decline. We’ll see what the next few years have in store. Homes continue of sell and as always I’m actively helping buyers and sellers successfully close transactions. I’m always happy to be of service. Enjoy the report!
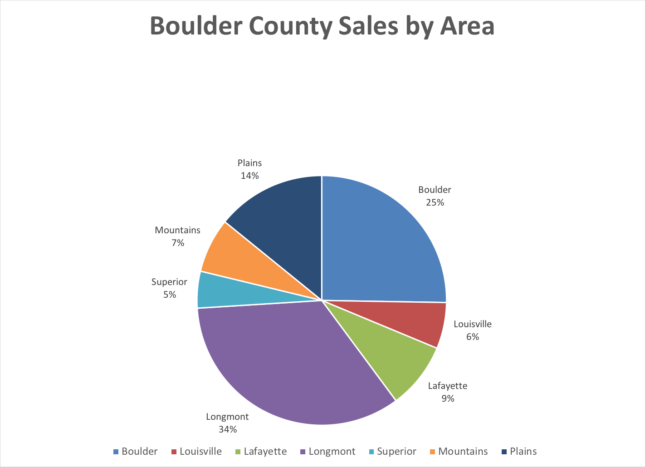
Here are a few charts from the section on Boulder County.
The Kearney Report 3rd Quarter 2019

by Neil Kearney | Oct 17, 2019 | Boulder County Housing Trends, Statistics
September sales were up a robust 15.7%. In many ways the market seems slower than last year, but the sales for the year are actually higher. What’s making the market seem slower than years past are the number of options available on the market. Average negotiation off of list price during September was 1.87%. Prices are holding well for those listings getting offers but for those not getting offers we are seeing many price reductions.

by Neil Kearney | Sep 22, 2019 | Boulder County Housing Trends, Statistics |
Much has been said about a slowing market. I think a better characterization would be a more competitive market. For the year sales are up 1.8% over last year but there are definitely differences in how the market feels this year compared to the last few years. Rising inventory gives the buyers a little more power. When there are just a few homes on the market the decision becomes binary; “should be buy it or not”. With more to choose from it’s easier for a buyer to to see 10 listings eliminate 7 from the running and then choose among the top three. Sellers need to realize that if their property isn’t competitive on price and condition it is realistic that their house won’t make the cut every time.
- Sales in August decreased by 2.8% compared to last year.
- YTD sales are up by 1.8%
- Price reductions continue to be very high.
- Inventory is at the the high point for any August since 2014.
Take a look at the slideshow below for more detail.

