
by Neil Kearney | Aug 24, 2012 | Boulder County Housing Trends, Statistics
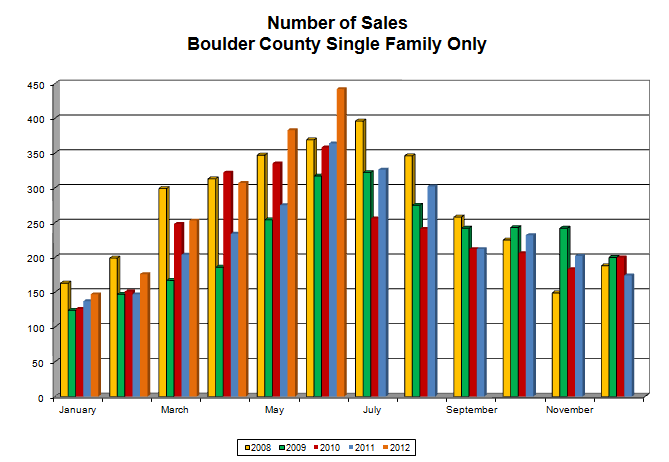
I’ve been tracking real estate sales in Boulder County for a long time. I am consistent in what data I collect and when I collect it. I love finding patterns in the numbers and then finding out why a deviation takes place. One of the most constant trends we have in the Boulder real estate market is the yearly sales cycle. Each year, sales bottom out in January and December and peak in June or July. The other months usually form a well ordered curve that resembles a bell curve. You know the one from high school algebra class. Here is a line graph showing real estate sales on a monthly basis over the past nine years.

As I was creating the graph the lines were especially uniform from 2004 to 2007. From 2008 through 2011 there were a number of outside forces that affected our local real estate market in ways that moved our curve.


Notice that the chart on the left is fairly uniform with a steady rise and fall and a peak in the summer. The chart on the right shows our market from 2008 forward (I added 2006 for comparison). It is less uniform and the curves are anything but uniform.
This year (the red line in the right hand graph) shows a return to normalcy. It is a steady line leading to a peak in June. We are still having good activity so I would expect that the curve to continue a gradual fall to the holidays. My conclusion is that unless there are significant outside forces in the market, sales in Boulder County follow a predictable curve of sales throughout the year. Sales are greatest in late spring or early summer and sales are at their low in December and January.
Note to sellers, there is still plenty of time left to sell in the 2012 market. If history holds September and October are strong markets similar to March and April.
by Neil Kearney | Aug 17, 2012 | Boulder County Housing Trends, Statistics
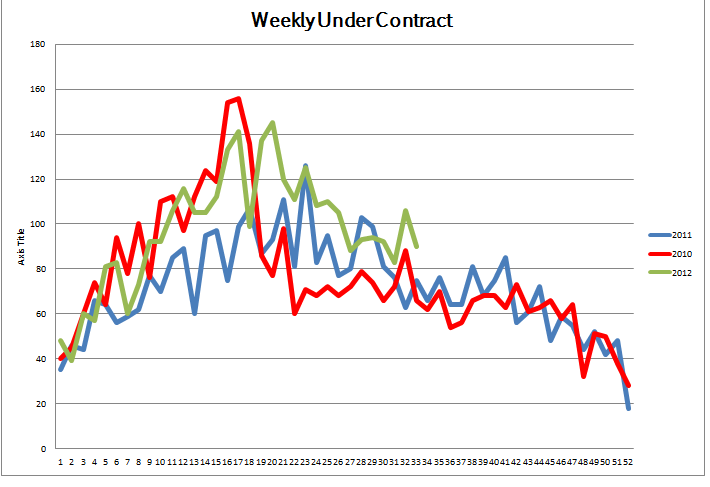
July was another good month in the local real estate market. Sales were up 27% during July compared to the same month last year. Year-to-date, total sales in Boulder County are up 25% as compared to last year. Activity is still strong in the market. The graph below shows a comparison of homes going under contract on a weekly basis over the past three years. It is clear that there has been consistently strong activity on a consistent basis throughout the year. 

by Neil Kearney | Jul 24, 2012 | Boulder County Housing Trends, Statistics
In order to get a true picture of the current state of the real estate market, you must break it down into smaller segments. Looking closely at different price ranges gives a much more comprehensive and interesting view.
Under Contract %
<$400,000 33%
$400,001 – $600,000 27%
$600,001 – $1,000,000 19%
>$1,000,000 11%
U/C % shows the current level of activity in the market. Simply put, it’s the percentage of active homes on the market at any given time which have found a buyer. Clearly, the lower the price the more market activity there is.
Current Inventory in Months: (Using the past 12 months sales rate)
<$400,000 5.6 months
$400,001 – $600,000 6.9 months
$600,001 – $1,000,000 11.4 months
>$1,000,000 21.7 months
Inventory is a gauge of how long it would take to sell all homes in a given range if the past sales rate were to continue in the future and no new homes were to come on the market. Homes below $400,000 are in a healthy range, and those above $1 million are oversupplied given the current sales rate.
Sales through June 30, 2012
2011 2012 Change
<$400,000 1289 1,517 18%
$400,001 – $600,000 355 355 34%
$600,001 – $1,000,000 192 279 45%
>$1,000,000 68 93 37%
Sales were up across the board, but there is a direct correlation between the magnitude of change and the price range. It is interesting to see that a majority of the sales in Boulder County are below $400,000.
While the majority of sales in Boulder County take place below $400,000, the most improvement in the market was seen above $400,000. During the past few years the upper end of the market has really struggled. This year we are seeing some good improvement!
by Neil Kearney | Jul 23, 2012 | Boulder County Housing Trends, Statistics
The market has been good this year. Sales are up well over 20% and there has been a good buzz going throughout the market this year. However, each year the market in Boulder County peaks and then starts to decline toward the slow holiday months. It is a consistent pattern that resembles a bell curve. Here is what the monthly sales curve has looked like over the past five years.

From what I’m seeing in the market, it appears that sales in 2012 peaked in June. If the historical pattern holds we will see a gradual decline in sales through the remainder of the year. How can I say this without July being in the books? Two reasons. The first reason is that I can tell that the market is not moving as fast. Not as many showings, not as many offers, not as many calls. The second, and most reliable is that I track contract activity on a weekly basis and this shows that we have peaked and are heading back down. We are still tracking ahead of last summer but around here the spring market is stronger than the summer market. The chart below shows the number of homes that have gone under contract on a weekly basis over the past three years.


by Neil Kearney | Jul 10, 2012 | Boulder County Housing Trends, Statistics
“Our market will recover very quickly once buyers again decide to start buying again.”
“Affordability of homes, which is a function of prices and interest rates, is at levels we haven’t seen for decades. This area is poised for recovery and when it does improve, prices will increase.”
“Cautious Optimism – As we move toward recovery the number of listings is still low. Buyers are finding it hard to find the right home and there are more multiple offer situations. The market is not yet recovered but we are heading in that direction. Confidence in the market is key and if you are looking at the local real estate market your optimism should be rising.”
These three quotes were written by me six months ago. At that time the signs were in place for a good year ahead but after 3 years of a lackluster market it was hard to blow the trumpet too hard. After the first six months of 2012 it is clear that the market has gone through a major shift. We have broken a cycle. To read more about what the market has done over the past six months view the slideshow below.
by Neil Kearney | Jun 26, 2012 | Boulder County Housing Trends, Statistics
As of today home sales in Boulder County are up 24% for the year. At the same time inventory has been consistently low. These conditions have led to multiple offers in many cases. So the logical assumption would be that the average negotiation between buyers and sellers would have become smaller. Makes sense, simple economics. However, after looking at the numbers I am surprised.
Historically, the average negotiation off of the last list price of the property in Boulder County has been just under 3%. Here is a list of the average negotiation of residential properties in Boulder County for each year since 1999.
- 1999 – 1.37%
- 2000 – 1.36%
- 2001 – 1.76%
- 2002 – 2.41%
- 2003 – 2.83%
- 2004 – 2.66%
- 2005 – 2.44%
- 2006 – 2.77%
- 2007 – 3.15%
- 2008 – 3.23%
- 2009 – 3.80%
- 2010 – 4.14%
- 2011 – 4.11%
- 2012 – 3.16%* through June 27th
What I find interesting in the figures above are the macro trends in our market. Back in 1999 our area was one of the hottest markets in the country. Our appreciation (as measured by FHFA.gov) was ranked first in the nation, we were in the midst of a sellers market and the average negotiation off of list price was just 1.37%. During 2010 the number of sales had dropped by 40% from the peak in 2005, we had a negative appreciation (-1.9%, FHFA.gov), it was a full buyers market and the average negotiation was up to 4.14%. This year the market has showed some real improvement. We are ranked in the top ten in the nation for appreciation, sales are up 24% from last year and negotiation has fallen to 3.16%.
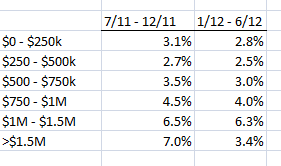
Delving more into the numbers I found that the difference in negotiation by price range is significant.
The simple table above compares the average negotiation by price range so far this year to the last six months of 2011. Overall sellers improved their negotiation range by around 1/2 %. This improvement held through most price ranges except for the luxury market over $1,500,000. In that segment 28 homes sold with an average negotiation of 3.4%. A huge improvement over the 7% that was recorded over the last six months of 2011.

