by Neil Kearney | Aug 20, 2013 | Boulder County Housing Trends, Statistics
Here is the latest copy of The Kearney Report. This quarters installment highlights data from Boulder County as a whole, the City of Boulder, the City of Longmont, East County including Erie, Louisville, Superior and Lafayette and Gunbarrel.
Commentary:
Do you remember the feeling when the music stopped and there wasn’t an unoccupied chair in sight? Of course I’m referring to the birthday party game of musical chairs. That feeling of frenzy and despair so often seen during those birthday parties of years past were again seen this spring and summer in the local real estate market. The cause was strong buyer demand and a lack of homes on the market, the effect was multiple offers, empowered home sellers and strong price increases. Let’s take a closer look at each of these factors.
The seeds of this years strong market were sown at the end of 2012. Just as the market was expected to take its usual course and wind down for the year sales in October, November exceeded closings in September and closings in December exceeded the previous year by 16%. When the calendar turned buyers were out in force and the common refrain was “when are more listings going to hit the market?”. It turned out that listings were in short supply all spring. The abundance of buyers was spurned by many factors the most important being low interest rates, strong overall confidence in their economic situation and a rental market that is characterized by rising rents and a severe shortfall in supply.
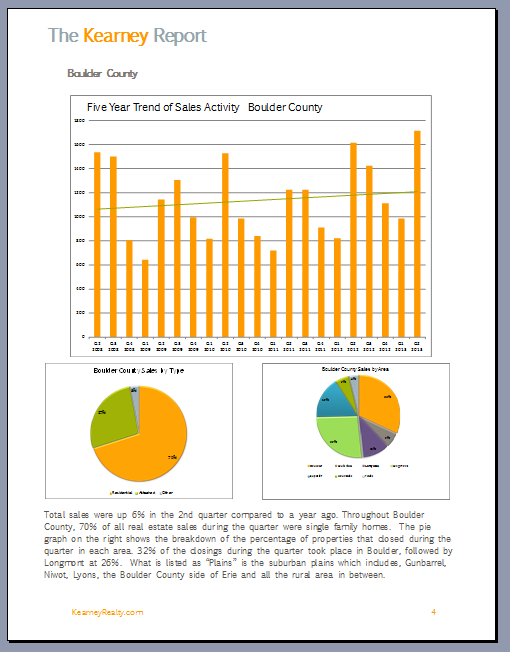
 During the housing downturn of 2008 – 2011 we were fortunate that the number active listings dropped along with the number of sales. (see graph to the right) This relative balance in the market (fewer buyers – fewer sellers) allowed for our prices to remain fairly stable just as other areas were seeing a steep devaluation. We were lucky that our area didn’t see mass layoffs or other factors that forced people to sell. A majority of households in our market decided during the soft market that they would stay rather than sell and those who didn’t need to sell because of external circumstances chose to stay. That mindset has continued and even as the market has improved over the past two years the number of listings on the market has fallen. At the end of April when the market was in full swing with buyers there were 1,442 active homes on the market in Boulder County compare this to the 2,464 that were on the market at the same time of year in 2007! To further complicate matters roughly 40% of all active listings this spring had a contract pending. The results were often frustrating for buyers looking to move in a reasonable time frame.
 The outcomes of the above two factors were multiple offers on many homes, an extreme sellers market when negotiating and a healthy jump in prices. Buyers knew that they needed to act quickly when a new listing hit the market. Most buyers agents were searching multiple times per day and serious buyers were ready to leave work at a moments notice to see the next new listing. It was not uncommon to have multiple offers on a house by the end of the first day of showings. Sellers and listing agents changed strategy by mid-spring and used tactics like delaying showings until two or three days after listing or announcing when offers would be reviewed. Very hubris but effective. The results of this frenzy was that buyers were willing to pay more than the recent comparables said they should and in a short amount of time sellers were testing the market with prices that had the neighbors shaking their head. And they were getting there price! The preliminary data show that prices have risen approximately 10% this year. In some areas the increases were more towards 15 or 20%. A definite kick start out of a relatively stagnant price environment we have seen over the past half decade.
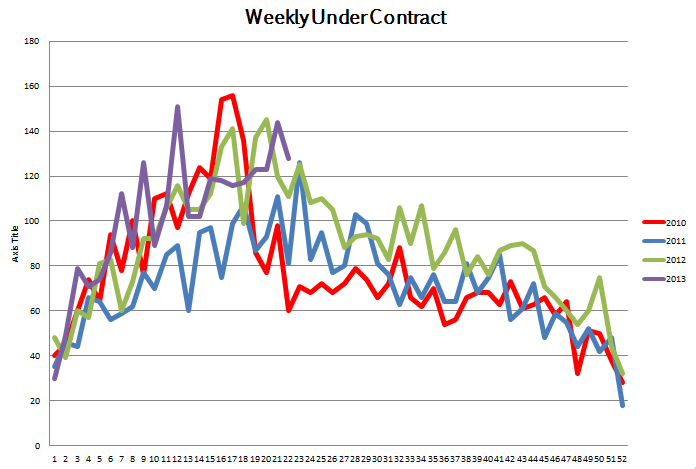
Here in mid-August it’s apparent that the market has slowed a bit. The inventory of available homes has increased a little and the under contract percentage has decreased a touch. But more telling is that there is no longer a frenzy for new listings. Interest rates have jumped nearly a point (now between 4.5 and 5%) and school is just beginning again. Sales for the year peaked in July (See 2nd graph this page) and what remains to be seen is how long and how strong this market will remain. Through July, sales are up roughly 10% from 2012 and up 38% from 2011. I would expect that we will slow a bit by the end of the year but still have more sales in 2013 than in 2012.
To view the entire 18 page report in PDF format click here.

by Neil Kearney | Jul 17, 2013 | Boulder County Housing Trends, Boulder Real Estate, Statistics
Boulder County Real Estate Statistics June 2013 from Neil Kearney
Sales in Boulder County slowed a bit in June but year-to-date sales are still up 9.4%. Prices are up and inventory is still low. Last year sales peaked in June and this year we may be following suit. Spring tends to be the busiest time of year and the number of buyers in the market usually sees a drop by the end of June.
In the slide show you will see a graph showing the number of homes that went under contract on a weekly basis over the past four years. During the week between July 4th and July 11th there was a huge drop in new accepted contracts. I wonder if this is a trend caused by an increase in interest rates or if it is a blip caused by vacation schedules?

by Neil Kearney | Jun 14, 2013 | Boulder County Housing Trends, Statistics
May was another great month. So far this year we have become accustomed to large gains when compared to the same month the previous year but this month the number of sales in Boulder County increased just 1.5%. Inventory increased by 140 units or 16% during the month which has helped take a little bit of the pressure off of buyers. 37% of the listings are currently under contract. This is a decrease of a few percentage points from last month.
View the slideshow for all of the details and year over year comparisons.
by Neil Kearney | May 30, 2013 | Boulder County Housing Trends, Statistics
The themes so far for the year in the Boulder real estate market are; low inventory and high demand. This is a great combination has lead to increases in prices and quick sales. Great for sellers, not so much for buyers.
Typically the months of April, May and June are the busiest months here for real estate transactions and this year so far is no different.
In order for the market to run efficiently you need enough listings to fill demand. So far this year we have had a definite shortage. The chart below shows the number of new listings that have come on the market in Boulder County on a weekly basis over the past four years. The purple line is this year and we have been lagging behind all year. It is interesting that when there were few buyers and low demand in 2010 there were many new listings. Maybe this has something to do with the practice of withdrawing and re-entering a listing on the MLS if it has been on the market for an extended period, hmmm.

The second chart shows the number of properties that have gone under contract on a weekly basis. It compares same week data over the past four years. You can see how the purple line (this year) has been really strong all year compared to the data over the past four years. From this chart you can see that the most activity in the market actually took place in late March. Since then the market has cooled a bit but is now gaining strength again as summer begins. We usually see a fall off in market activity sometime in June.

by Neil Kearney | Apr 19, 2013 | Boulder County Housing Trends, Statistics, Uncategorized
I’ve just finished The Kearney Report which summarizes the local real estate market in a colorful mostly graphical format. It is 17 pages of great statistical information for Boulder County real estate including breakout sections for Boulder, Gunbarrel, Longmont, and East County (Superior, Louisville, Lafayette, and Erie). To view the entire report click here.
Here are a few excerpts from the summary:
The local real estate market showed surprising strength through the holidays and soon after the calendar turned, buyers were out in force. Buyers currently have many reasons to purchase real estate. Some of the most compelling at the moment are; low interest rates, economic recovery, recognition that prices have bottomed out and are heading up, and increased buyer confidence (based upon the three previous reasons). These causes have had one effect on the local housing market, super high demand. Through the first quarter, sales in Boulder County are up 16% from a year ago and up 33% from the first quarter in 2011. The market is humming along!
It’s too soon to know how much prices have risen but so far this spring I have seen quite a few homes with prices that I thought were way too high go under contract very quickly. According to the latest FHFA.gov price appreciation report, prices in Boulder County had risen 2.08% for the year ending December 31, 2012. Anecdotally, I have seen some homes in some areas sell at levels approximately 15% higher than they would have been a year ago. We’ll see where the averages fall but it is definitely a sellers market.
Multiple offers are very common on homes that are in good condition and are asking a fair price. There is an urgency to make decisions and if a house lasts more than a week or two on the market it is most likely overpriced. A typical scenario right now is where a seller lists their home at a price level that is pushing the market (just to see if anyone will bite). They get 15-20 showings during the first week and then when no offers come in they start chasing the market with price reductions.