
I’m revising my Boulder Neighborhood Guide and thought it would be helpful to show not only where sales are taking place but at what price. I found a way to manipulate the sales data for the City of Boulder and show it on a map and label it by price range. It’s called a heat map.
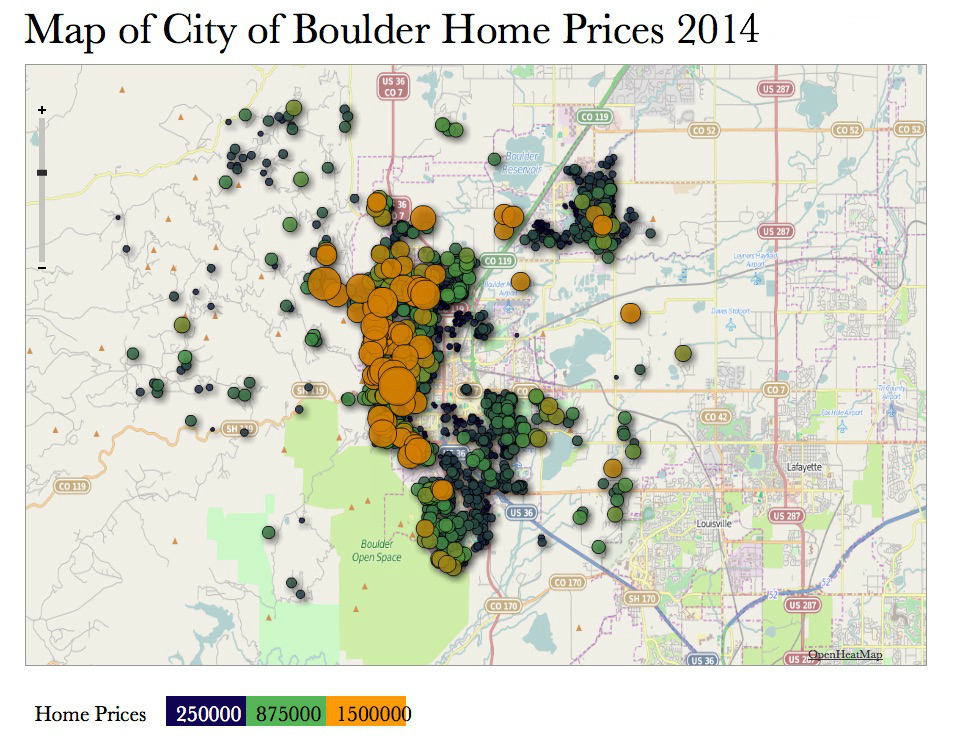
The first one shows all of the sales of houses and condos in and around Boulder in 2014. It’s a little busy, but you can generally see that there are more large orange circles on the west side of town. Orange circles represent the highest 1/3 of prices. Medium green circles represent the middle third and small blue circles stand for each sale in the lowest third of the price array. When there are a bunch of sales in close proximity the sales are bunched together and the circle becomes larger. You can see some normal sized circles on the east side of the map. So far in 2014, the City of Boulder and the close surrounding area has had 1,698 sales with a median price of $475,000. To see a larger view of each map, just click on the picture.
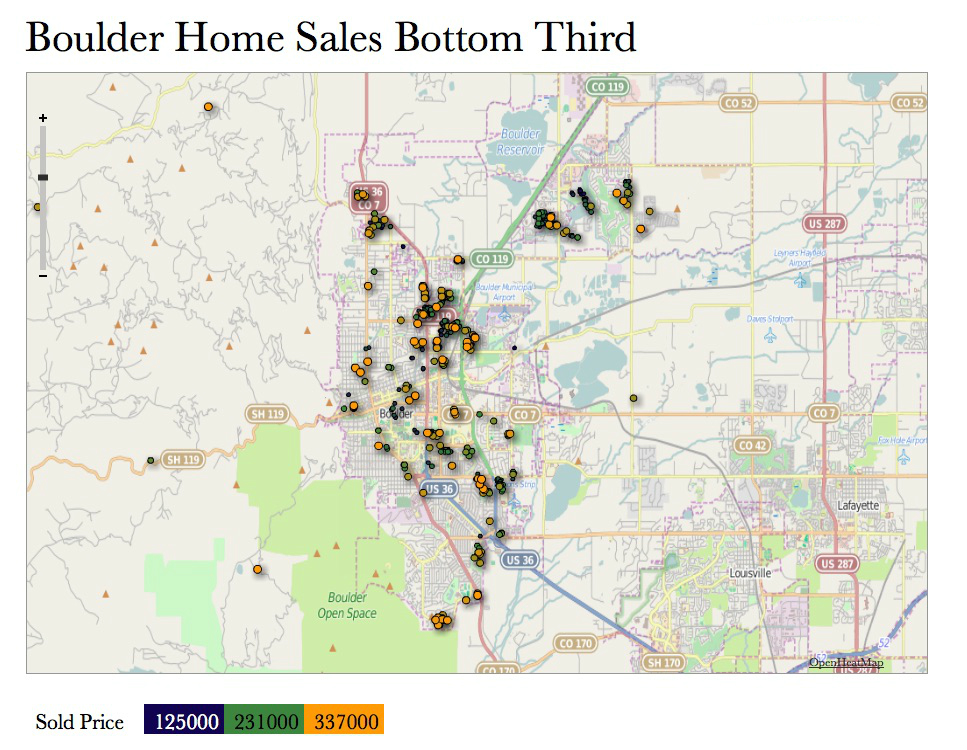
 In order to see what is happening a bit clearer I’ve split the data into thirds. The first map below shows the sales in the Boulder area up to $350,000. This is the bottom one third of the market. Within this market segment the blue dots are the least expensive, the green dots are the middle segment and the orange dots are the most expensive segment. You can see that most of the sales are centered around 28th Street which is the main north south artery in town.
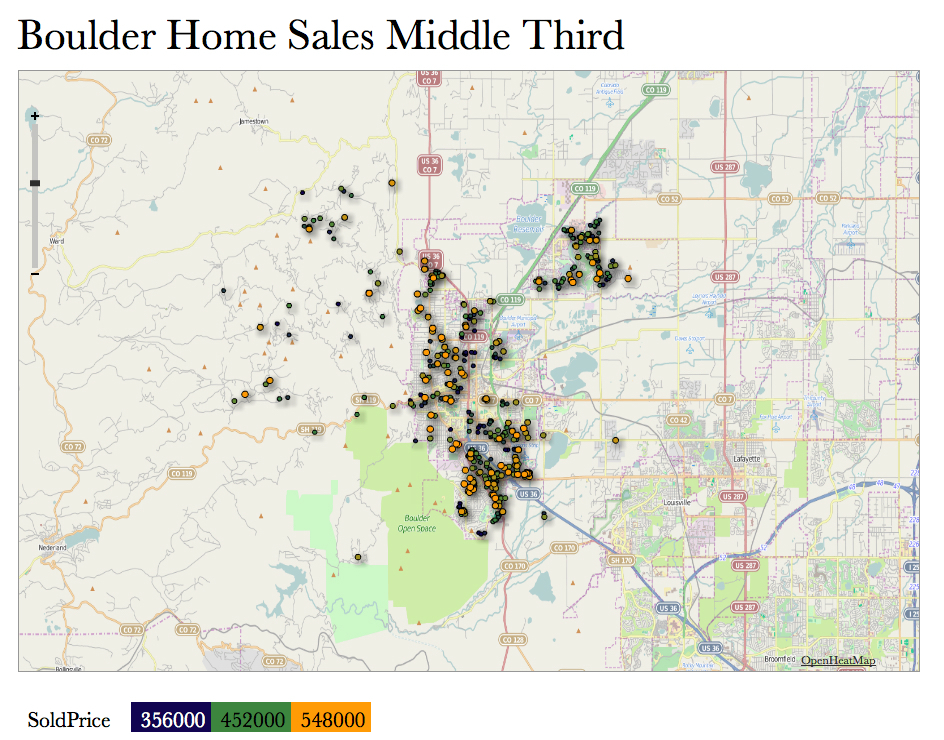
The middle price range in Boulder during 2014 are those properties selling between $350,000 and $560,000. In this price range there are quite a few more sales west of 28th Street, more in South Boulder (Table Mesa, Martin Acres) and more sales in Gunbarrel.
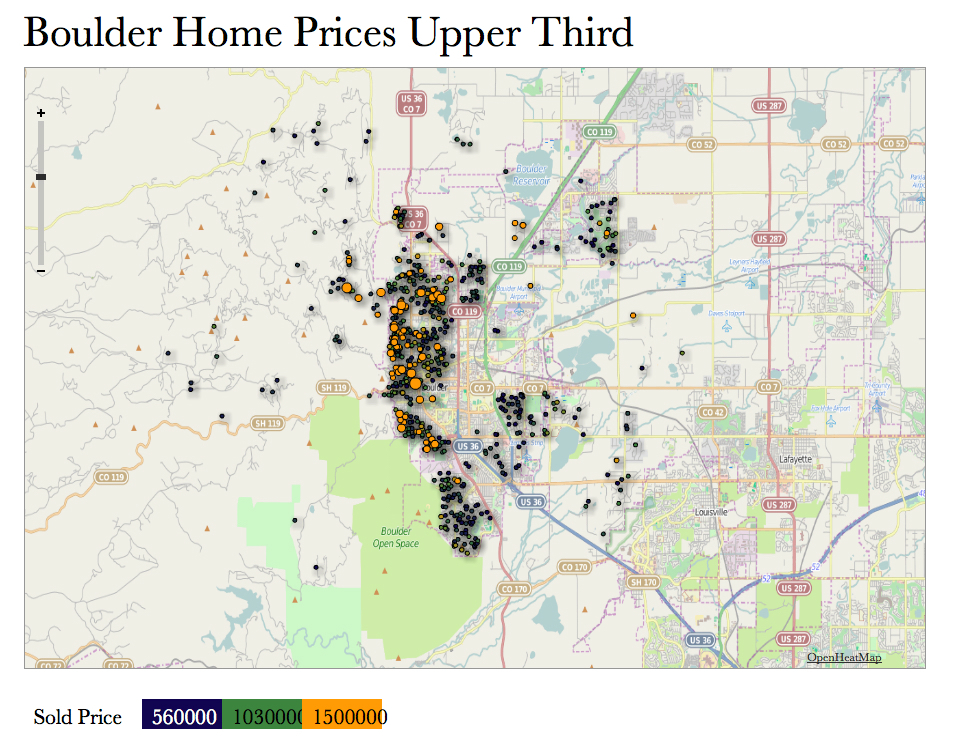
The last map represents the upper third of the price range; between $560,000 and $5,300,000. The map shows that most of the sales in the upper price range take place west of Broadway.
The heat maps were created at OpenHeatMap.com with data supplied from IRES MLS.

