by Neil Kearney | Jun 9, 2015 | Boulder County Housing Trends, For Buyers, For Sellers, Statistics |

Hold on and get up to speed!
Hold on and get up to speed! Homebuyer’s in Boulder County are getting a crash course in rejection. The local real estate market is still running on all cylinders and seems to have a full tank of gas. In April and May there were 789 real estate transactions that closed in Boulder County. 270 closed at less than full price, 98 closed at full price and a staggering 421 closed above full price! Two-thirds of the sales in our market during the past two months closed for full price or more. The average transaction closed for 1.2% above list price. I haven’t seen anything like it during the past twenty-five years.
Looking more closely at the homes that sold above full price is an interesting analysis. One that could come in handy if you find yourself in a situation where you are competing with multiple offers. The big question is how high do I need to offer? Of course every situation is different but here is the recent data.
Sales in Boulder County closing in April and May of 2015 that sold for above asking price:
Price Range – $0 – $250k Number of sales = 93 average premium paid = 5.5%
Price Range – $250K – $500k Number of sales = 212 average premium paid = 4.5%
Price Range – $500k – $750k Number of sales = 74 average premium paid = 5.1%
Price Range – $750k – $1 Mil. Number of sales = 23 average premium paid = 4.9%
Price Range – > $1 Mil. Number of sales = 19 average premium paid = 5.0%
Overall if a buyer paid above asking price (presumably a majority of these were in a multiple offer situation) the average they paid was 4.9% above the list.
Here are some other statistics from the data set that could be very helpful.
City of Boulder
- 353 total sales
- The average sale closed for 1.4% above full price
- 157 properties sold for a price exceeding full price.
- The average premium paid in Boulder for those houses that sold above list was 5.9%.
- The lower end of the market is stronger than the upper end.
- The average home in Boulder that sold at $500,000 or below sold for 3.2% above list price. The average premium paid for those that closed above asking was 6.4%.
- The average home in Boulder that sold above $500,000 sold for .2% above list price. The average premium paid for those that closed above asking was 5.5%. There was much more negotiation below asking price in this price range on those that didn’t sell for full price or a premium.
Other Areas
- Louisville
- Just 43 sales over the past two months. Average sales price was .6% above list price.
- 18 properties sold above asking price. The average premium paid was 4.4%.
- Lafayette
- 76 sales over the past two months. Average sales price was 2.2% above list price.
- 45 properties sold for above asking price. The average premium paid was 5.1%
- Longmont
- 292 sales over the past two months. Average sales price was 1.5% above list price.
- 150 properties sold for above asking price. The average premium paid was 4.3%.
- Erie
- 42 sales over the past two months. Average sales price was 1.1% above list price.
- 21 properties sold for above asking price. The average premium paid was 3.8%.
- Superior
- 28 sales over the past two months. Average sales price was 1.2% above list price.
- 16 properties sold for above asking price. The average premium paid was 3.5%.
- Other areas including Nederland,Niwot, Lyons
- 56 sales over the past two months. Average sales price was 2.9% below list price.
- 12 properties sold for above asking price. The average premium paid was 2.3%.
Here are my takeaways from this information.
Over half of the homes that sell are selling for above list price. If you find yourself interested in a house that has multiple offers the average amount that you should expect to pay is around 5%. The median is actually around 4%. So if you had bid 4% over on a home that had multiple bids you would have been successful half of the time over the past two months. Over the past 10 years the average negotiation on all sales has been 2.8% below list price. This is the first time I can remember that the average sale has gone above list price.

by Neil Kearney | May 27, 2015 | Boulder County Housing Trends, Statistics
FHFA.gov recently released their first quarter home price index and Colorado home appreciation topped the list for the year ending March 31, 2015. Each quarter FHFA, the federal agency in charge of housing publishes a report that compares the home appreciation in each state as well as the largest 275 metropolitan areas. For the one year period ending March 31st homes in Colorado had appreciated on average 11.16%.
Within Colorado they track the six largest metropolitan areas. Here are their statistics from the recent report:
Name 1 year appreciation 1st Qtr. 2015 5 year appreciation
Boulder 7.52% .45% 20.75%
Colorado Springs 6.01% 2.06% 6.67%
Denver 10.16% 1.45% 27.07%
Fort Collins 9.04% 1.41% 22.31%
Grand Junction 4.93% 1.9% -6.46%
Pueblo 4.84% .51% 2.89%
The top twenty metropolitan areas for appreciation over the past year have been:
- Naples, Florida – 20.06%
- Port St. Lucie, Florida – 13.23%
- Reno, Nevada 12.30%
- Palm Bay, Florida 11.78%
- Daytona Beach, Florida 11.29%
- Miami, Florida 11.28%
- Fort Myers, Florida 10.73%
- Flint, Michigan 10.66%
- Punta Gorda, Florida 10.6%
- San Francisco, California 10.57%
- Houston, Texas 10.43%
- Anacortes, Washington 10.41%
- West Palm Beach, Florida 10.3%
- Denver, Colorado 10.16%
- Salinas, California 10.11%
- Las Vegas, Nevada 10%
- Austin, Texas 9.84%
- Vallejo, California 9.54%
- Gainesville, Georgia 9.53%
- Santa Cruz, California 9.48%
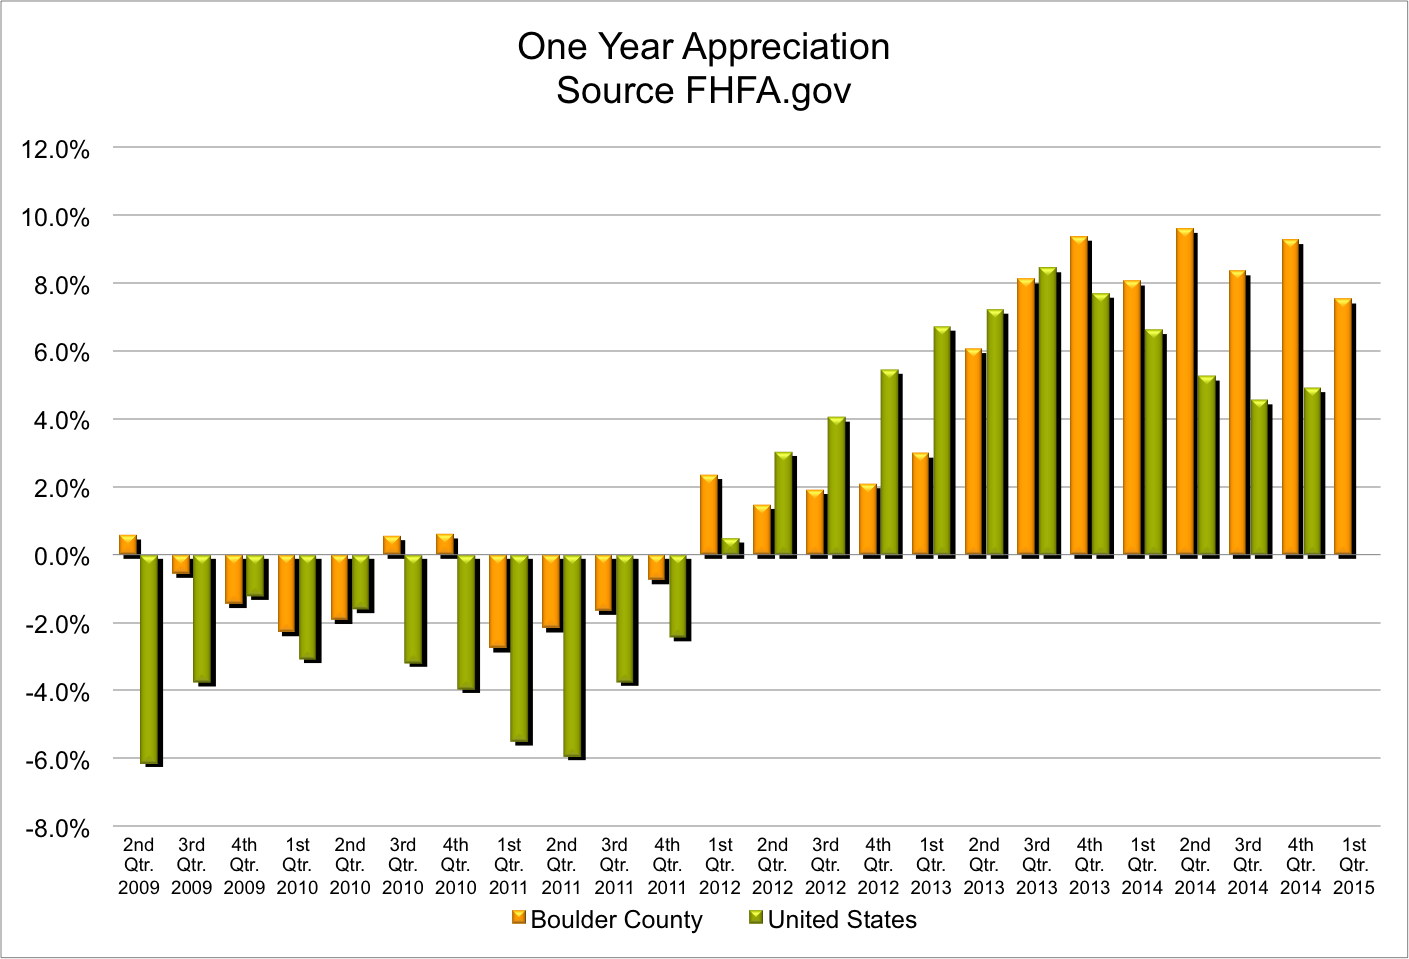
Here is a graph comparing Boulder’s appreciation to that of the United States. Over the past five years homes have appreciated on average by 14.23% in the United States and in Boulder they have gone up by 20.75%.
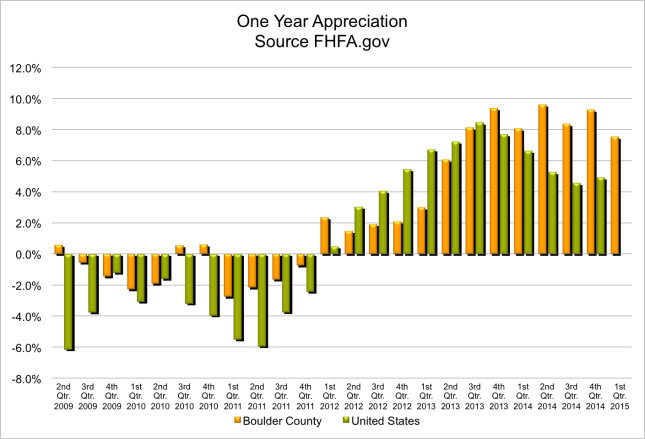
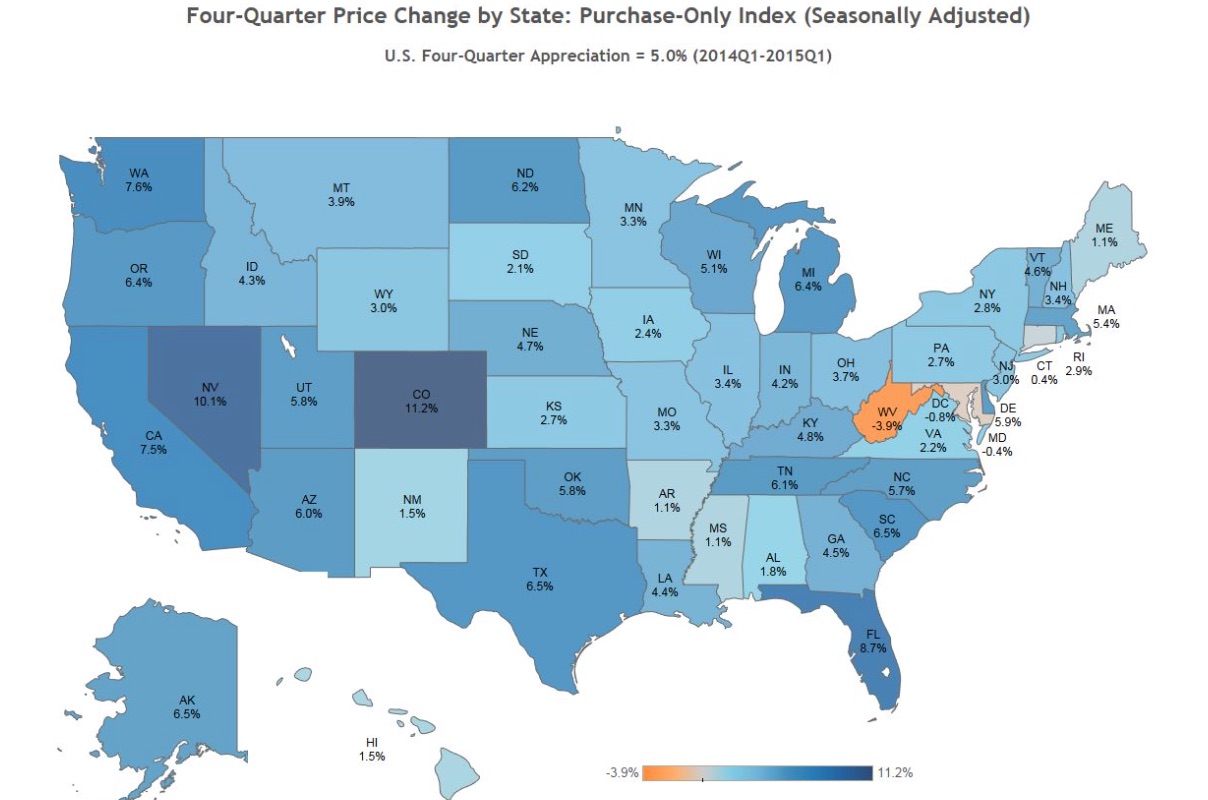
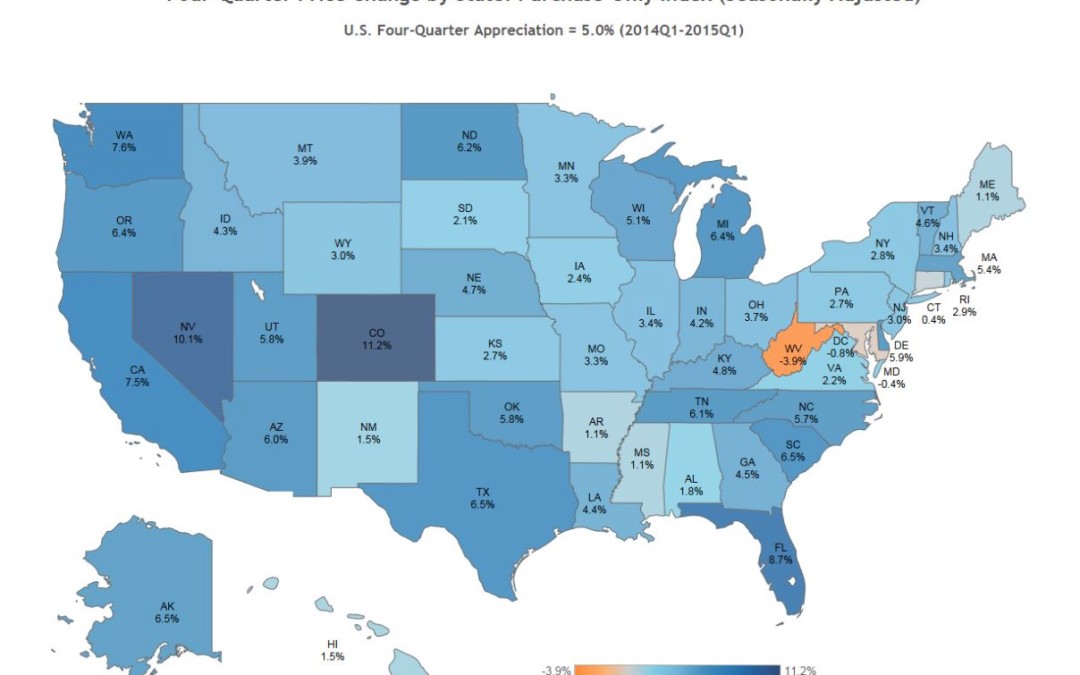
Below is a map showing the one year home appreciation for each state. The map says it’s seasonally adjusted. Either the adjustment is fairly large or the areas outside of the main metropolitan areas (for example the ranches and mountain resorts) must have had very high appreciation to bring up the average of the state to above Denver’s one year average.
 To me the numbers for Boulder seem low. It will be interesting to see how they measure the second quarter for us since we are seeing a noticeable jump in prices this spring.

by Neil Kearney | Apr 7, 2015 | Boulder County Housing Trends, Statistics
The real estate market in Boulder County continues to be red hot. Despite a serious decrease in the number of homes on the market sales soared during the first quarter. Compared to a year ago sales of single family homes and residential condos and townhomes were up 38.5% during the month of March and up 24% for the first quarter.
Inventory of homes for sale rose a bit but is still well below the average for this time of year. The total number of active listings on the MLS in Boulder County at the end of March was down 27% from a year ago. More to the point, the number of available listings (not under contract) was down 56% from a year ago. At the end of March there were just 498 homes that were available to purchase. A statistic that shows this relationship is the under contract %. At the end of March nearly 60% of the listed homes were already under contract waiting to close.
Check out the slideshow to see these and other statistics shows graphically.

by Neil Kearney | Mar 17, 2015 | Boulder County Housing Trends, For Buyers, For Sellers
 The Boulder real estate market is currently characterized by low inventory and good buyer demand. It’s a sellers market. Many home buyers are finding that the houses that they are interested in buying are also coveted by other buyers. This leads to a multiple offer situation. A great situation to be in – if you are a seller. But for a buyer it’s a difficult situation. To see some perspectives on multiple offers from both sides, read this article.
In our area, multiple offers are most often handled in this way- the listing agent receives an offer and then lets all other agents who are showing or have showed the house know that they will be presenting the offer at a certain time and day. If another offer does come in, the first offering party is advised of the second offer and is offered the opportunity to revise their offer. For the buyer, the information available is usually only limited to the number of offers that will be looked at and when to expect an answer. This year many homes are being listed knowing that there will be much initial interest. They state clearly in the MLS listing that showings start on Saturday and all offers will be reviewed on Monday. Being the first to show the house or the first to submit an offer doesn’t seem to have any advantage.
This information gap leads to much buyer anxiety. How much should we offer? What are the other offers? Are we crazy to offer $X? Will there be another better house coming down the line that is less hassle and not priced so high? Will it appraise if we go over full price? It goes on and on and each of these questions are rhetorical.
Since I can’t answer these questions for my clients with any clarity. I rely on experience to advise them the best I can and ultimately I leave it up to them to pick a number. Sometimes we use an escalation clause to calm the anxiety a bit and to hedge an overpriced offer. In the end it’s an inexact science and the results favor the bold.
So far this year (through March 16th) there have been approximately 728 sales in Boulder County. In 27% of these transactions the buyer paid more than the listing price for the property. I can only assume that most of these 198 transactions had multiple offers. So in an effort to bring some data to the unanswerable, here are the statistics from those multiple offer situations.
- The average successful offer over all price ranges exceeded the listing price by 3.4%.
- The highest percentage paid over the list price was 44%. It was a foreclosure that was priced “well” below the current market value.
- The average price paid over list in transactions under $250,000 (39% of all transactions) was 4.42%.
- The average price paid over list in transactions between $250,000 and $500,000 (44% of all transactions) was 2.79%.
- The average price paid over list in transactions over $500,000 (17% of all transactions) was 4%.
- In 37 of the 198 transactions the buyer paid $2,000 or less over list price.
- The average premium paid across all price ranges was $13,010.
- The median premium over list price was $6,600.
- In the City of Boulder the average premium paid for those properties that sold above list price was 4.52%.
by Neil Kearney | Mar 13, 2015 | Boulder County Housing Trends, Statistics
The home market in Boulder County is red hot. Buyers are swarming new listings and competing in multiple offer situations across the county. Being a seller of real estate is a great place to be but on the other hand being a buyer is a tough situation. Decisions need to be made quickly, and competition is fierce.
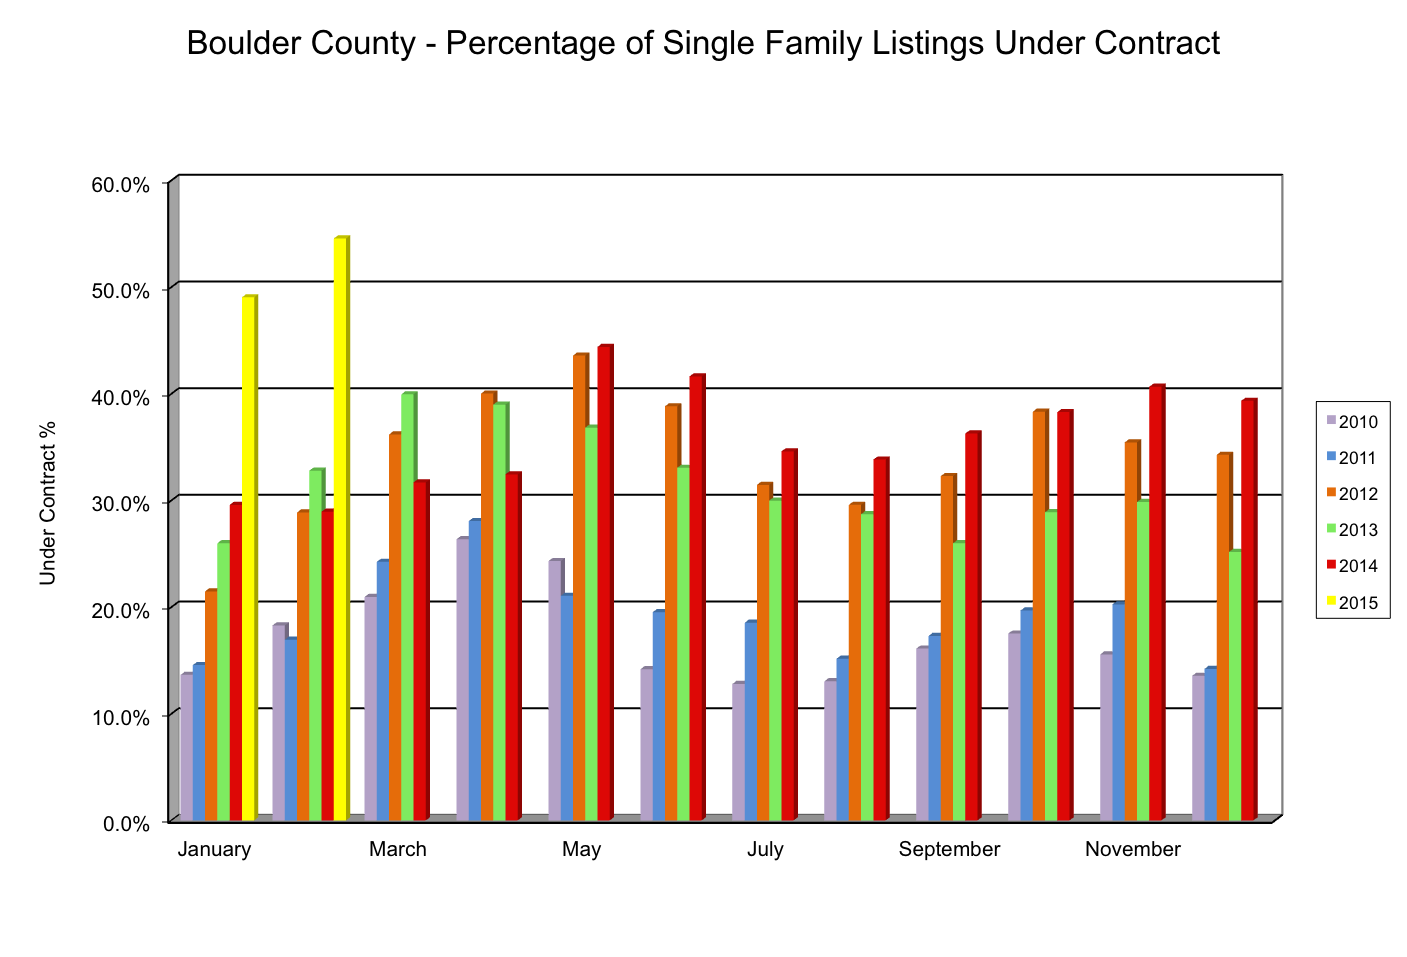
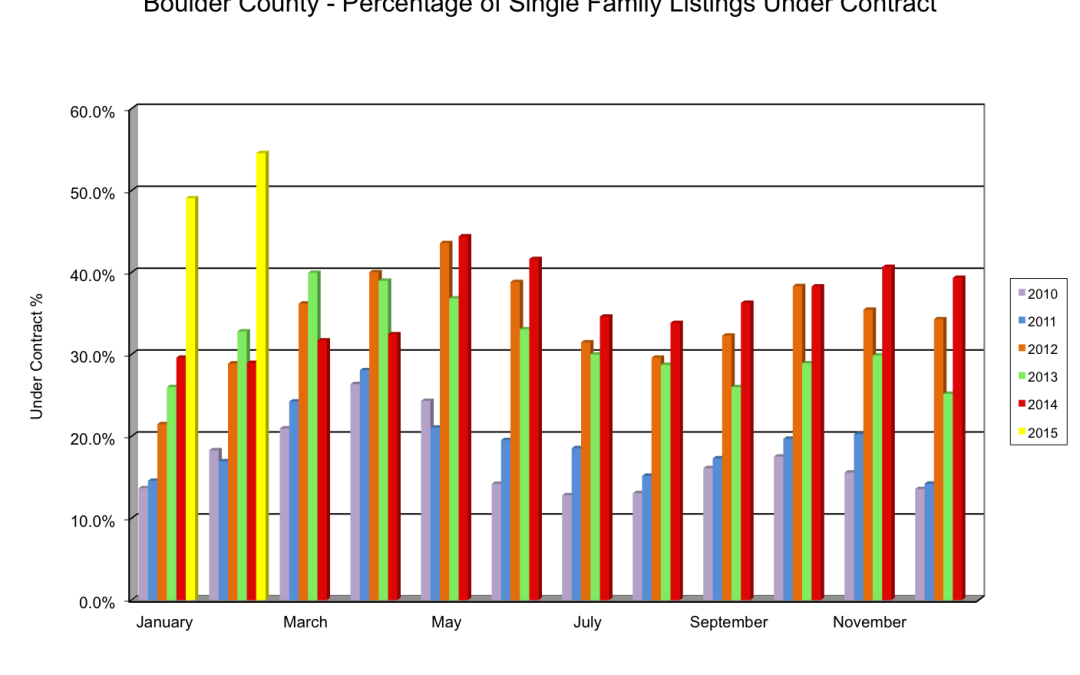
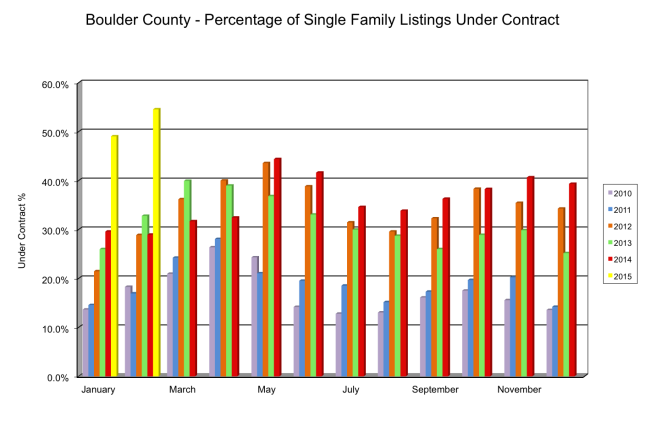
Through February sales of residential homes and condos in Boulder County are up 15% from last year. In February sales were up 21%. However, homes are going on the market at the same pace as last year. This is causing a spike in the percentage of homes that are under contract. Buyers who are out looking are finding that over half of the homes that are showing as active on most websites are already under contract.
Here is a chart showing the under contract percentage by month over the past five years.
View the slideshow below to view all of statistics for the month and the real estate trends over time.
Theses overriding themes persist: low inventory, high buyer demand, rising prices.