
by Neil Kearney | Nov 19, 2015 | Boulder County Housing Trends, Statistics
The real estate market in Boulder County remained strong in October. During the month, sales were up 6.5% from a year ago and up 40% from 2010. For the year so far sales are up 7% from a year ago and up 29% from 2011 which was the trough over the past ten years. We are back up to sales levels similar to 2007.
The inventory continues to be very low. At the end of October there were 1,063 active and pending homes on the market. This is half of what was available at the same time in 2007. There are currently 620 single family homes on the market in Boulder County that don’t already have a contract. Back in 2007 there were 1,919 at the end of October. Slim pickings! Enjoy the slideshow below which shows the trends in sales, inventory and pending contracts over the last five years.

by Neil Kearney | Oct 12, 2015 | Boulder County Housing Trends, Statistics
Residential real estate sales were up 9% during September and are up 8% for the year-to-date. Activity in the market continues to be very strong. At the end of September 44% of active listings were already under contract. Inventory of available homes is still very...

by Neil Kearney | Sep 16, 2015 | Boulder County Housing Trends, Statistics |
The real estate market in Boulder County is still especially strong. We are still seeing multiple offers and offers above list price. Sales year-to-date are up 7.4% from last year and sales in August were up over 13% from last year. Prices are up approximately 10% from a year ago. The slide deck below shows broader trends over the past five years.

by Neil Kearney | Jul 15, 2015 | Boulder County Housing Trends, Statistics
June was a strong month in the Boulder area real estate market. Sales were up 14% from May and up 2.2% from last June. Total sales of residential homes and condos are up 7% so far this year.
Inventory is creeping up slowly but it is still well below normal. The number of buyers in the market has decreased (no hard numbers here just anecdotal evidence from personal experience with showings and the number of offers) but there are still very few houses out there to look at.
Please flip through the slideshow below to get a better feel of the market.
by Neil Kearney | Jun 15, 2015 | Boulder County Housing Trends, Statistics
May was a busy month in Boulder real estate. Here are the Boulder County real estate statistics for the month ending May 31, 2015.
- Sales are up 9% year-to-date.
- Sales in May were up just .7% compared to the same month last year.
- The number of listings on the market is down 20% from a year ago.
- 56% of the listings were under contract at the end of May.
The attached annotated slideshow shows this month compared to each and every month over the past five years. It shows trends for sales, inventory and under contract percentage on a monthly and weekly basis.
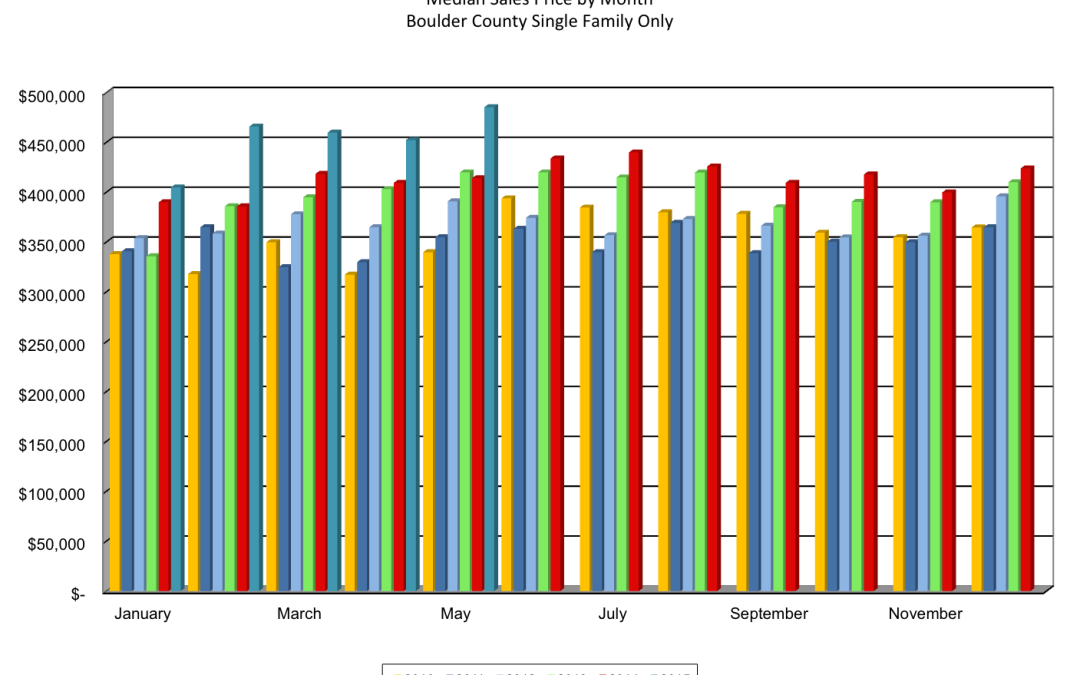
Prices are definitely up. The graph below shows the median price for single family homes in Boulder county over the past five years. You can definitely see a big jump over the past five months.


