by Neil Kearney | Jun 7, 2016 | Boulder County Housing Trends, Statistics
Boulder Real Estate Statistics for May 2016
This is the busy time of year. Buyers are out looking, home sellers who have been prepping their homes all spring are putting them on the market. There is a lot of activity! However, the trends I have been watching over the past few years are continuing; low inventory of available homes and high buyer demand – which are resulting in higher prices and fewer sales.
Here are a few highlights from the slideshow/report below.
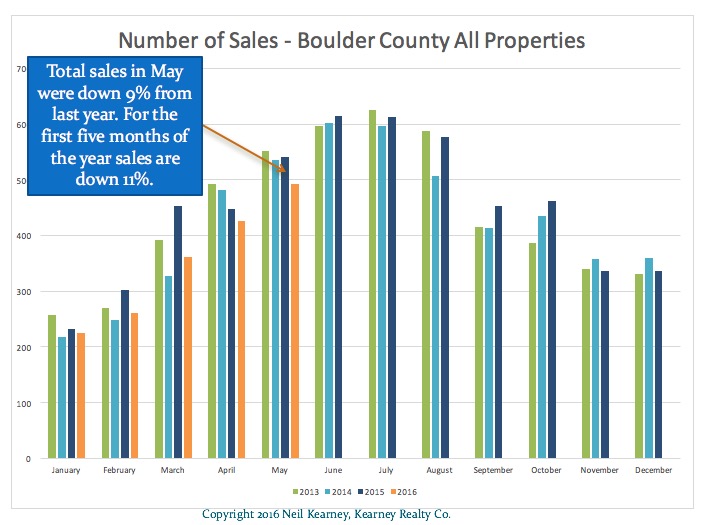
- Through the end of May sales are down 11% for the year.
- Inventory is down 45% when compared to two years ago.
- 53% of the homes available on the market at the end of May were already under contract.

by Neil Kearney | Apr 29, 2016 | Boulder County Housing Trends, Statistics
The Kearney Report is produced and presented each quarter so that our clients can have an easy to read report on the state of the Boulder area real estate market. The report gives information and shows graphs for Boulder County, the City of Boulder, East County which includes Louisville, Lafayette, Erie and Superior, and Longmont. I break it out in this manner because each of the sub-markets is different. For example, this past quarter the median price in the City of Boulder was 22% higher than last year but in Longmont it was just 1.5% higher. But at the same time the number of sales was down 18% but stayed equal in Longmont. It’s worthwhile to take a closer look!
To view a PDF of the latest report click on this link. The Kearney Report 1st quarter 2016
Here are some highlights from the report:

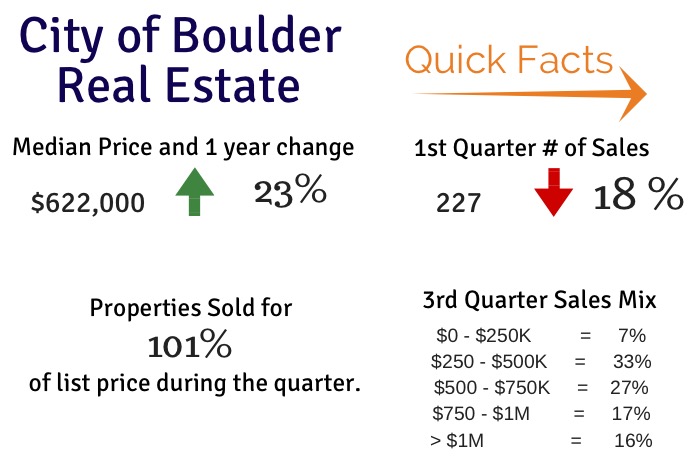
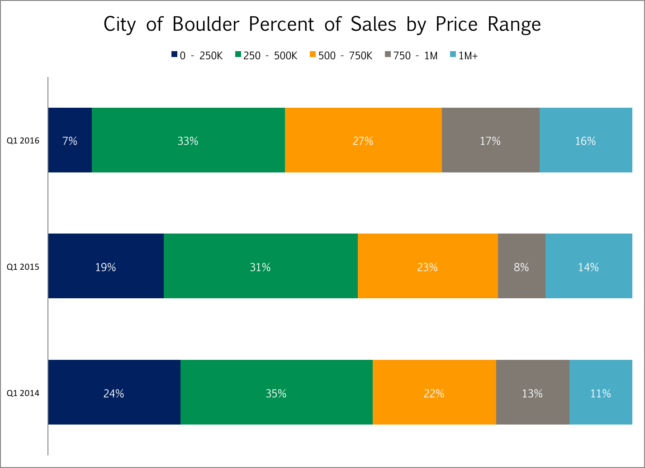
During the first quarter the real estate market within the City of Boulder has been very tight. Sales were down 18%, inventory has dropped significantly and prices are up significantly. The entry level prices in Boulder are disappearing. This past quarter just 7% of the sales were for $250,000 or under. This represents smaller, older, more modest condos in Boulder. One year ago 19% of sales were in that range and in 2014 it was 24%. Many people are being quickly and dramatically priced out of Boulder. Over the past three years the percentage of sales under $500,000 has dropped 19 % points and those sales have shifted almost equally into the high price ranges or $500 – $750k, $750 – $1 Million and over $1 million. 16% of the sales during the first quarter in Boulder sold for $1 million or more. Within Boulder 45% of properties sold for over full price. The average premium paid was 6.28% or more than $27,000 over list price!

by Neil Kearney | Apr 27, 2016 | Boulder County Housing Trends, Statistics
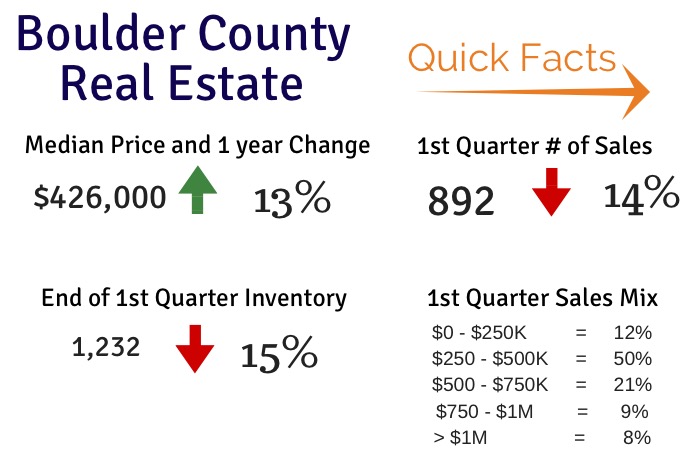
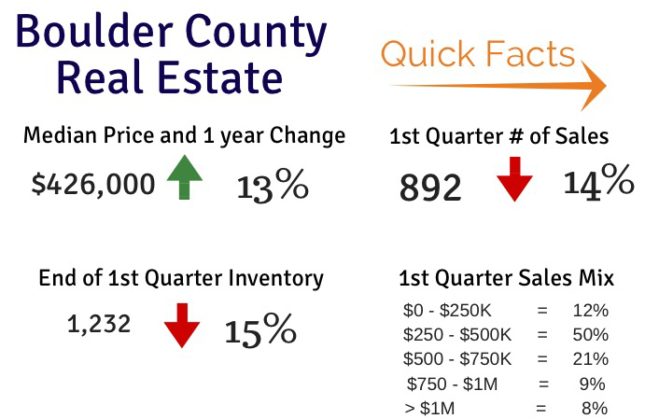
Boulder County has one of the hottest real estate markets in the entire country. There continues to be three major factors operating in the Boulder County real estate market; low inventory, strong buyer demand and rapidly rising prices. Interestingly, despite the high buyer demand, sales actually decreased over 14% for the quarter. The only cause that seems to have a direct correlation is the lack of inventory of active listings. At the end of the quarter the available inventory of residential properties for sale throughout the county was down 15%.
It’s competitive out there! During the first quarter, 42% of the properties that sold through our regional MLS system sold for a price above the asking price. Presumably most of these sales were multiple offer situations. The average premium paid above list was $21,865 or an average of 5.33% above list. Another 20% of sales sold for exactly list price.
Because of low inventory and high demand the prices are rapidly increasing. At the end of the 4th quarter of 2015 Boulder County ranked 7th in the nation for home appreciation with over 13% for the proceeding 12 months. The trend has not slowed one bit during the first quarter. Prices at the end of the 1st quarter were up over 13% from a year ago. In the City of Boulder the change was even more pronounced, up 22% from the year-ago quarter. That is a spot number, not an average over four quarters but even still, the appreciation is astounding. Below are some quick facts about the Boulder County real estate market for the most recent quarter.
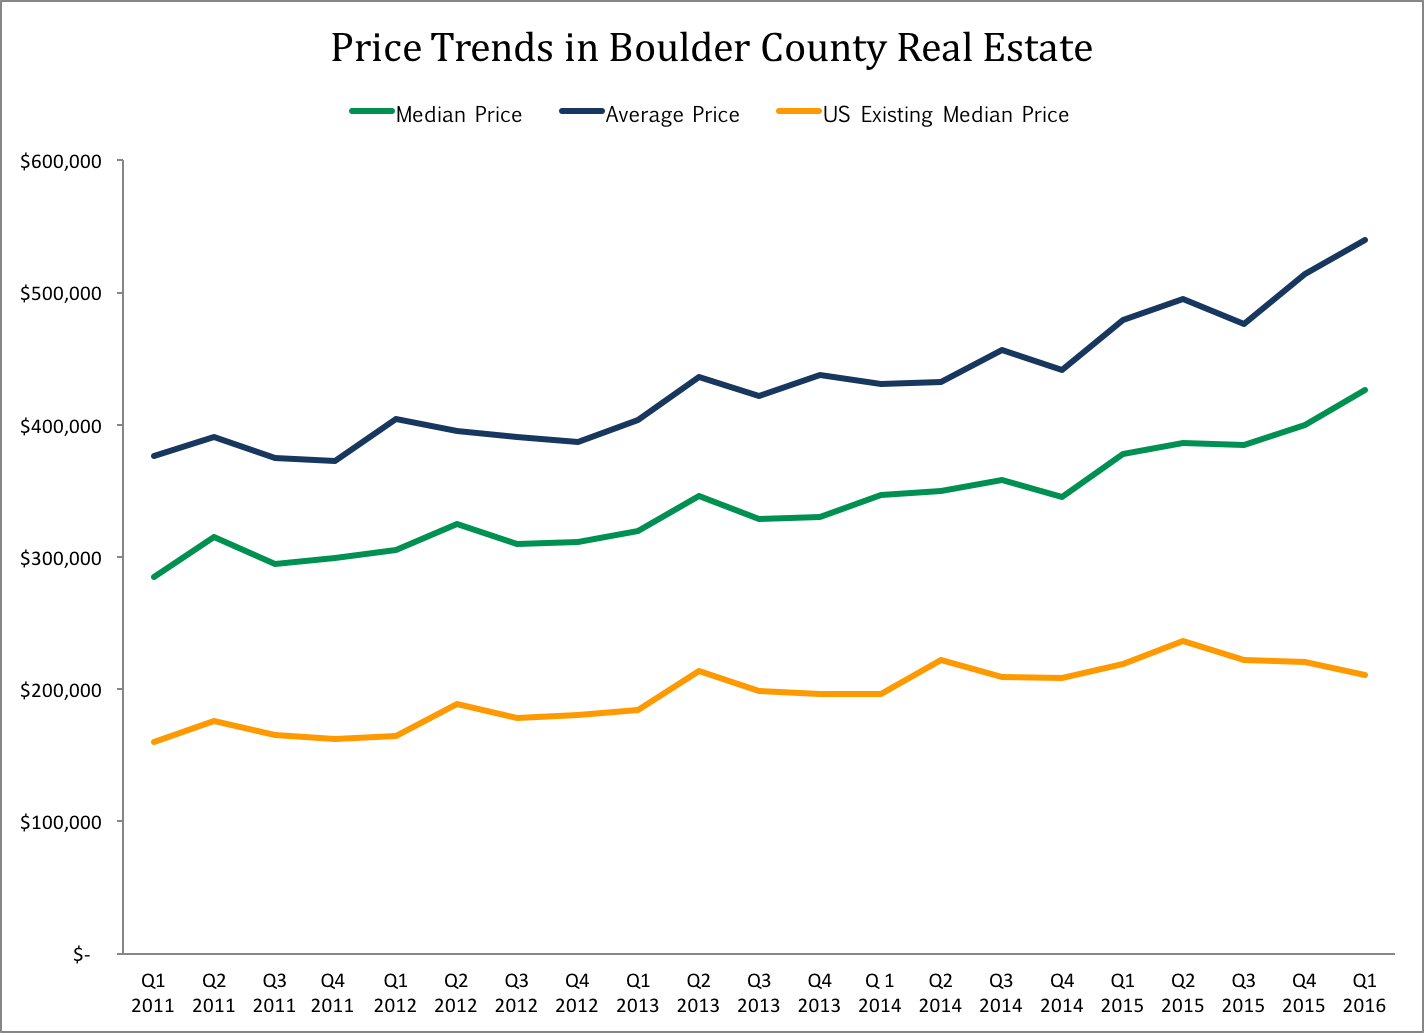
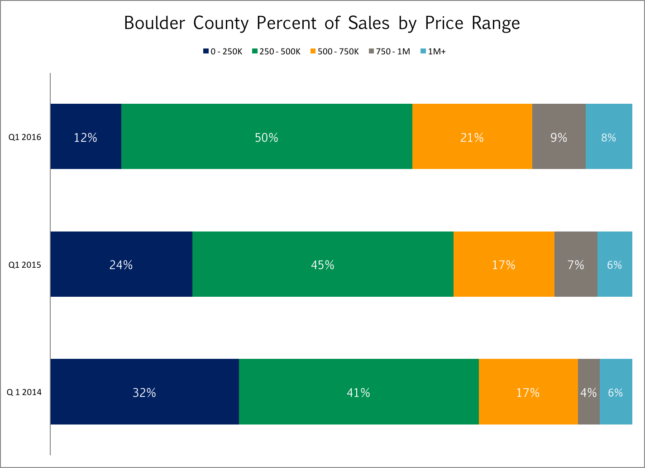
 The chart above shows prices in Boulder County over the past five years (average price =blue line, median price = green line) compared to the United Sates average (orange line). The chart below shows the percentage of sales in each price range. The comparison shows data from the first quarter over the past three years. There has been a definite shift to the right as prices have risen throughout the county. Two years ago 32% of the sales were $250,000 or below, this past quarter it was 12%.

by Neil Kearney | Apr 19, 2016 | Boulder County Housing Trends, Statistics
The major themes for the real estate market in Boulder County have been constant over the past three years; low inventory, high buyer demand and rising prices. During the first quarter and the month of March in particular these themes were exasperated. There are many buyers out there and the percentage of active homes that are already under contract is still over 50%. So why were sales down 20% in March and down 14% year-to-date? Low inventory. There just are not enough houses out there on the market to satisfy the demand in the market. So when a house does come on the market it gets multiple offers. For the quarter homes sold for 99.35% of the list price throughout the county but houses sold for above list price in Boulder, Louisville, Lafayette, Erie and Gunbarrel. It’s a good time to be a seller!
To see all of the real estate statistics for Boulder County, check out the slideshow below.
by Neil Kearney | Mar 30, 2016 | Boulder County Housing Trends, Boulder Real Estate, Statistics
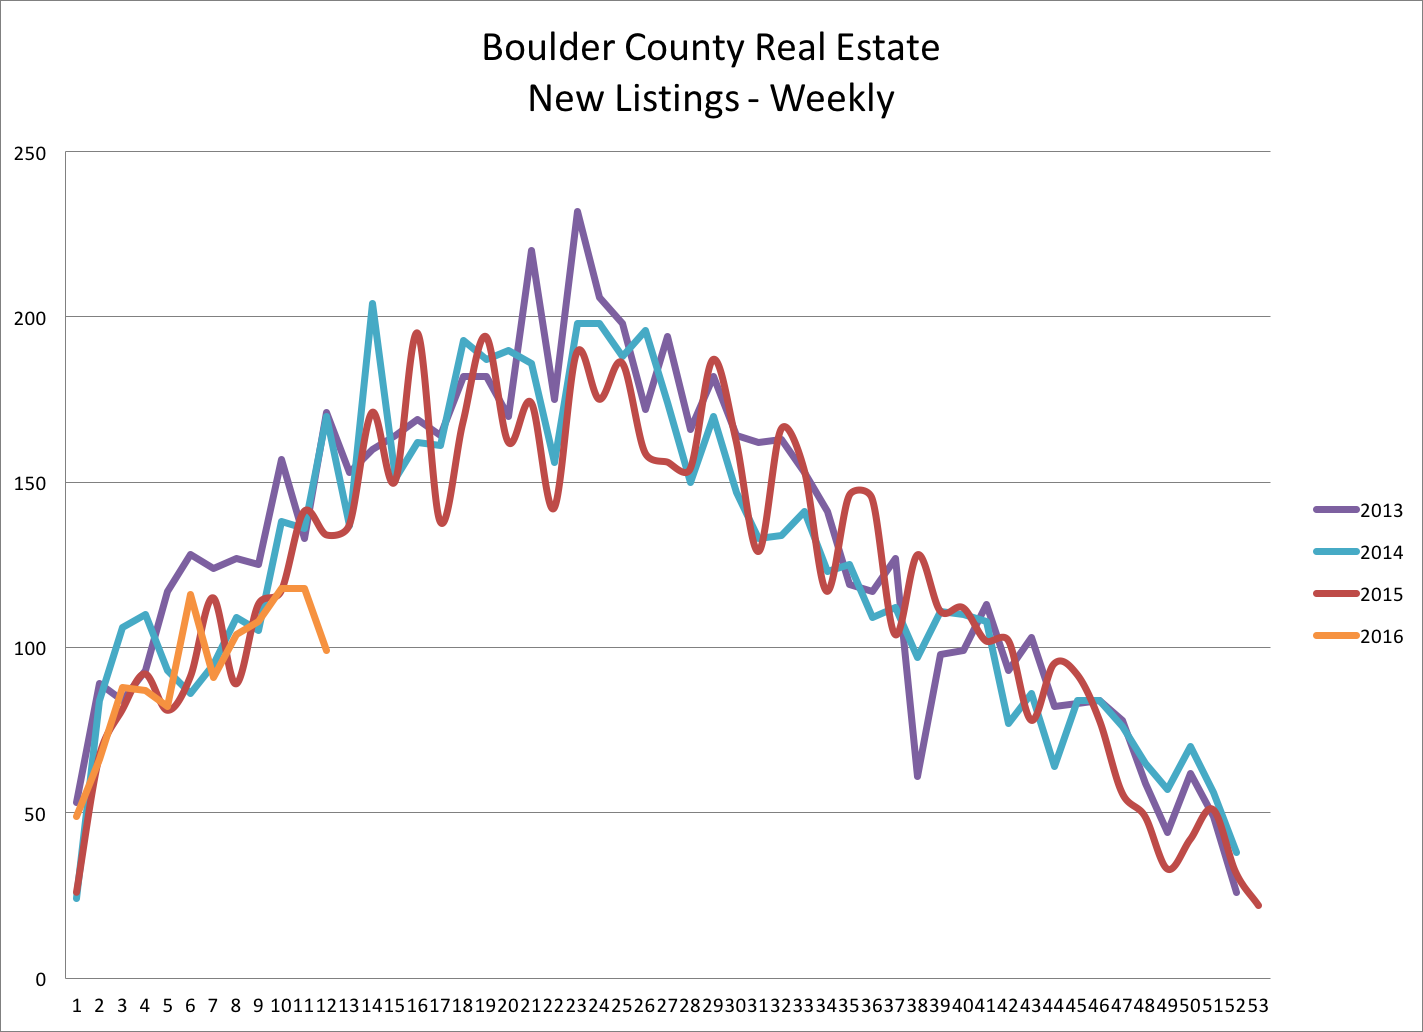
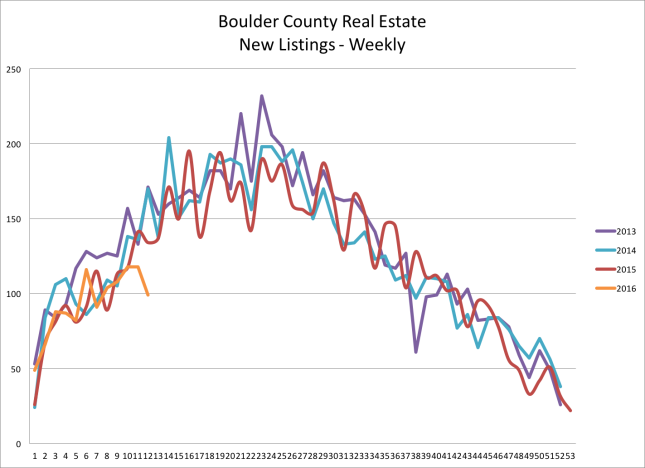
There seem to be plenty of buyers out there looking for houses in Boulder County. But the number of new listings is losing steam and the number of sales is following. Through the end of February sales are down 9% compared to 2015. During February sales were down 13.5% from a year ago. The first chart below shows the number of new listings coming on the market on a weekly basis over the past four years. The activity this year is represented in orange.
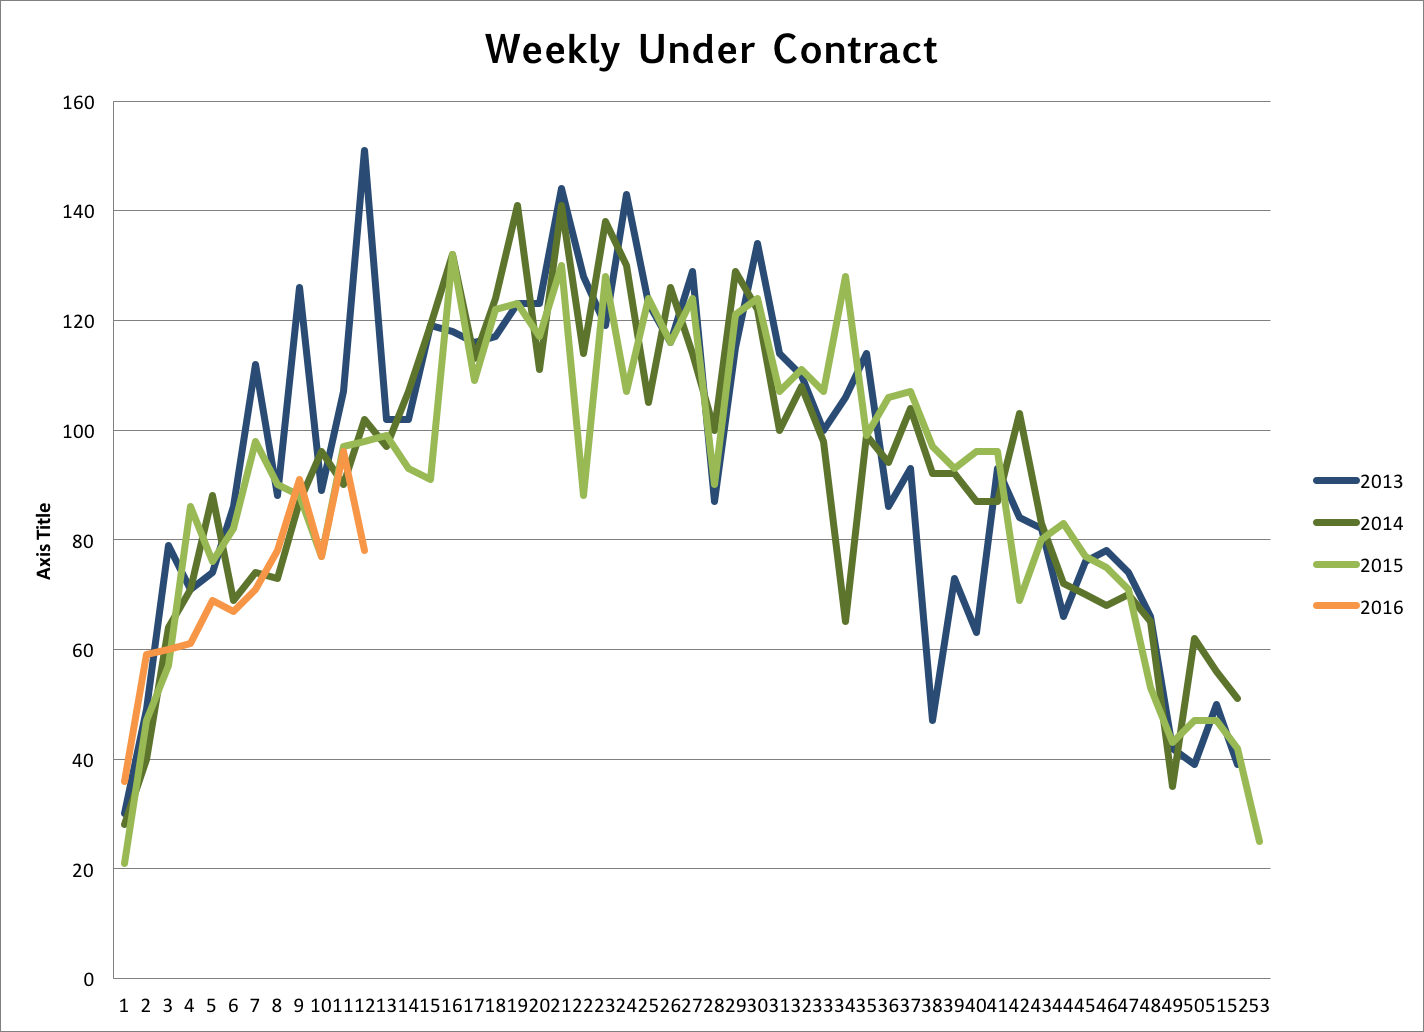
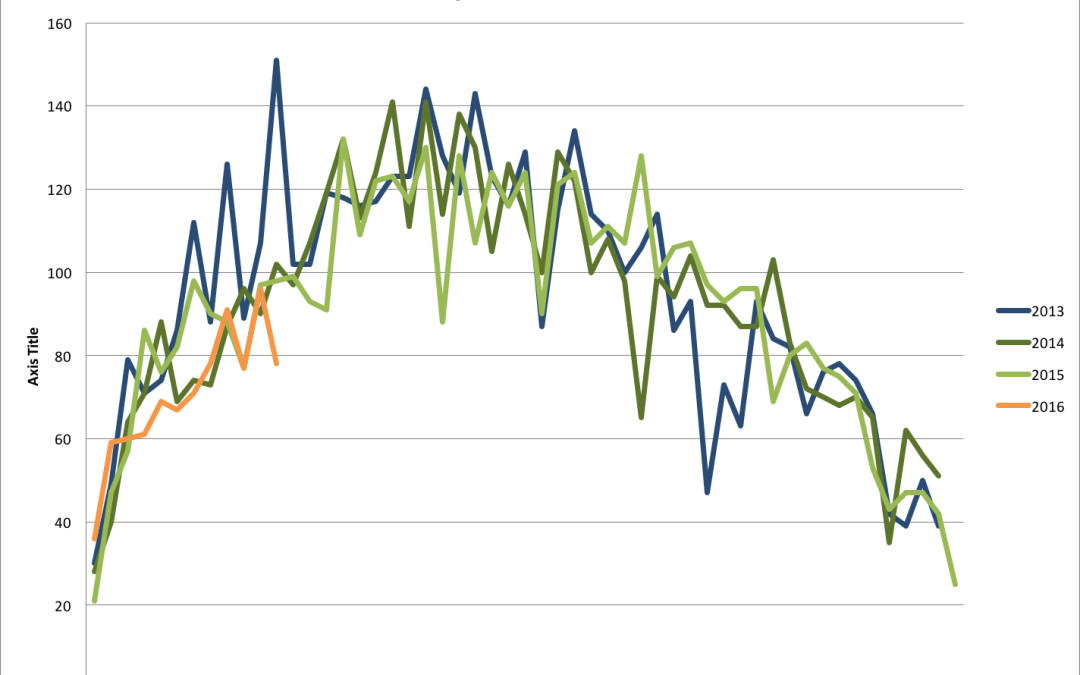
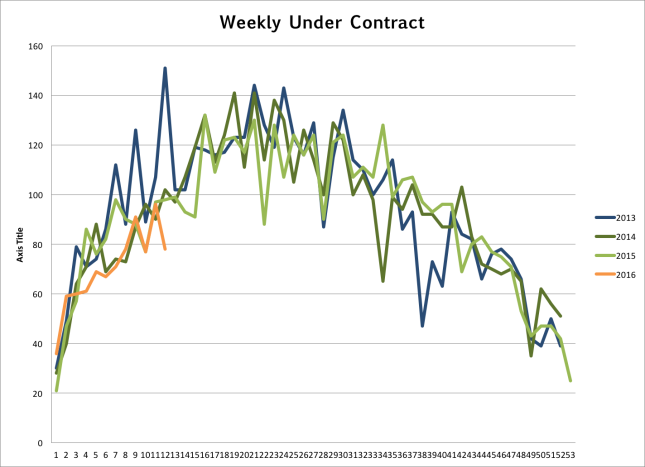
 A forward indicator to future sales is the number of properties that go under contract. The usual gestation period between a house going under contract and getting to the closing table is between 30 and 45 days. The chart below shows the flow of properties going under contract on a weekly basis. The last few weeks have been trailing the average we expect to see this time of year. This leads me to believe that March and April’s sales will not be making up ground on last years closing. The slideshow below shows more statistics that give a broader picture about what is going on in the Boulder County real estate market.
by Neil Kearney | Mar 5, 2016 | Boulder County Housing Trends, Statistics
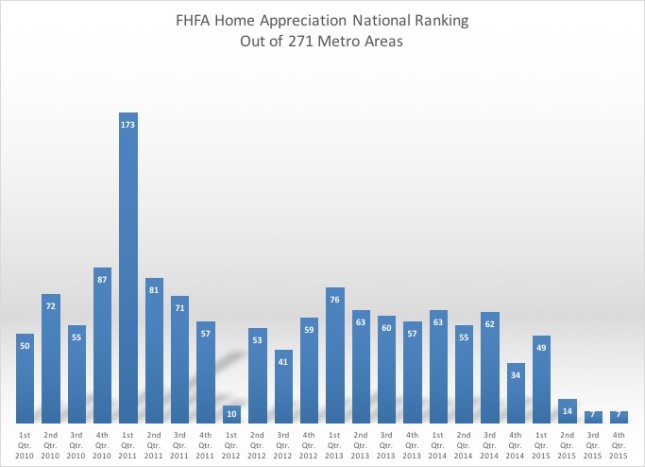
Boulder Home Appreciation Ranked 7th In the Nation
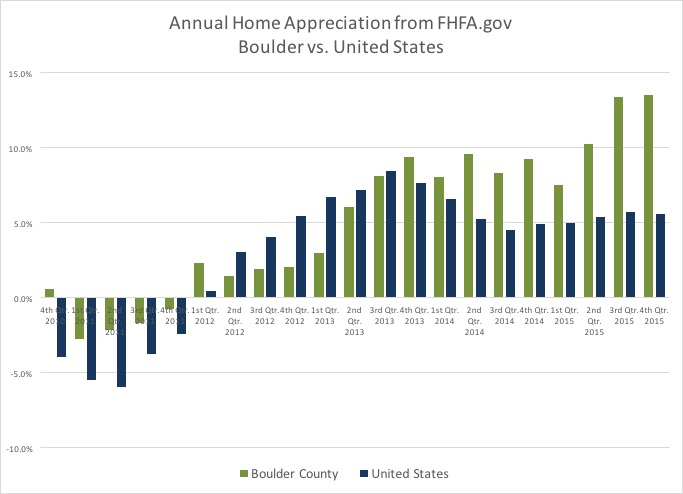
FHFA.gov recently released their report on home appreciation for the period ending December 31, 2015. In the report it shows that Boulder home appreciation is the 7th highest for the year among the 271 largest metropolitan areas in the United States. Boulder had a 13.52% appreciation for the one year period and 2.27% for the fourth quarter alone. The quarterly appreciation for our area ranks 5th in the nation and one of the areas ahead of us was Denver. For our area a strong quarter ended up a very strong year.
The United States average for the one year period was 5.76%. Colorado ranked second among the states with 10.91% appreciation for the year.
Here are a few charts that represent this data visually. The first one shows Boulder’s appreciation compared to that of the U.S. and the second one shows Boulder’s appreciation national ranking over time. This is the most active market we have had in terms of appreciation since 1999 when we were ranked #1 in the nation.