by Neil Kearney | Jun 17, 2015 | Boulder County Housing Trends, Statistics
Boulder County Real Estate
As I search for homes throughout Boulder County I’m finding many areas and price ranges that have very few (like none) homes available that are not already under contract. I also notice that at some price the inventory grows and the market is more available. Here is some research that may help you understand the market. The quick answer is that there are very few choices in the lower price ranges and more opportunity in the higher price ranges.
The slideshow below shows the percentage of homes that are under contract in Boulder, Louisville, Lafayette and Erie by price range. Here are some additional interesting facts:
• There are only 19 listings in the City of Boulder listed below $500,000. 90% of those are already under contract.
• In Louisville, Erie and Lafayette there are 48 listings priced $250,000 or below and 79% of those homes are under contract.
• 68% of all properties listed in Boulder County $500,000 or below are under contract.
• 61% of all properties listed in Boulder County $1,00,000 or below are under contract.
• 33% of all properties listed in Boulder County between $1,000,000 and $1,500,000 are under contract.
• 11% of all properties listed in Boulder County above $1,500,000 are under contract.
by Neil Kearney | Jun 15, 2015 | Boulder County Housing Trends, Statistics
May was a busy month in Boulder real estate. Here are the Boulder County real estate statistics for the month ending May 31, 2015.
- Sales are up 9% year-to-date.
- Sales in May were up just .7% compared to the same month last year.
- The number of listings on the market is down 20% from a year ago.
- 56% of the listings were under contract at the end of May.
The attached annotated slideshow shows this month compared to each and every month over the past five years. It shows trends for sales, inventory and under contract percentage on a monthly and weekly basis.
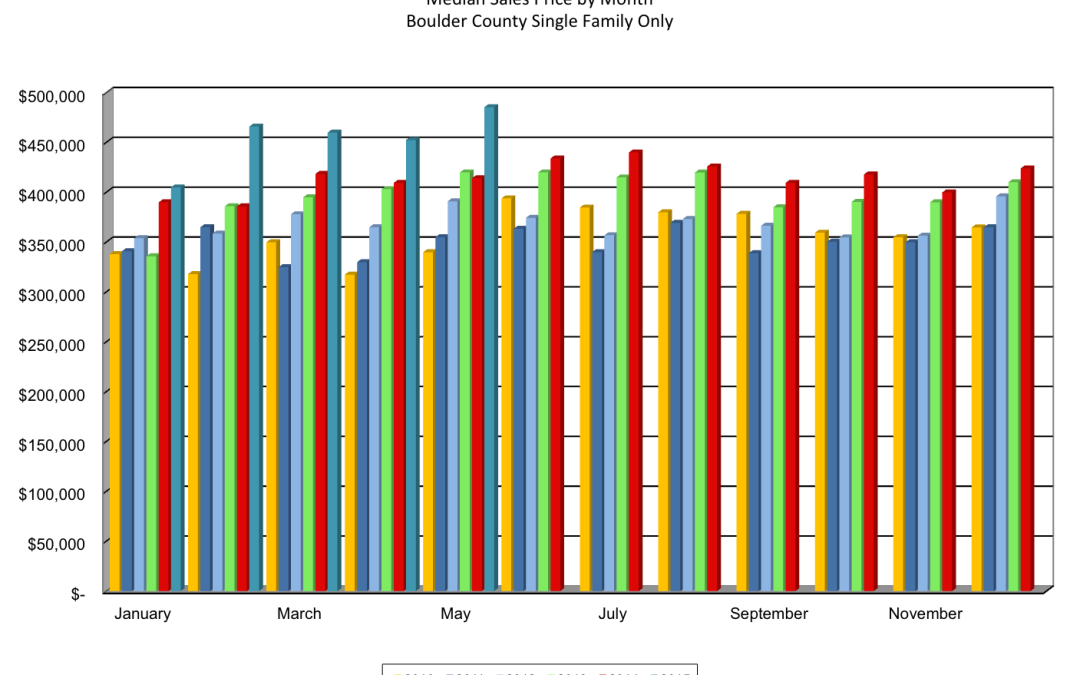
Prices are definitely up. The graph below shows the median price for single family homes in Boulder county over the past five years. You can definitely see a big jump over the past five months.


by Neil Kearney | Jun 9, 2015 | Boulder County Housing Trends, For Buyers, For Sellers, Statistics |

Hold on and get up to speed!
Hold on and get up to speed! Homebuyer’s in Boulder County are getting a crash course in rejection. The local real estate market is still running on all cylinders and seems to have a full tank of gas. In April and May there were 789 real estate transactions that closed in Boulder County. 270 closed at less than full price, 98 closed at full price and a staggering 421 closed above full price! Two-thirds of the sales in our market during the past two months closed for full price or more. The average transaction closed for 1.2% above list price. I haven’t seen anything like it during the past twenty-five years.
Looking more closely at the homes that sold above full price is an interesting analysis. One that could come in handy if you find yourself in a situation where you are competing with multiple offers. The big question is how high do I need to offer? Of course every situation is different but here is the recent data.
Sales in Boulder County closing in April and May of 2015 that sold for above asking price:
Price Range – $0 – $250k Number of sales = 93 average premium paid = 5.5%
Price Range – $250K – $500k Number of sales = 212 average premium paid = 4.5%
Price Range – $500k – $750k Number of sales = 74 average premium paid = 5.1%
Price Range – $750k – $1 Mil. Number of sales = 23 average premium paid = 4.9%
Price Range – > $1 Mil. Number of sales = 19 average premium paid = 5.0%
Overall if a buyer paid above asking price (presumably a majority of these were in a multiple offer situation) the average they paid was 4.9% above the list.
Here are some other statistics from the data set that could be very helpful.
City of Boulder
- 353 total sales
- The average sale closed for 1.4% above full price
- 157 properties sold for a price exceeding full price.
- The average premium paid in Boulder for those houses that sold above list was 5.9%.
- The lower end of the market is stronger than the upper end.
- The average home in Boulder that sold at $500,000 or below sold for 3.2% above list price. The average premium paid for those that closed above asking was 6.4%.
- The average home in Boulder that sold above $500,000 sold for .2% above list price. The average premium paid for those that closed above asking was 5.5%. There was much more negotiation below asking price in this price range on those that didn’t sell for full price or a premium.
Other Areas
- Louisville
- Just 43 sales over the past two months. Average sales price was .6% above list price.
- 18 properties sold above asking price. The average premium paid was 4.4%.
- Lafayette
- 76 sales over the past two months. Average sales price was 2.2% above list price.
- 45 properties sold for above asking price. The average premium paid was 5.1%
- Longmont
- 292 sales over the past two months. Average sales price was 1.5% above list price.
- 150 properties sold for above asking price. The average premium paid was 4.3%.
- Erie
- 42 sales over the past two months. Average sales price was 1.1% above list price.
- 21 properties sold for above asking price. The average premium paid was 3.8%.
- Superior
- 28 sales over the past two months. Average sales price was 1.2% above list price.
- 16 properties sold for above asking price. The average premium paid was 3.5%.
- Other areas including Nederland,Niwot, Lyons
- 56 sales over the past two months. Average sales price was 2.9% below list price.
- 12 properties sold for above asking price. The average premium paid was 2.3%.
Here are my takeaways from this information.
Over half of the homes that sell are selling for above list price. If you find yourself interested in a house that has multiple offers the average amount that you should expect to pay is around 5%. The median is actually around 4%. So if you had bid 4% over on a home that had multiple bids you would have been successful half of the time over the past two months. Over the past 10 years the average negotiation on all sales has been 2.8% below list price. This is the first time I can remember that the average sale has gone above list price.

by Neil Kearney | May 28, 2015 | Boulder County Housing Trends, Statistics
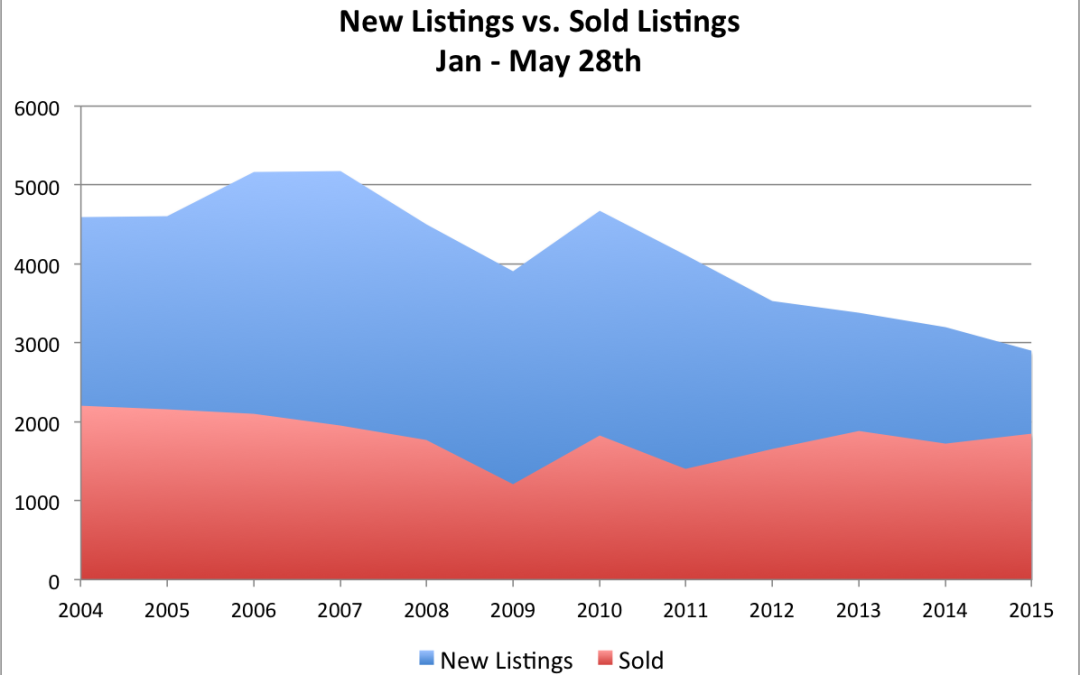
It’s seems that I’ve been reporting on the same trend for a few years now; declining inventory. I’ve looked at the causes of low inventory and have touched on the effects in many other articles. Today I’m going to analyze new listings with sales so that we can compare markets across years.
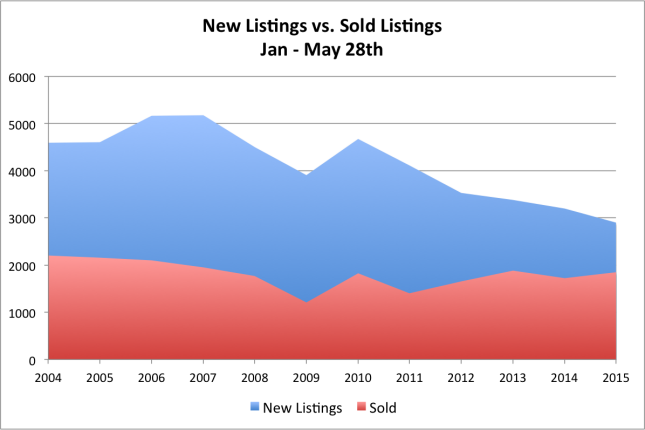
The graph above shows the number of new listings in blue and the number of sold listings in red. The data is from IRES MLS and includes both single family and condo listings in Boulder County. All data is from the time frame of January 1 – May 28th for each year.
If you just look at the sold (red) portion of the graph you will see that overall there has been a slight decline in sales from left to right with a large dip in 2009 and then an uneven recovery. In 2009 sales were down 45% from 2004. Year-to-date in 2015 sales are down 16% from the peak in 2004.
Now looking at the blue portion of the graph you see that new listings have been sliding since 2007 with the exception of a brief respite in the recovery year of 2010. By May 28th of 2007 there had been 5,179 homes listed across Boulder County, so far this year there have been just 2,904. This is a 44% decline in new listings.
So let’s put these two pieces together. Sales are down 16% and new listings are down 44%. This makes for a lack of supply. On the chart you can see the squeeze on the right side of the graph.
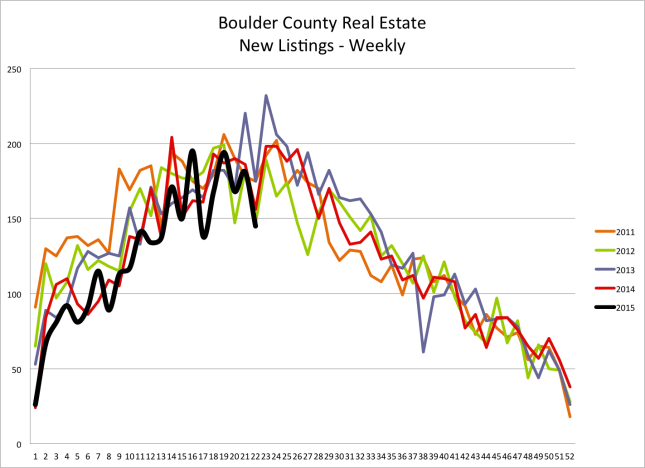
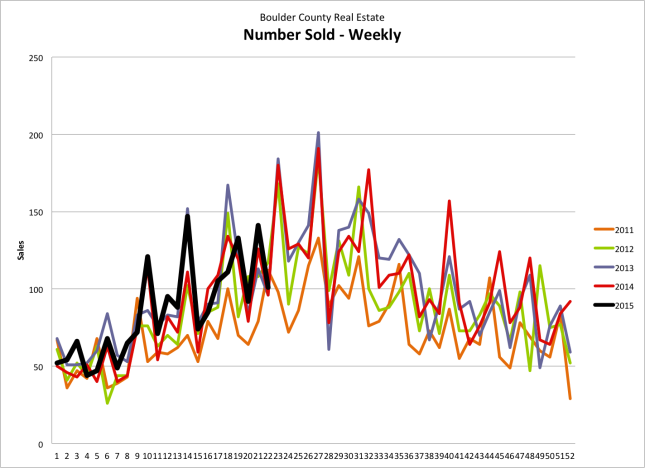
I track the number of new listings, sales and recent under contracts on a weekly basis. The two graphs below show the number of new listings that have come on the market, the number of sales and the number of homes that have gone under contract on a weekly basis. The graphs include five years of data. You can see that the number of sales and under contracts are similar to the comparison years but the number of new listings is lacking.

by Neil Kearney | May 27, 2015 | Boulder County Housing Trends, Statistics
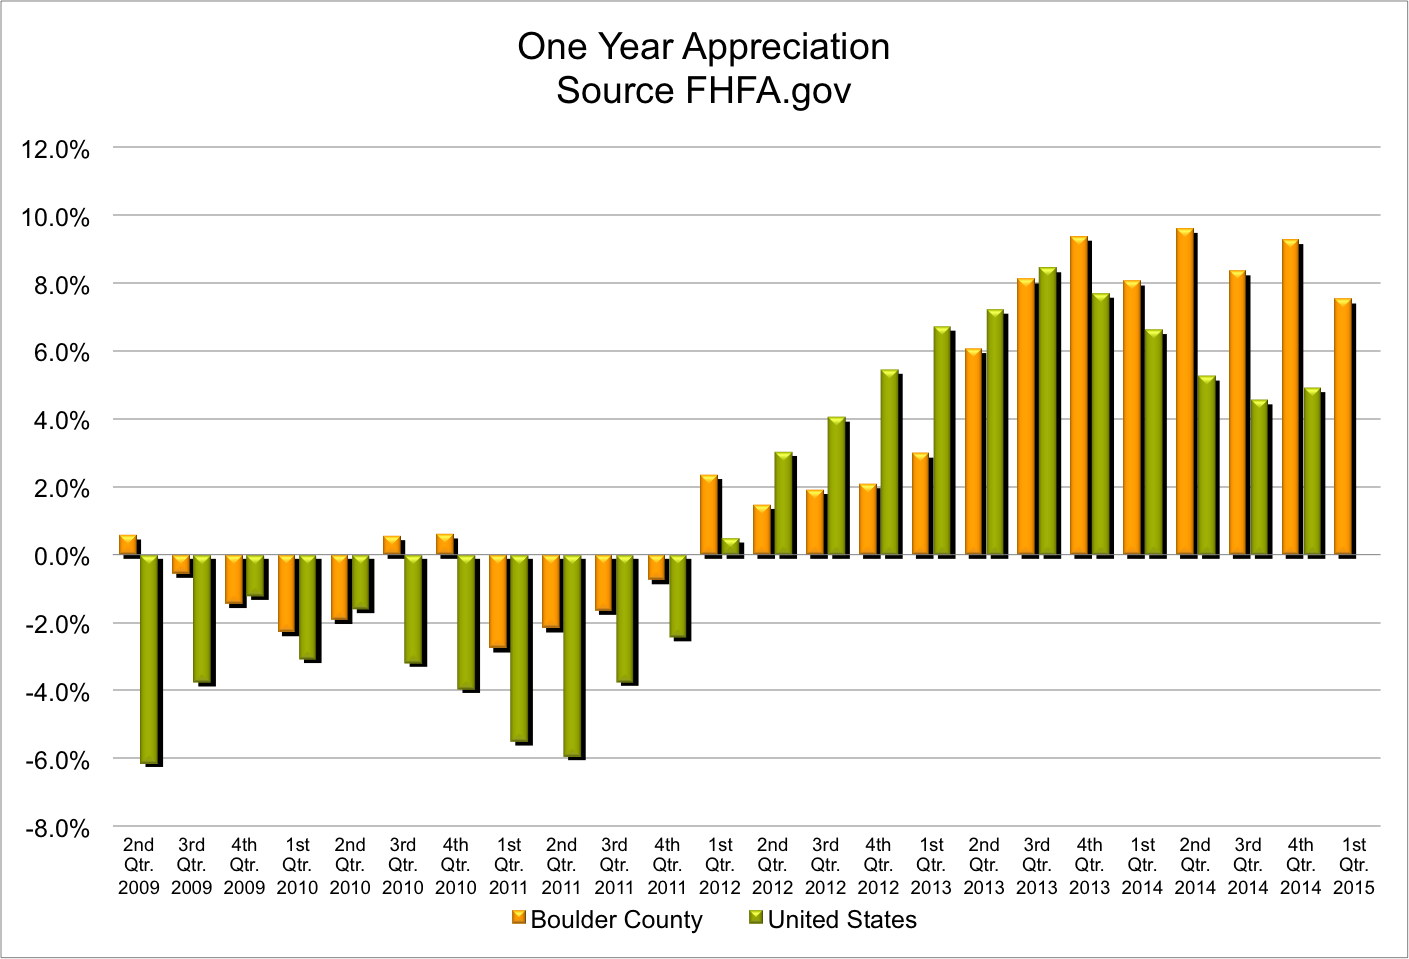
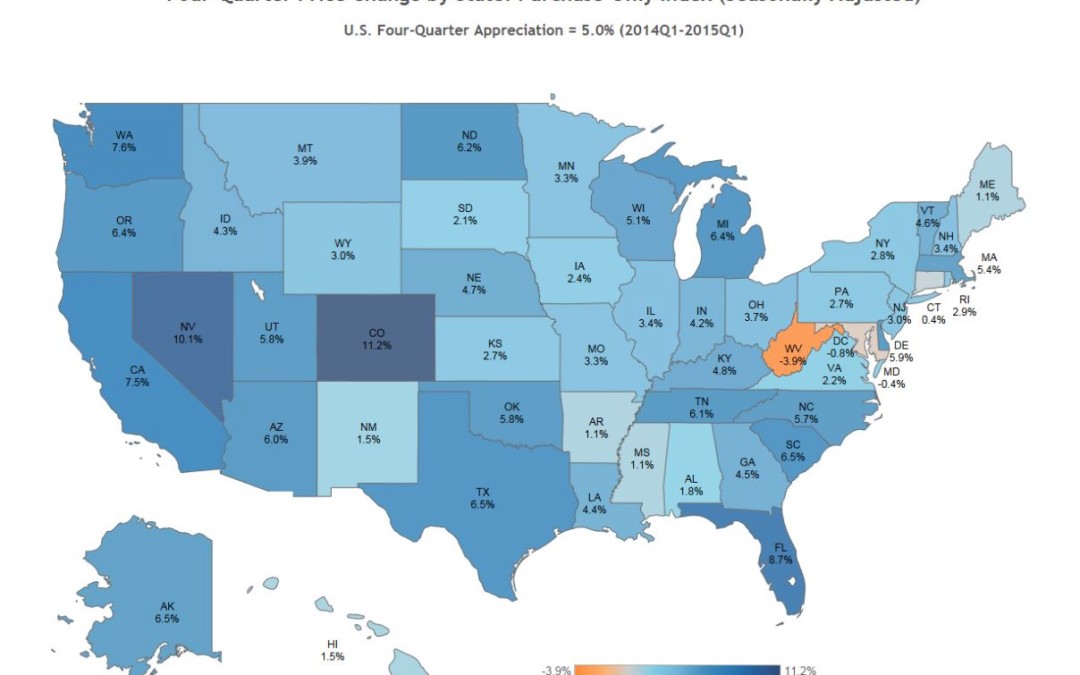
FHFA.gov recently released their first quarter home price index and Colorado home appreciation topped the list for the year ending March 31, 2015. Each quarter FHFA, the federal agency in charge of housing publishes a report that compares the home appreciation in each state as well as the largest 275 metropolitan areas. For the one year period ending March 31st homes in Colorado had appreciated on average 11.16%.
Within Colorado they track the six largest metropolitan areas. Here are their statistics from the recent report:
Name 1 year appreciation 1st Qtr. 2015 5 year appreciation
Boulder 7.52% .45% 20.75%
Colorado Springs 6.01% 2.06% 6.67%
Denver 10.16% 1.45% 27.07%
Fort Collins 9.04% 1.41% 22.31%
Grand Junction 4.93% 1.9% -6.46%
Pueblo 4.84% .51% 2.89%
The top twenty metropolitan areas for appreciation over the past year have been:
- Naples, Florida – 20.06%
- Port St. Lucie, Florida – 13.23%
- Reno, Nevada 12.30%
- Palm Bay, Florida 11.78%
- Daytona Beach, Florida 11.29%
- Miami, Florida 11.28%
- Fort Myers, Florida 10.73%
- Flint, Michigan 10.66%
- Punta Gorda, Florida 10.6%
- San Francisco, California 10.57%
- Houston, Texas 10.43%
- Anacortes, Washington 10.41%
- West Palm Beach, Florida 10.3%
- Denver, Colorado 10.16%
- Salinas, California 10.11%
- Las Vegas, Nevada 10%
- Austin, Texas 9.84%
- Vallejo, California 9.54%
- Gainesville, Georgia 9.53%
- Santa Cruz, California 9.48%
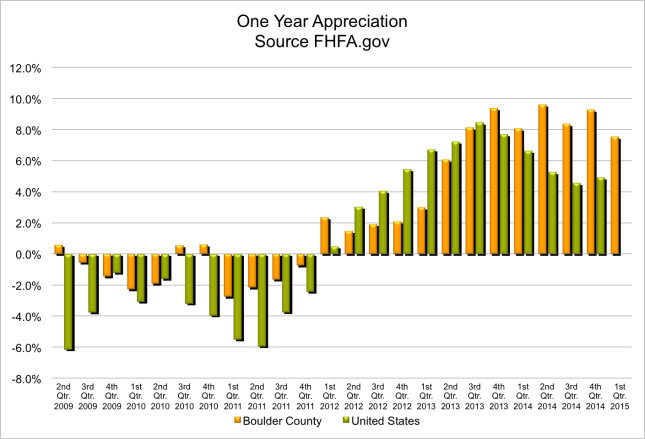
Here is a graph comparing Boulder’s appreciation to that of the United States. Over the past five years homes have appreciated on average by 14.23% in the United States and in Boulder they have gone up by 20.75%.
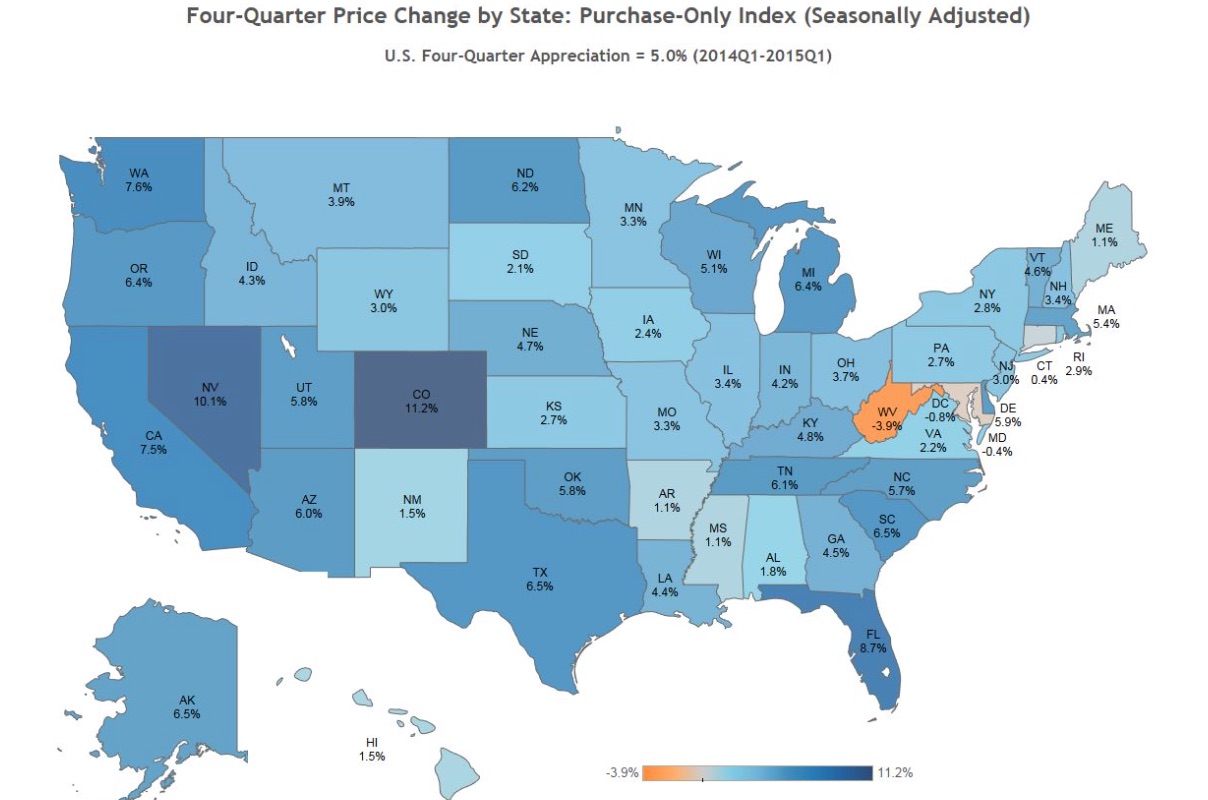
Below is a map showing the one year home appreciation for each state. The map says it’s seasonally adjusted. Either the adjustment is fairly large or the areas outside of the main metropolitan areas (for example the ranches and mountain resorts) must have had very high appreciation to bring up the average of the state to above Denver’s one year average.
 To me the numbers for Boulder seem low. It will be interesting to see how they measure the second quarter for us since we are seeing a noticeable jump in prices this spring.

by Neil Kearney | May 11, 2015 | Boulder County Housing Trends, Statistics
The Boulder County real estate market continues to be very hot. Inventory has not kept up with demand and as a result multiple offers are very common. Negotiations on the most popular homes are escalating quickly and prices are sometimes ending up over 10% above the asking price. For the first time since I can recall, average sales price exceeded average list price for the month. To put it another way, on average, every home in Boulder County for the month sold for more than list price.
This exuberance hasn’t yet spread to the $1 million plus segment of the market. Prices seem to be compressing. A $650,000 home a few years ago is now selling for $800,000, but the $1 million home has only seen $50 – $75,000 gain. It will be interesting to see if the normal gap develops.
The slideshow below shows Boulder County sales, inventory and under contract percentage going back five years. You will also find weekly activity of sales, under contract homes and new inventory compared over the past four years. The trends are clear, inventory is holding back sales.