Overview
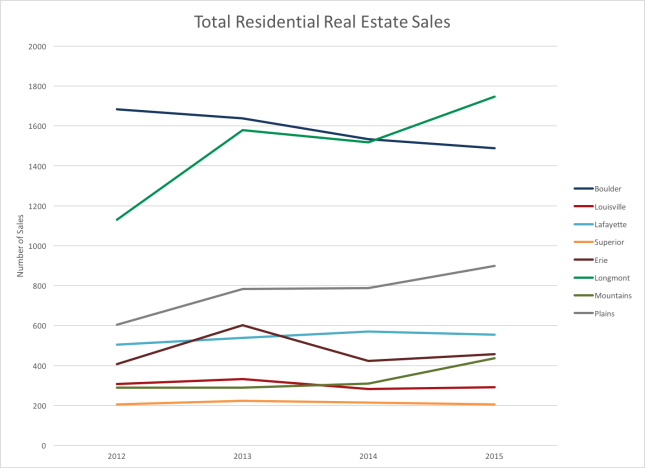
2015 was one of the most interesting years in the Boulder County real estate market since I have been tracking it. Although inventory of available homes was very low throughout the year, sales increased by about 8%. (See Figure A to see the trend) High buyer demand and low inventory caused intense competition for available homes and these factors conspired to cause prices to rise by an average of 11% throughout the county. (See Figure E) It was a great year to be a seller and a challenging and often frustrating year to be a buyer. Many buyers found that they had to make offers on many homes before they were successful.
Figure A 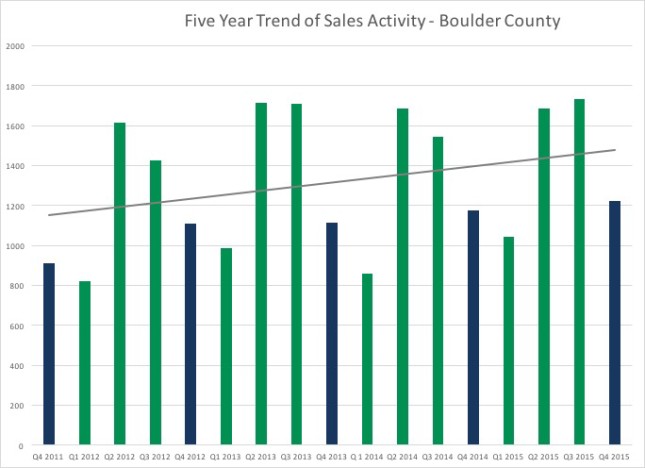
Demographics
Over the past few years, our local real estate market has been one of the top markets in the nation. So what is causing us to have such a strong market? Let’s start with demographics. The population in the United States grew by 2,576,104[1], an increase of .79%. In 2014, Colorado’s population grew by 82,485, or 1.6%. This made it the eighth fastest growing state in the country in total population change and the fourth fastest in terms of percentage growth. Of the 82,485 increase, nearly 51,000 were people who moved in from another state.[2] The top four states where people are moving to Colorado from are; New York, California, Texas and Illinois.[3] People move to Colorado for the excellent lifestyle, outdoor recreation opportunities, the strong economy, including good employment opportunities and the climate. Each new household that is formed needs a place a live. Between 2008 and 2014, there were 113,230 more households formed than housing units. In 2008 there was a surplus of housing, but a few years ago the surplus was exhausted and with it, the vacancy rates for rentals and the inventory of homes on the resale market dropped. The market has responded with a slew of new rental communities throughout the front range, which has filled a need, but new construction of for sale homes and condos hasn’t met the demand. In an interesting side note, you may have noticed that there are many apartment complexes (for rent), but very few condo complexes (for sale) being built. This is largely due to the condo defect legislation which allows as few as two owners to bring a class action lawsuit against a condo developer. This law was passed in 2005 and the outcome has been that developers have avoided these types of projects. For them it just isn’t worth the risk. The current population of Colorado is estimated at 5,443,000. And it’s estimated to increase to 6 million by 2020 and to nearly 8 million by 2040.[4] All of those new residents will need housing.
Low Inventory
Throughout most of my career, it was typical that when a buyer would call asking to look at homes I would pick the best five and then take them out for an afternoon of showings. In the current market this scenario is virtually non-existent. Today it’s typical for a buyer to wait for weeks on end for a house to come on the market that meets their criteria. Then when something comes up, we hustle out to see the property along with a dozen other similarly hopeful, and motivated buyers. At the end of December there were 871 total homes, condos and townhomes on the market in Boulder County. After subtracting those that were already under contract, there were just 444 available homes to view. (See Figure F) This includes all areas and all price ranges! This is in a county with over 300,000 residents. As this is written in early January there are a total of 473 properties available in all of Boulder County. 19 are listed below $250,000, 115 are listed between $250 and $500k, 98 between $500 and $750k, 74 between $750 and $1 million and 167 listed above $1 million. In the City of Boulder, it is even more striking. There are currently 5 single family homes available to show in the City of Boulder under $750,000 and just 5 attached dwellings in Boulder listed below $500,000.[5] This is a yearly low and I expect it to improve, but still! Despite the lack of inventory in 2015, sales did increase. This means that the flow through the market, from listing, to contract, to sale, was very fast. Average days to offer decreased this past year from 38 days to 29 days. Figure B below shows the end of month inventory trend over time.
Figure B 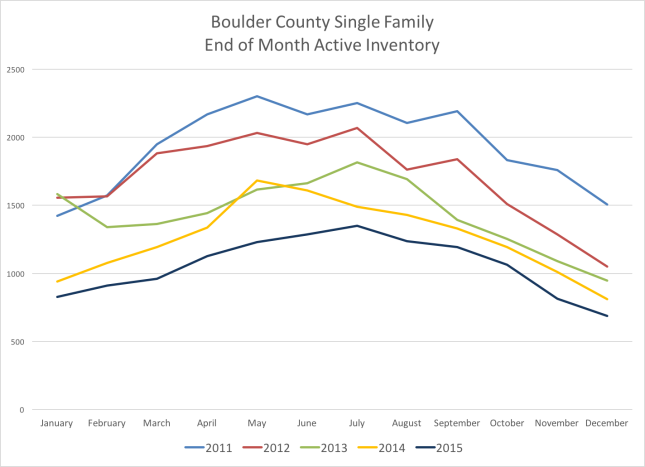
Home Price Appreciation
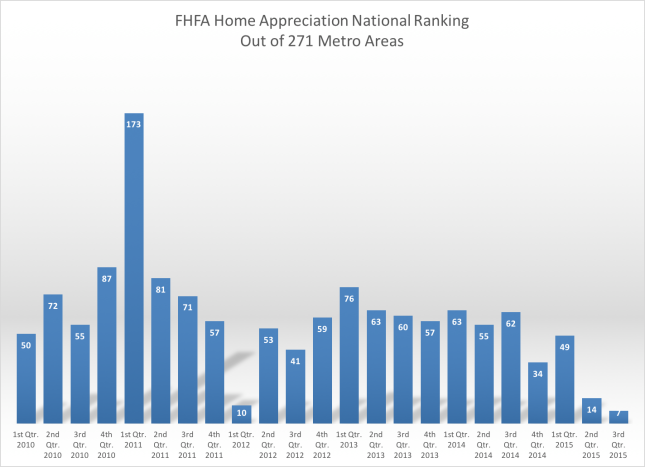
Strong price appreciation has been the direct outcome of the positive household creation and the lack of inventory. Strong demand and limited supply results in increased prices. According to FHFA.gov, home appreciation in Boulder County averaged 13.39% for the one-year period ending September 30th 2015. (See Figure C) This ranked us 7th in the nation. (Denver was ranked 4th with 13.91%). Colorado, with 12.66% was the top state for appreciation (behind only Washington D.C.)
Figure C 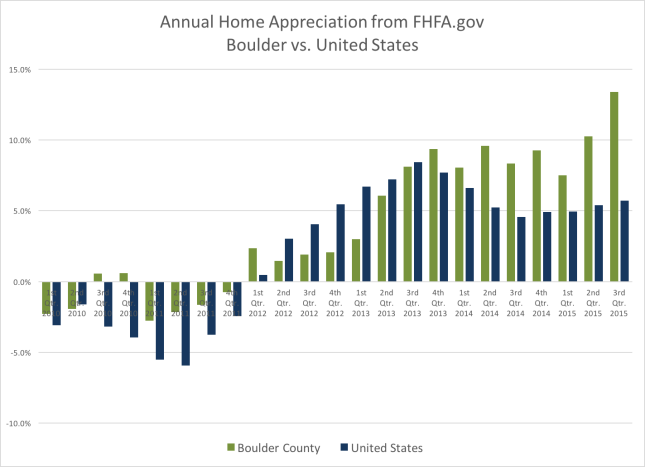
Interest Rates
For a number of years, we have all been expecting to see the inevitable rise of interest rates. But during 2015, year mortgage rates stayed within a tight range. As we began 2015 the 30 year fixed rate was 3.86%. As we begin 2016, the rate is at 3.96%. (See Figure D Undoubtedly, this has helped houses in this appreciating market remain somewhat affordable and has kept buyers in the buying mood. Figure D 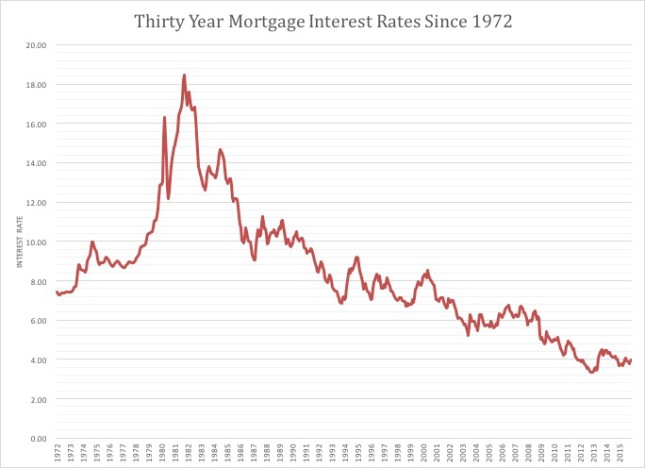
Multiple Offers
Rocket fuel for home prices are multiple offers situations. This is when more than one buyer wants the same house at the same moment. There isn’t a resource that shows the number of homes that received multiple offers but those homes that went for over full price are a good proxy. During the year, 43% of the homes that sold in the City of Boulder sold for over full price! Of those that sold for a premium, the average premium paid over full price was $24,557 or 4%. As inventory increases, buyers will have more options and will not need to compete with other buyers as much. But for now the market is running on premium rocket fuel.
The Shrinking of the lower price range
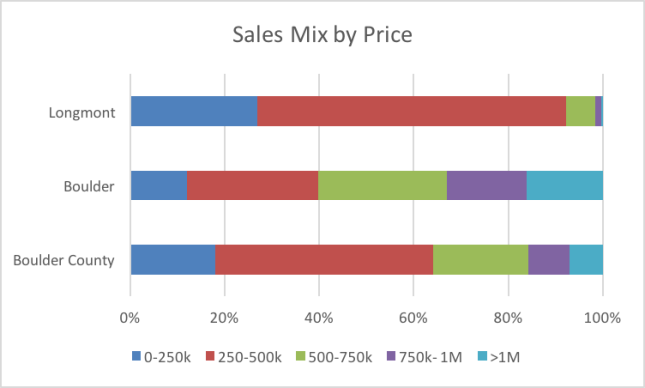
As the prices of entry level houses rise, it becomes more and more difficult for first time homebuyers to enter the market. This puts even more pressure on rentals. In the 4th quarter of 2011 40% of the sales in Boulder County were for $250,000 or less. In 2013 this price range accounted for 33%, and in this most recent quarter, it was just 18%. (See Figure E) There are very few affordable options out there and this price range has been consistently shrinking.
Figure E 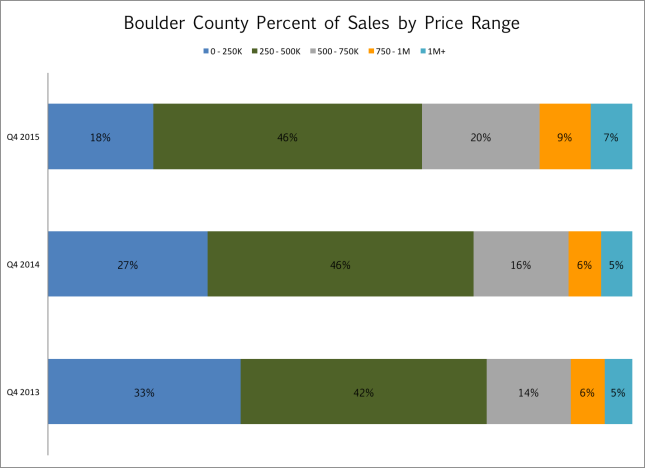
The Future
So what does the future hold? It’s always a difficult question. But in the short term I don’t see a big change in the factors that have caused the extreme sellers market in our area. New residents are still flocking into the area, the economy is still creating jobs and on top of all that, people are staying in their homes longer than they were before. Real estate is cyclical; it will slow down. The question is, what will cause a trend change. As interest rates rise, affordability will become a factor. But that will most likely be a slow change. It might take a macro-economic or geopolitical event to turn the tide. But for now it’s full speed ahead into 2016.
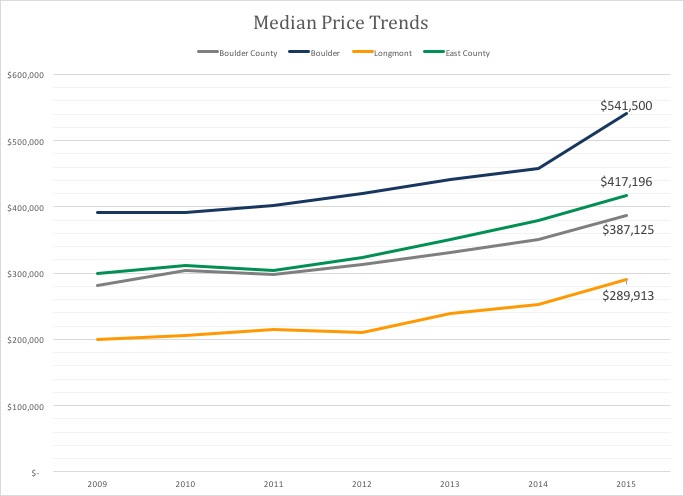
Figure F – Median Price Trends 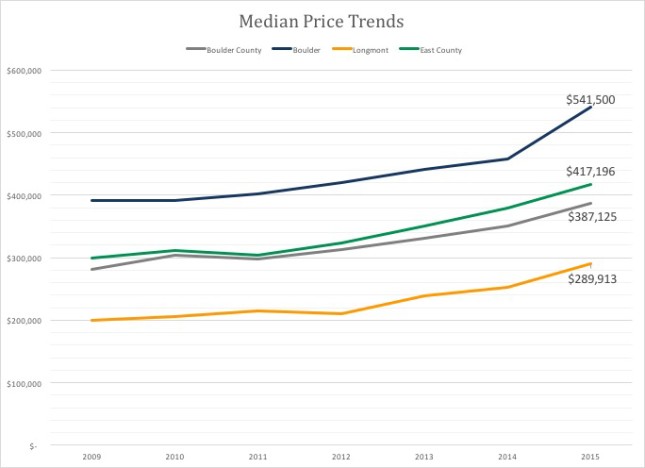 Quick Summary
- Total sales in Boulder County increased by approximately 8% in 2015.
- Through the end of the third quarter, FHFA.gov showed homes in Boulder County appreciating by over 13% during the previous four quarters. This ranked 7th
- In 2015, 43% of all properties sold within the city limits of Boulder closed for a price higher than the list price. Another 22% sold at the asking price.
- The average premium paid in Boulder for those homes that sold above list price was 4.42%.
- It is predicted that Colorado’s population will grow by 45% over the next 25 years, to just under 8 million.
Now, more than ever you need a real estate advocate who has the experience and knowledge to lead you through this market. When you choose an agent from Kearney Realty Co. you choose an agent who works on your behalf with complete integrity. This past year, in a challenging market Neil helped more buyers and sellers than ever navigate this market successfully. This year, if you plan to buy or sell real estate go with a local, trustworthy, award winning Realtor.
[1] Worldometer.com
[2] Leeds Business School’s Colorado Business Economic Forecast 2016
[3] www.Census.gov
[4] Colorado State Demography Office
[5] Most Statistics in report are from IRES MLS