by Neil Kearney | Jul 5, 2016 | Boulder County Housing Trends, Boulder Real Estate
What a difference a few months make. Back in April every new listing was inundated with buyers. Open houses were flash mobs and multiple offers were the norm. Since Memorial Day it seems to be a different market and I’m trying to figure out if the fundamentals have changed or if everyone is just away on vacation.
First of all, this is not an unusual trend. The common perception is that summer is “the” time for real estate sales. That might be true in other places, but in Boulder County spring is king. Every year the market slows down for the summer. Most years it’s in June, last year it was in late July and this year it appears (in hindsight) that it was late May.
Let’s be clear, the market conditions in Boulder County are still good, transactions are still happening, buyers are still out looking, new listings are coming on the market and deals are closings are still happening but it seems that the pressure in the market has waned. Especially in the high end of each towns market.
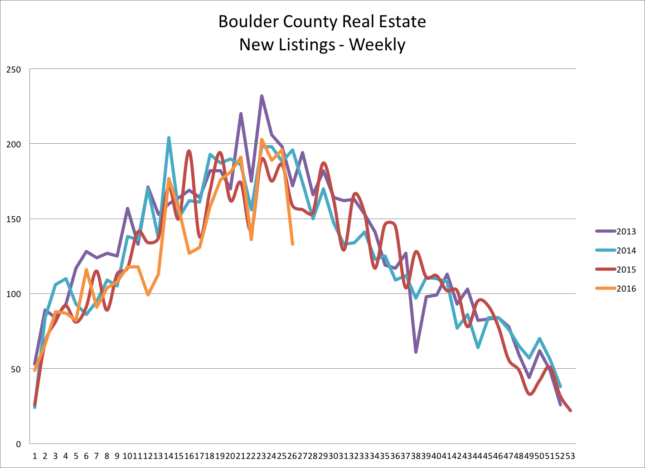
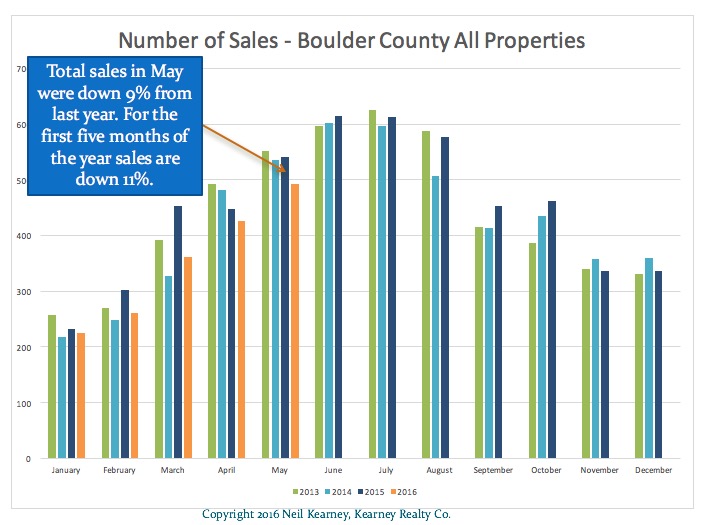
In this article I will present a number of different measures that measure market activity. Cutting to the chase it isn’t clear cut. Let’s begin by looking at sales. This first chart shows the number of closed transactions in Boulder County each month over the past five years. The orange line shows sales in 2016 and it’s clear that we are not keeping up with last year’s torrid pace. Through the first half of the year sales are down 10% from 2015. Inventory is low compared to past years and this has definitely been a cause for the lower activity. When buyers don’t have many houses to see the chances that they find one to buy goes down. This next chart shows the flow of new listings to the Boulder County market (all price ranges and types) on a weekly basis. It appears that new listings peaked back at the end of May and if we follow the trend will be decreasing for the rest of the year.
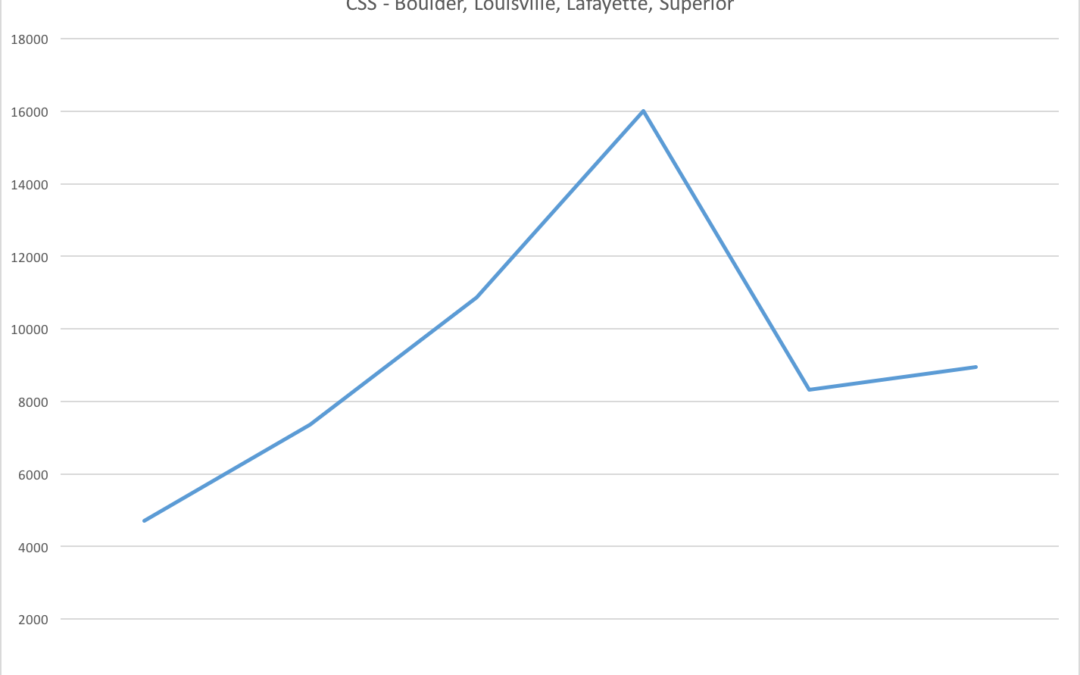
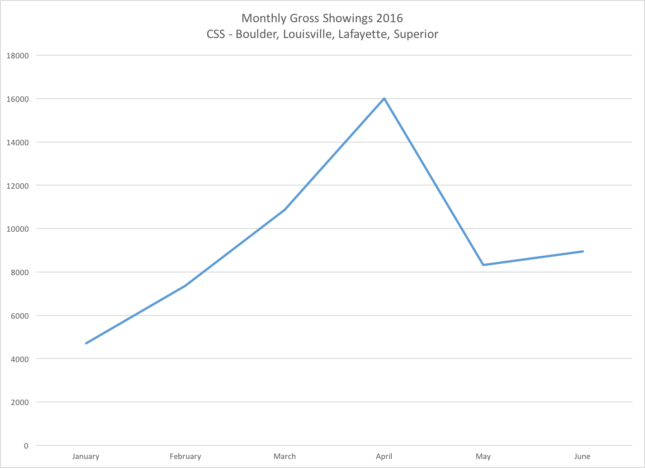
Unfortunately, showings started falling just as more new listings were coming to the market. More listings and fewer showings means that buyers didn’t have the sense of frenzy as they did back in April. The graph below shows the gross showings by month in Boulder Louisville and Lafayette as set by Centralized Showing Service. They don’t handle every showing in town but they have a very significant number and the sample is large enough to call it representative.
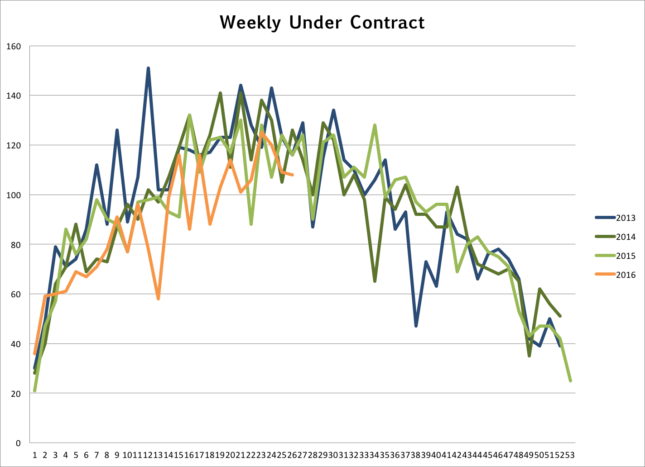
 So far everything makes sense. This is where it gets a bit fuzzy. I track the number houses that go under contract each week in Boulder County. From the graph below it appears that sales are still brisk. This shows equal or more contracts even while there were fewer showings. Obviously there are still buyers out there and finally with less competition they can jump on a property and get their offer accepted. It’s been all too common these past few years for buyers to look around a quite a few houses, find the right one, get beat out in a multiple offer situation and then be forced to start anew. Wash, rinse, repeat! This cycle pumps up showings. In the old days, a new listing comes on the market, buyer sees the listing, buyer likes the listing and then buyer buys the listing. Maybe we are getting back to that. Refreshing!
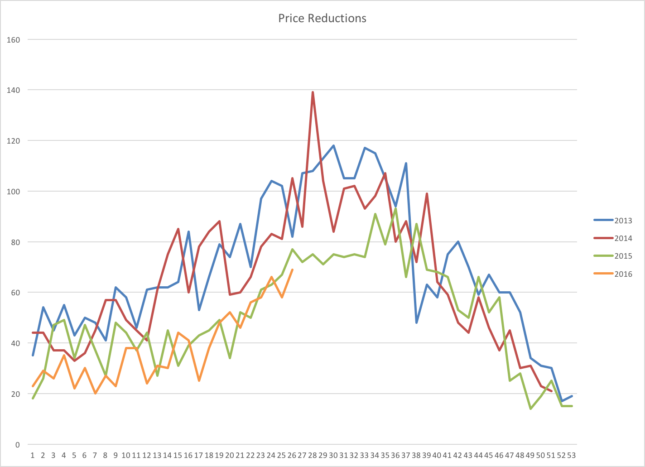
Before I started checking any of these statistics I felt the market slowing. Fewer listings for my buyers to see, not so many people at open houses and houses staying on the market a bit longer (what’s longer than immediately?). In an extreme sellers market sellers sometimes get greedy and when they don’t get their price in the first week to ten days they come back to reality a bit. So it would make sense that there would be more price reductions. Looking at the graph below we can see that the answer to that query is technically yes, but it doesn’t support the hypothesis that the market has changed.
 Given the information below it seems that the market has slowed but it seems more like a vacation than something more permanent. If you need to sell your house this summer you may need to lower the price. If we are patient, we will most likely feel the pressure rise when the buyers are back in town.

by Neil Kearney | Jul 2, 2016 | Listings
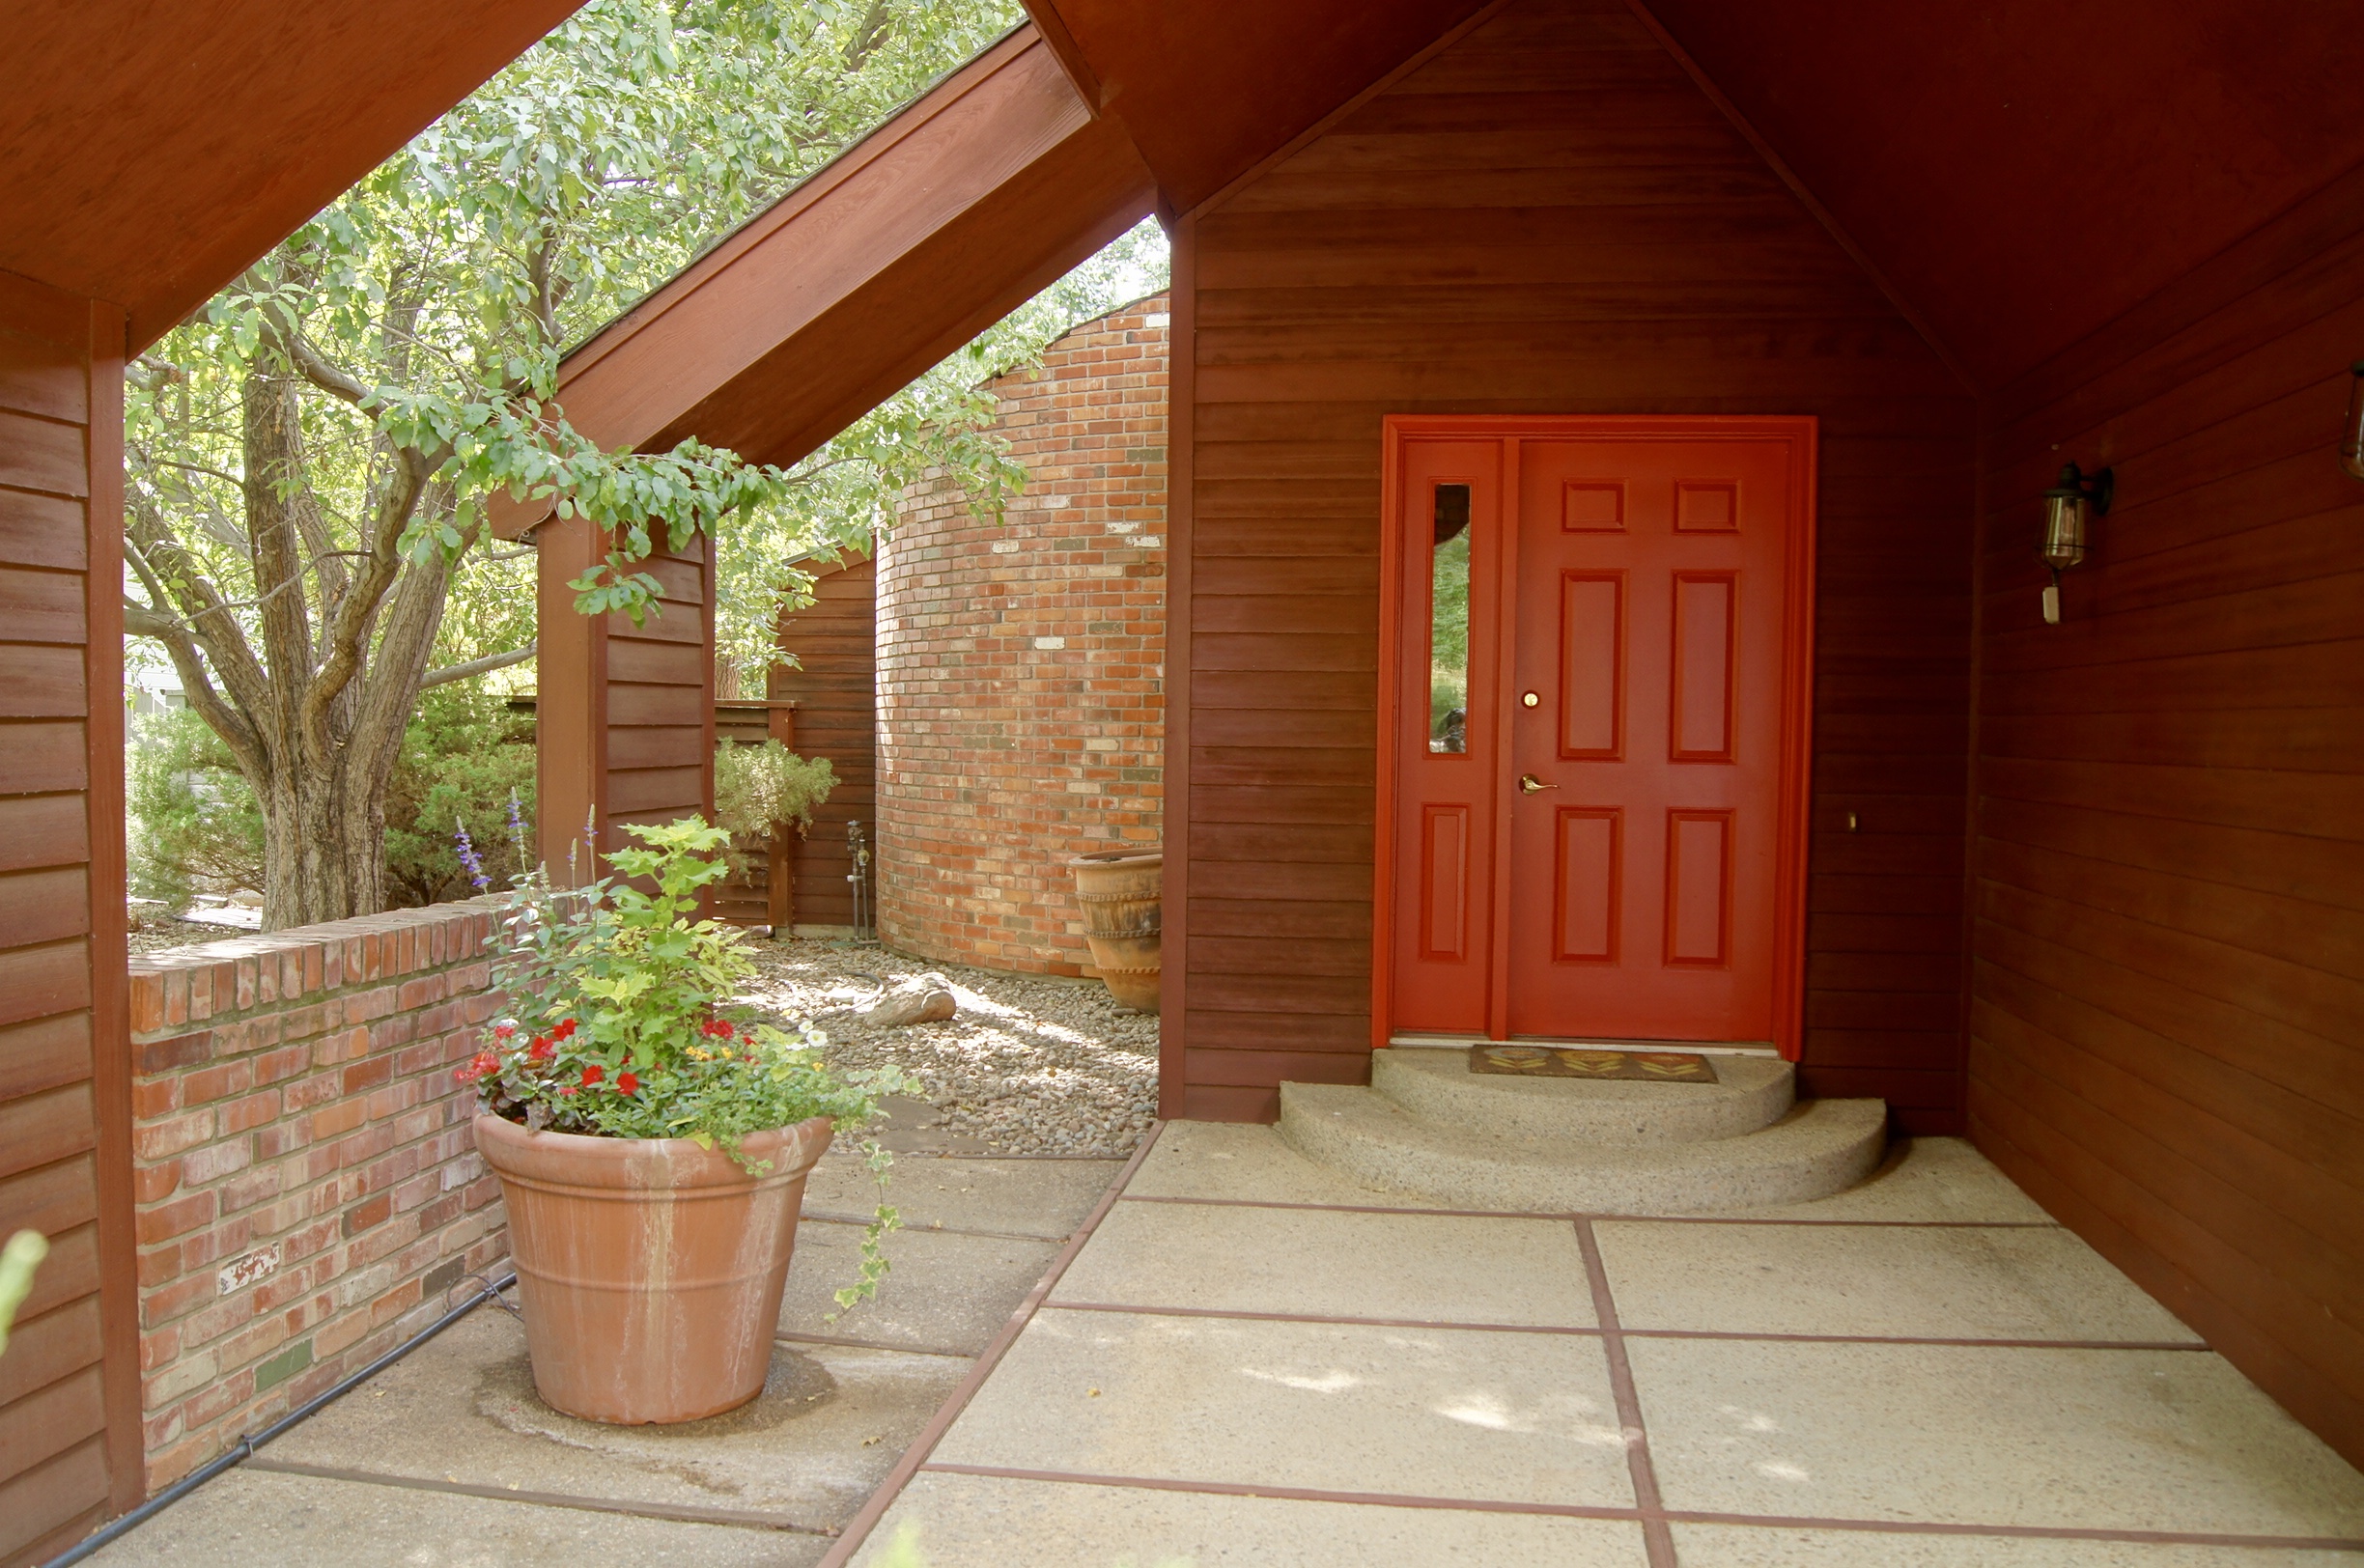
875 Meadow Glen Drive Boulder CO 80303 – $825,000
I just listed a great new house in Boulder. It’s definitely not your typical cookie cutter home.
Idyllic setting backing to a beautiful pond and association open space. Architecturally interesting single family home with tons of windows and light. Low maintenance home that is a great lock and leave, HOA takes care of all of the grass, gardening opportunities inside the private yard. Super quiet neighborhood that is convenient to walking trails, transportation and shopping. Oversized two car garage with room for extra storage or hobbies. This home has a very rare and desirable combination of features for a Boulder home.


by Neil Kearney | Jun 7, 2016 | Boulder County Housing Trends, Statistics
Boulder Real Estate Statistics for May 2016
This is the busy time of year. Buyers are out looking, home sellers who have been prepping their homes all spring are putting them on the market. There is a lot of activity! However, the trends I have been watching over the past few years are continuing; low inventory of available homes and high buyer demand – which are resulting in higher prices and fewer sales.
Here are a few highlights from the slideshow/report below.
- Through the end of May sales are down 11% for the year.
- Inventory is down 45% when compared to two years ago.
- 53% of the homes available on the market at the end of May were already under contract.

by Neil Kearney | May 26, 2016 | Boulder Real Estate, Colorado Lifestyle, Visiting Boulder |
I stumbled across this video produced by The City of Boulder about the Boulder Comprehensive Plan. The video is not only well produced and beautiful, it gives some historical insight as to the creation and maintenance of the open space that surrounds our fair city. When I am showing around someone from out of town for the first time I always tell them about the foresight of our city forefathers (just over 40 years ago) who started preserving what was unique and great about our area. Can you imagine if market forces were allowed to prevail and there was a sea of houses and strip malls in an unending swath from the foothills to the city limits? If you appreciate the lifestyle in Boulder it’s well worth a watch.

by Neil Kearney | May 25, 2016 | For Buyers, For Sellers, Real Estate 101
 Do you know what PITI is? If you have a loan on your home you probably know that these are the four elements of a mortgage payment. P stands for principal; the first I stands for Interest; T stands for taxes and I stands for insurance. Together they make up the amount you pay for your home on a monthly basis. If your PITI payment is comfortable for you, you will have extra funds available to pay for all of your living expenses, be able to save some money on a monthly basis and have some left over for some fun. But many times as we consider how much of a house we can afford we key in on the price of a home and the interest rate (these go into determining the ‘P” and first ‘I’) without much considering the ‘T’ and the ‘I’.
Before I get started talking about property taxes I want to make it clear that this is not a comprehensive article on taxation. There are many elements that go into the discussion of total taxation that include income tax, various sales taxes, car registration fees, use fees, transfer taxes, etc., this article just focuses on one element and is therefore not a comprehensive picture. It doesn’t fairly compare apples to apples across states. However, I think it’s an interesting and relevant topic because it comes up often in my discussions when I am showing property.
Corelogic recently did a study ranking the median property tax rate across the country. The highest property tax percentage is in Illinois where taxes are 2.67% of the assessed valuation and lowest in Hawaii where the property tax burden is just .31%. Colorado is ranked 5th from the bottom with .66%, meaning that we have the 5th lowest property tax burden in the United States. Despite the arguments* that there are too many elements not included in this study I think in general it’s true that the cost of ownership in places like Illinois, New York, New Jersey are much higher than they are in Colorado. In Colorado the “T” portion of our payments is much lower than other states and therefore, all things being equal, we can afford more expensive homes with the same payment.
Local Property Tax Comparison
Now let’s get more granular. Within my market area buyers need to look closely at property tax rates within the different localities. Here is a quick comparison of homes currently on the market. I have tried to choose homes that are similar in price and similar in assessed value.
- Boulder – 4616 Talbot Dr. | List Price $574,000 | Assessed Value $423,900 | 2015 Taxes $2,766 | Tax/Assessed .648%
- Louisville – 453 Centennial | List Price $599,900 | Assessed Value $450,200 | 2015 Taxes $2,988 | Tax/Assessed .664%
- Lafayette – 369 Caribou Pass | List price $580,000 | Assessed Value $464,300 | 2015 Taxes $3,180 | Tax/Assessed .685%
- Longmont – 5712 Clover Basin | List Price $575,000 | Assessed Value $409,700 | 2015 Taxes $2,971 | Tax/Assessed .725%
- Superior – 3103 Castle Peak | List Price $599,900 | Assessed Value $464,100 | 2015 Taxes $3,881 | Tax/Assessed .836%
- Erie – 1276 Greening | List Price $560,000 | Assessed Value $399,950 | 2015 Taxes $3,483 | Tax/Assessed .871%
- Broomfield – 4630 Nelson | List Price $569,000 | Assessed Value $466,710 | 2015 Taxes $4,490 | Tax/Assessed .962%
The order listed is ranks the local communities for property tax burden as a percentage of the assessed value of the property. Boulder has the lowest tax rates and Superior, Erie and Broomfield have the highest. If a buyer were to be comparing homes in Boulder and Broomfield, the taxes make a difference. The differential in the monthly payment is around $100 per month, definitely worth looking at.
*Some of the arguments that invalidate this report are: a) Different states base taxes on different amounts. Assessed value vs. actual value. b) Some states give a homestead exemption. c) Some states assessed value doesn’t change until a sale and then it goes to the purchase price. d) The report doesn’t take into account special assessments or the prevalence thereof within states.

 Inventory is low compared to past years and this has definitely been a cause for the lower activity. When buyers don’t have many houses to see the chances that they find one to buy goes down. This next chart shows the flow of new listings to the Boulder County market (all price ranges and types) on a weekly basis. It appears that new listings peaked back at the end of May and if we follow the trend will be decreasing for the rest of the year.
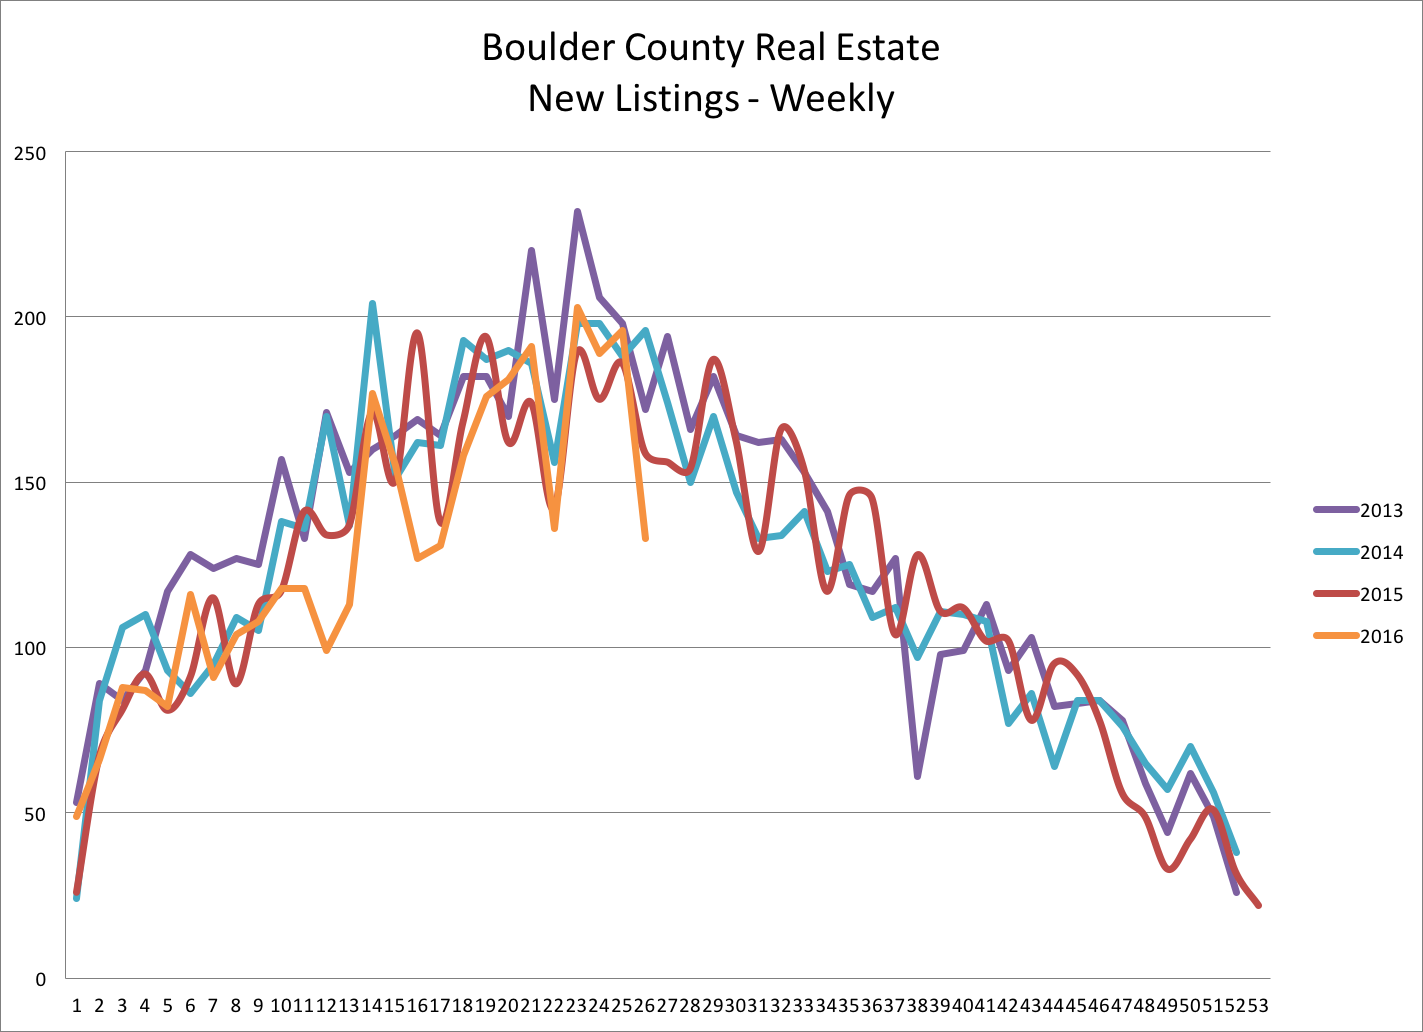
 So far everything makes sense. This is where it gets a bit fuzzy. I track the number houses that go under contract each week in Boulder County. From the graph below it appears that sales are still brisk. This shows equal or more contracts even while there were fewer showings. Obviously there are still buyers out there and finally with less competition they can jump on a property and get their offer accepted. It’s been all too common these past few years for buyers to look around a quite a few houses, find the right one, get beat out in a multiple offer situation and then be forced to start anew. Wash, rinse, repeat! This cycle pumps up showings. In the old days, a new listing comes on the market, buyer sees the listing, buyer likes the listing and then buyer buys the listing. Maybe we are getting back to that. Refreshing!
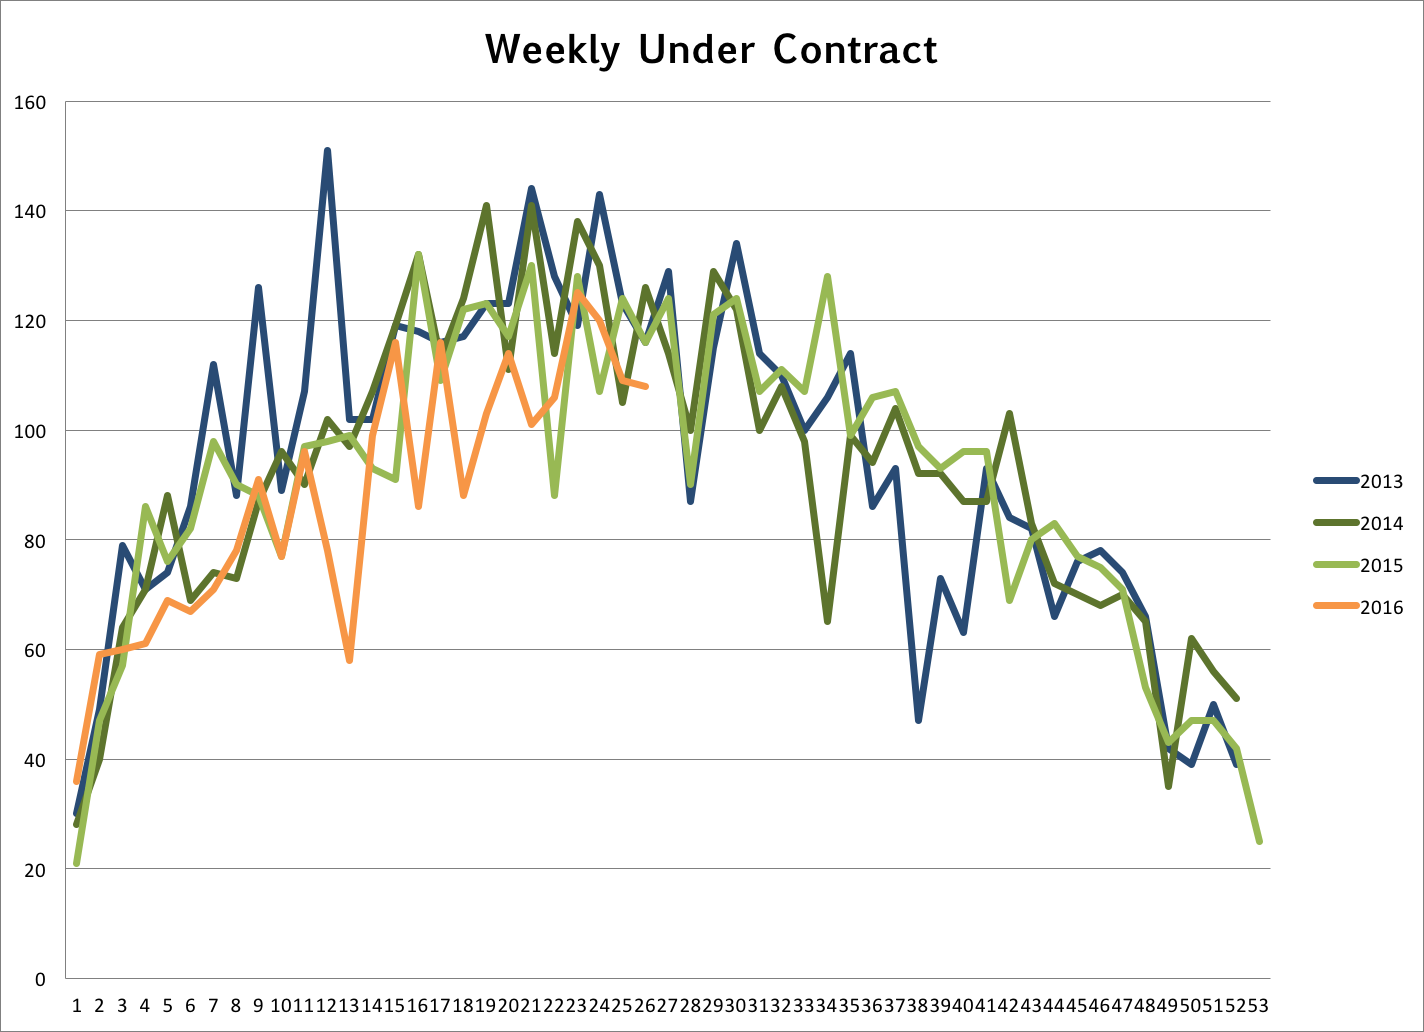
 Given the information below it seems that the market has slowed but it seems more like a vacation than something more permanent. If you need to sell your house this summer you may need to lower the price. If we are patient, we will most likely feel the pressure rise when the buyers are back in town.