The market is choppy. Some listings are selling quickly and with multiple offers. However, this is happening less than the past three years and it is common to just have two offers rather than a handful. Other listings are sitting on the market longer or are needing to reduce the price in order to attract buyers. The inventory is higher than the past few years which gives buyers more homes to look. Correct pricing is a must for sellers serious about attracting buyers in that critical first two week period. Recent activity is strong which is a good sign as we enter the typical busiest month of the year in our market.
Here are a few key slides from the full slideshow below.
As more homes stay on the market for a longer time. Sellers need to compete by lowering the price. Sofarthisyearweareseeingquiteajumpinpricereductionsthroughout the market.
At the end of March 43% of of listed properties were already under contract. This graph shows the number of active homes on the market that weren’t already spoken for. The pool of showable listings is higher than at any point during the last five years.
There has been a lot of press lately reporting that the market has shifted. Prices are flattening, inventory is rising, sales are falling. During February, sales were down 4.3% from the previous year. This however was an improvement in the trend of double digit declines that we saw during the fourth quarter. We are seeing houses stay on the market a bit longer and also more price reductions. Inventory is also higher than it was in 2018 with more new listings coming online and fewer sales.
In my recent experience, I have seen some really good houses get multiple offers and some good homes sit on the market for quite awhile. Buyers are picky and it is really hard to tell which homes are going to go fast and those that will sit.
March will be an important month. Will we see a continuation of the improvement in the recent trend that we saw in February or will we see another dip? If you look at slide #6 in the slideshow below you see that the contracts accepted during the first two months in March are lagging behind. Enjoy the slideshow and please let me know if you have any questions or comments.
Sales in January picked up where the fourth quarter left off. Sales for the month were down 17%. This isn’t too surprising since most of January’s closings came as a result of contracts written in December and the market was definitely slow in December.
During January the number of listings that are went under contract on a weekly basis (see slide #5 not including the title slide) definitely picked up but are still below previous years. Interest rates seem to have stabilized for the moment below 5% and the stock market is rebounding, both of which will help buyers as they consider buying a home.
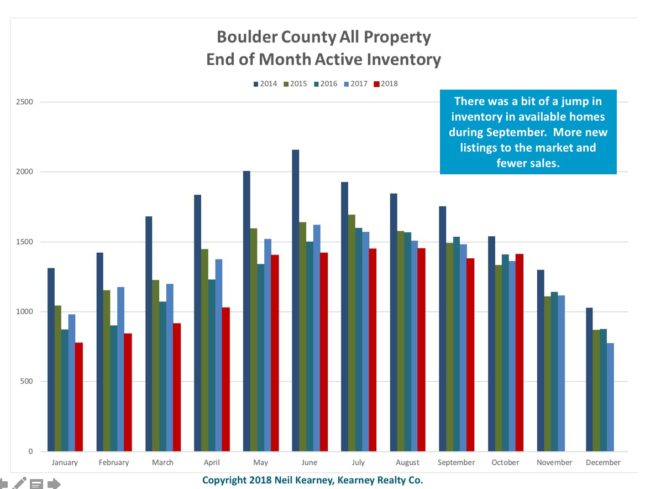
The fall real estate market seems to be slowing down more than expected rather than gaining momentum for 2019. Sales were down over 9% in November and are down 3.5% for the year. The signs that point me to a larger slowdown (not just seasonal) are; increasing inventory, lowest under contract percentage in five years and more obviously slower recent sales.
This graph shows the sales in Boulder County by month.The red line shows the under contract percentage which is at it’s lowest point in at least five years.
We will need to wait until January and February to see if a real shift has occurred in the market. This is when we start to see new buyers come out and deplete the existing inventory. Stay tuned and Happy Holidays!
The embedded report below has more analysis and graphs.
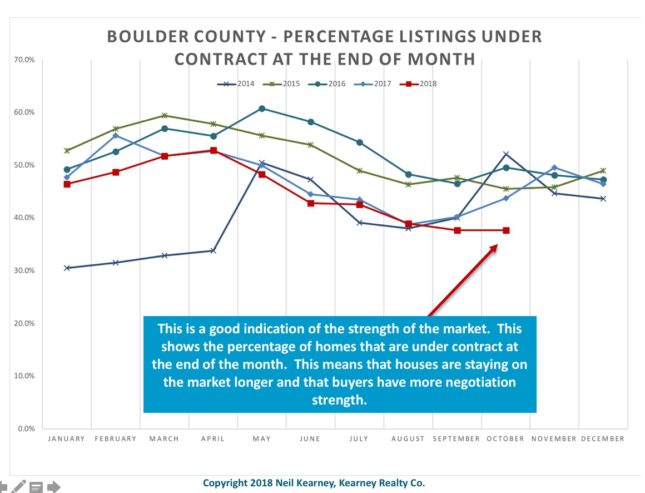
This month we are seeing a few statistics break from the pattern we have seen during the past four plus years. Sales were down by 3.4% for the month but that isn’t the story. Actually year-to-date sales are just down 2.4%. This month for the first time we saw the percentage of under contract properties (compared to all listed properties) fall to 37% which is the lowest number we have seen in over 4 years. What this means is that listed homes are staying on the market longer, fewer are selling and buyers have more choice.
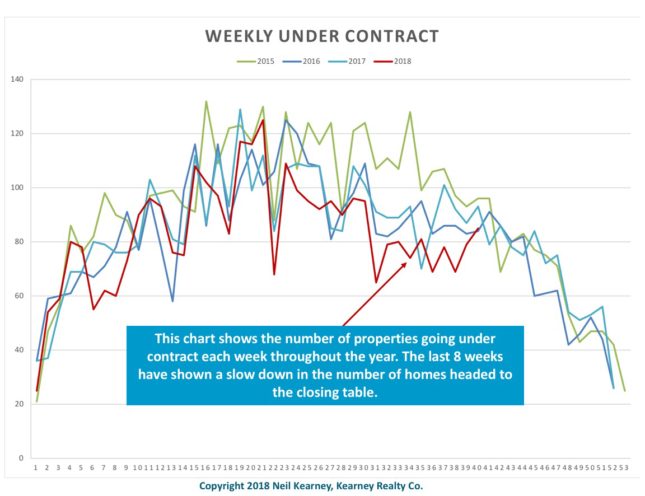
This isn’t a big change but a continuation of a trend that we have been seeing since this statistic peaked in April of this year with over 50% of the market already under contract. Another statistic that shows that our market might be slowing is the number of properties that go under contract in Boulder County on a weekly basis. Over the past twelve weeks the weekly contracts have noticeably lagged the previous years shown. Take these in conjunction with a bump in inventory and it points to a slower market.