by neil kearney | Apr 15, 2009 | For Buyers, Real Estate 101
 Boulder County is located in a zone of high potential for elevated radon levels in the air. In real estate transactions radon almost is always an issue. It is almost always tested for and when the reading comes in at a level above 4.0 pCi/L (picocuries per liter) then the Buyer and Seller negotiate what will be done and who will pay. But first some background that can be found EPA’s Radon Website
What is Radon?
Radon is a gaseous radioactive element having the symbol Rn, the atomic number 86, an atomic weight of 222, a melting point of -71ºC, a boiling point of -62ºC, and (depending on the source, there are between 20 and 25 isotopes of radon – 20 cited in the chemical summary, 25 listed in the table of isotopes); it is an extremely toxic, colorless gas; it can be condensed to a transparent liquid and to an opaque, glowing solid; it is derived from the radioactive decay of radium and is used in cancer treatment, as a tracer in leak detection, and in radiography. (From the word radium, the substance from which it is derived.) Sources: Condensed Chemical Dictionary, and Handbook of Chemistry and Physics, 69th ed., CRC Press, Boca Raton, FL, 1988.
No immediate symptoms. Based on an updated Assessment of Risk for Radon in Homes, radon in indoor air is estimated to cause about 21,000 lung cancer deaths each year in the United States. Smokers are at higher risk of developing Radon-induced lung cancer. Lung cancer is the only health effect which has been definitively linked with radon exposure. Lung cancer would usually occur years (5-25) after exposure. There is no evidence that other respiratory diseases, such as asthma, are caused by radon exposure and there is no evidence that children are at any greater risk of radon induced lung cancer than adults.
Based on a national residential radon survey completed in 1991, the average indoor radon level is about 1.3 picocuries per liter (pCi/L) in the United States. The average outdoor level is about 0.4 pCi/L.
So, you can see why it comes up often in a real estate transaction. Of course some people are more worried than others and this becomes part of the art of negotiation. During the inspection period (which is usually between 10 days and 2 weeks long) a buyer has the option to have a radon test performed usually by a general home inspector. The cost is somewhere around $100 for the test and it takes 48 hours to perform. If the results of the test come in above 4.0 pCi/L then it is very common for the Buyer to ask for the Seller to mitigate so that the radon level inside the habitable part of the home (not crawlspaces etc.) is below 4.0 pCi/L. The cost for mitigation can vary but in our area the typical cost is between $800 and $900.
What is done to mitigate the radon level in a home?
Most often a 4″ PVC pipe is inserted into a drilled hole in the basement slab. This pipe is routed to the outside of the home and above the roof line. Somewhere along the pipe a fan is installed that will run continuously and will suck the sub-slab air to the outside creating a vacuum. The diverted air stream does not allow radon to seep up through the concrete into the house.
Radon is a fixable problem and it is a good idea to have the test done. I tell my clients that even if they are not concerned about the risk, most likely the people who buy the house from them will be.

by neil kearney | Apr 2, 2009 | Boulder County Housing Trends, For Buyers, Real Estate 101
Interest rates are near historical lows and in many cases buyers are locking in rates that start with a 4. This is unheard of and represents one of the great buying opportunities in modern times. I just received a quote today for a 30 year conventional loan (below $417,000) with no discount points for 4.875%. This rate assumes at least a 10% down payment and a FICO score of at least 740. 
I remember my first sale back in 1992, the interest rate was 8% and everyone at that time was saying that it was a pretty good rate, not the best, but reasonable. During the last decade we have become spoiled. Rates have been mostly in the 6 – 7% range with a few quick dips into the 5’s.
Now I hear people wondering if they should wait for rates to drop further, maybe to 4%. Hello, how much further do you want them to go? I guess it is human nature to get greedy when you start taking something for granted. But I say wake up and lock-in right now! 4.875% could turn into 6% in a flash and then where would you be? I have always been pretty conservative with my planning and when I am ready to purchase or refinance I plan using today’s rates and lock-in today’s rates. Call me crazy but I don’t think you should gamble on something that can change your payment every month by a significant amount. Here is a continuum of principle and interest payments at different interest rates. This assumes a $400,000 loan.
- 4.875% = $2,116.83
- 5% = $2,147.29 ($1 a day savings)
- 5.25% = $2,208.81 ($1,103 saved a year)
- 5.5% = $2,271.16 ($1,851.96 saved per year)
- 5.75% = $2,334.29 ($2,609.52 saved per year, a nice vacation?)
- 6% = $2,398.20 ($3,376.44 saved per year, that is $16,882 over 5 years and $101,293 over 30 years.
The point is, that interest rates are fantastic! If you are happy with your house, you should look into refinancing. If you might consider a move during the next few years, think about it now. That new house will never be more affordable. Good decisions now will pay off for years to come.
by neil kearney | Apr 1, 2009 | For Buyers, Real Estate 101
The discussion of lead based paint comes up in every transaction that involves a house built before 1978. All sellers and landlords are required to disclose in writing the knowledge of any lead based paint hazards and provide results of any previous tests that they may have to any potential buyers or tenants. 
Lead based paint has been linked to health difficulties primarily in children but can also be hazardous to adults. Most older houses have lead paint somewhere under the layers of paint in the house. So what is the hazard? If the lead paint is contained it is not an immediate hazard. Only when the paint is released by chipping, sanding etc. does it become a hazard. Once released, it can be in the air, contained in dust or it can be in exterior soil.
In a real estate transaction a Lead Based Paint Disclosure must be filled out and signed by the Seller, Buyer and both real estate agents. This disclosure must be signed before or concurrently with the purchase agreement. If it is done after the fact, heavy fines can be placed on the Realtors. Along with the disclosure, a booklet explaining the hazards must be received by the buyer.
The buyer has the right to have the house inspected for lead based paint hazards, but in my experience I have never seen a buyer have the tests performed. The testing is expensive and can be invasive (samples). I think the object of the program set forth by HUD is education of the public and at least in the the properties I have been involved in, I think that goal is being fulfilled.
The EPA has a very informative websitewhich has more information if you are interested in learning more.
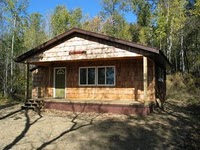
The cabin shown above is still standing, although I’m sure it is a lead based paint hazard. It is my grandfathers old cabin in MN near Itasca State Park. He passed away just over 10 years ago and my cousin and I have since built the new cabin below on a different location on the land overlooking Gill Lake.  {I have recently converted my blog to a new squarspace platform. During the conversion all of my old posts made the journey but the functionality of the search has not come through cleanly. This is a previously published post that contains information that is still a good resource so I will periodically re-publish a few select topics so that they are searchable on the site.}
by neil kearney | Mar 28, 2009 | For Buyers, Real Estate 101
In order to close on the purchase of a home, a buyer must obtain a homeowners insurance policy. A few years ago a property insurance deadline was added to the buy/sell contract. This clause gives the buyer the right to shop around and make sure that an acceptable and reasonable homeowners policy is available for the house they are purchasing. This contingency came about after some insurers, after a particularly dry and fire laden summer, decided to add outrageous premiums to mountain homes. Many buyers were waiting until the last minute to line up their insurance and found it was too late to cancel the contract after they found out what it would cost. The situation has settled down now but the deadline and contingency is still in place. Here is a video that gives some good tips for those who are looking for homeowners insurance. It is also a good idea to shop around every few years to make sure you are not paying too much. Please let me know if you need a recommendation of a local insurance agent, I know some good ones.
http://www.howcast.com/flash/howcast_player.swf?file=164288
by neil kearney | Mar 11, 2009 | For Buyers
Right now there seems to be many reasons why prospective home buyers are not buying. But the fact is, despite all of the excuses, people are still buying homes. According to the National Association of Realtors in their 2008 Profile of Home Buyers and Sellers, here are the reasons why buyers buy real estate.
- Desire to own a home – 34%

- Job related relocation or move – 11%
- Desire for a larger home – 10%
- Change in family situation – 9%
- Desire to be closer to family/friends/relatives – 6%
- Desire for a home in a better area – 5%
- Desire to be closer to job/school/transit – 4%
- Affordability of homes – 3%
- Desire for a smaller home – 3%
- Retirement – 3%
- Desire for a newly built or custom built home – 2%
- Establish a household – 1%
- Financial security – 1%
- Tax benefits – 1%
- Greater choice of homes on the market – 1%
- Desire for a vacation/investment home – 1%
- Purchased home for family member – 1%
- Other – 4%
I can break these down into three main categories: moves caused by change (25%), moves initiated by a desire (65%) and those who purchase because of a outside reason or as a result of logical analysis (6%).
The 25% who move beacuse of job or family changes move in any market, including now.
The 6% who see market opportunities are looking now.
The 65% of buyers who don’t ‘have’ to buy, but ‘choose’ to buy are a very sensitive group. Many of these people want to buy but are hesitant for any number of reasons. People can live with a house that is either too large or too small for quite some time before they feel compelled to act. Locally we have many people in this category. Our inventory has fallen as many people have chosen to wait until a better time. Now is a great time. Interest rates are low – Sellers are ready to sell and prices are steady to rising.


