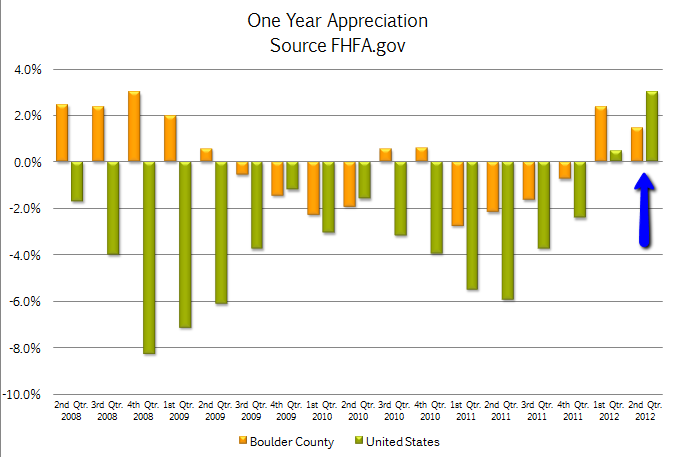
During the second quarter of 2012 sales of residential homes were 31% greater than the same quarter in 2011. There were many instances where I personally saw homes that sold for more money than they would have a year ago. However, the numbers don’t lie and FHFA.gov’s Home Price Index for the second quarter shows Boulder County with a .01% loss (let’s call it break even). For the four quarters ending June 30th the index shows that our appreciation was 1.47%. Respectable and in the right direction.
The United States as a whole showed a great improvement, with a 1.8% rise for the quarter and a positive 3.03% for the year. Here is a graphical comparison showing Boulder County and the US average on a quarterly basis.
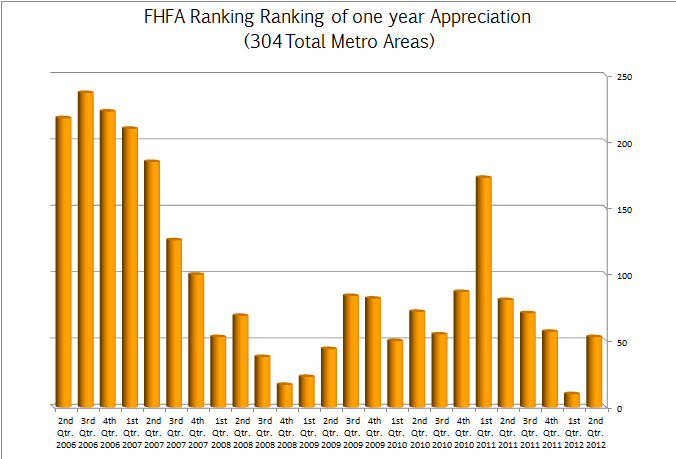
Boulder County’s appreciation of 1.47% ranks us 53rd best of the 304 markets that are tracked. Here is our ranking over time.
Curious about the extremes in the market? Of course you are.
Here are the top 10 markets for home appreciation over the past year. Five year cumulative returns in parentheses.
- Phoenix, AZ 5.98% (-46.43%)
- Boise City, ID 5.88% (-36.08%)
- Columbus, IN 5.05% (3.38%)
- Bismarck, ND 5.02% (15.48%)
- Huntington/Ashland, OH, WV, KY 4.46% (8.22%)
- Johnson City, TN 4.37% (1.36%)
- Lake Havasu City, AZ 4.34% (-41.76%)
- Houston, TX 4.14% (5.82%)
- Cape Coral/ Ft. Myers, FL 4.03 (-47.29%)
- Joplin, MO 3.91% (-1.08%)
It is interesting that 4 of the 10 top appreciation markets are “bounce back” markets. By that, I mean that they are markets that have suffered greatly in the housing bubble and now they are rebounding off their lows. Houses are cheap in comparison to where they were five years ago.
And for the markets that are still in the doldrums. Here are the bottom 10 (#1 being the worst).
- Port St. Lucie, FL -7.46% (-51.12%)
- Tacoma, WA -6.44% (-31.64%)
- Kankakee/Bradley, IL -5.70% (-13.79%)
- Tallahassee, FL -5.55% (-28.96%)
- Chico, CA -5.52% (-35.13%)
- Santa Fe, NM -5.48% (-20.69%)
- Mobile, AL -5.30% (-15.94)
- Poughkeepsie, NY -5.16% (-24.89%)
- Myrtle Beach, SC -5.03% (-30.52%)
- Atlantic City, NJ -4.98% (-26.16%)
What is interesting here is that 8 of the worst performing markets are down over 20% over the past five years. These areas have not yet participated in a housing recovery.
For comparison appreciation in Boulder County over the past 5 years is .07%. We are almost exactly where we were a half a decade ago. We are heading in the right direction in terms of market activity but now we are due for some price appreciation.


