Overview
As I look back on 2022, I can still recall that sinking feeling in my stomach I had last spring as I was trying to help my clients create a winning bid. How much should they offer? How do we waive the appraisal? With so many offers already submitted, is it even worth putting in an offer? I had to answer these questions the best that I could, but I was full of humility after writing so many offers that were very aggressive… but not quite aggressive enough. It was crazy and instead of driving the train (so to speak) in a responsible manner, it felt like we were all holding on just to hang on to the caboose.
Last year was a tale of two markets. The exuberant first half of the year, a frenzied market fueled by still low, but rising interest rates and the slow market characterized by low inventory, high interest rates and a bunch of buyers who looked like they just went through the spin cycle at the laundromat. And the second half of the year where the market shifted quickly with the drastic rise of interest rates. I’ll try to make some sense of it by comparing the first half with the second half and then give some context by summarizing the year as a whole.
Part 1: When Enough Wasn’t Nearly Enough
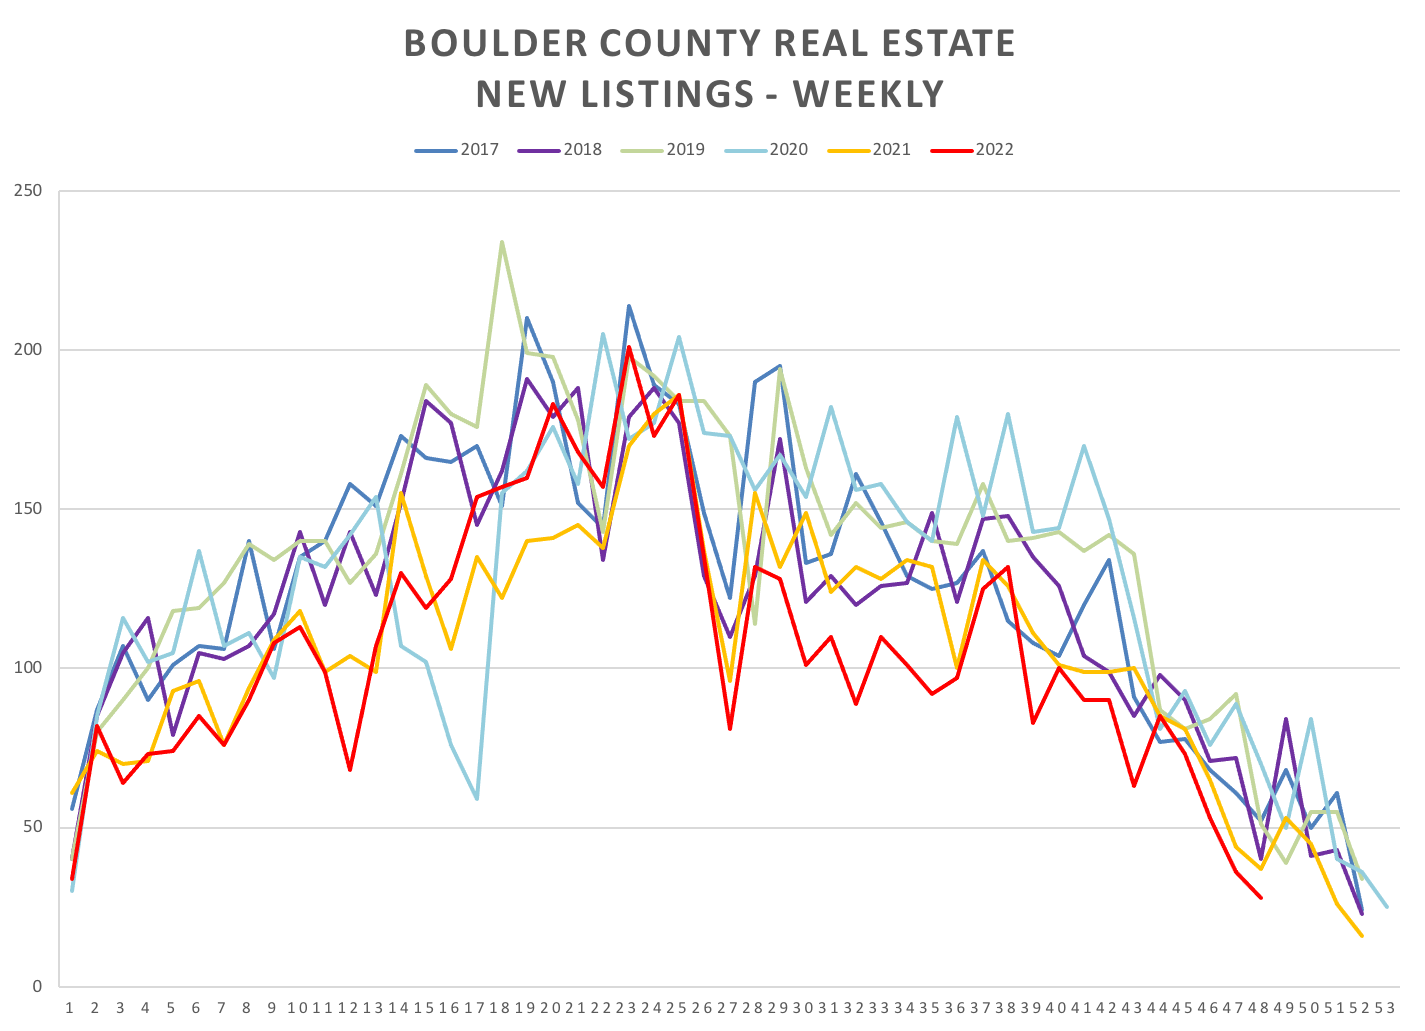
We started the year with the Marshall Fire. What a sad event for our community. Over a thousand families were suddenly, unexpectedly, scrambling for housing. Some of those displaced quickly became highly motivated buyers. These buyers joined a large group of buyers already waiting for the new listings, quickly became an unsatiable home buying force. Soon after the listing agent would click the “active” button on the MLS buyers would start swarming. By the third week in January buyers of all kinds were already out in force and the market was already falling behind in the number of new listings hitting the market. It was tight and getting tighter. Sellers were happy.
All through February, March, and April the market gained momentum and buyers were learning that full price wasn’t going to win the day, not even close! In April, 76% of all sales went for above the list price and to win one of those bidding wars it took an average of 11% above the list price. The average sale in Boulder County in April was $1,086,000, so the average winning bid was somewhere around $119,000 above the list price. Half of the winning bids were higher. Sellers were pinching themselves!
Buyers have been enjoying low interest rates for the quite some time. Low-cost borrowing had kept homes affordable even as prices increased. At the beginning of 2022 30-year fixed mortgage rates stood at 3.1%. But just as the jet fuel of multiple offers was affecting affordability, interest rates began to rise. By the end of April rates were almost at 5% and payments were rising quickly. Buyers were panicking, desperate to get into a house before it got worse. It was still getting worse. At the end of October interest rates topped off at 7.08%. Along with buyers, the mortgage industry had whiplash and by the end of the year was laying off staff. But I’m getting ahead of myself.
Despite the frenetic pace of the spring, sales were down 16% through June. However, sales prices were up 15.4% or $100,000 in Boulder County from the first six months of 2021. Average Days-To-Offer were down 1/3 to 15 days. And that included at least 7 days of “coming soon” and “wait for offers” time. Many buyers had written over 10 unsuccessful offers before getting lucky or giving up. Realtors were exhausted, jumpy. Sellers were grateful.
Part 2: The Changing of the Winds
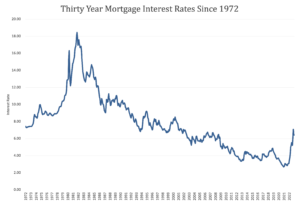
30 Year Mortgage Rates by month since 1971.
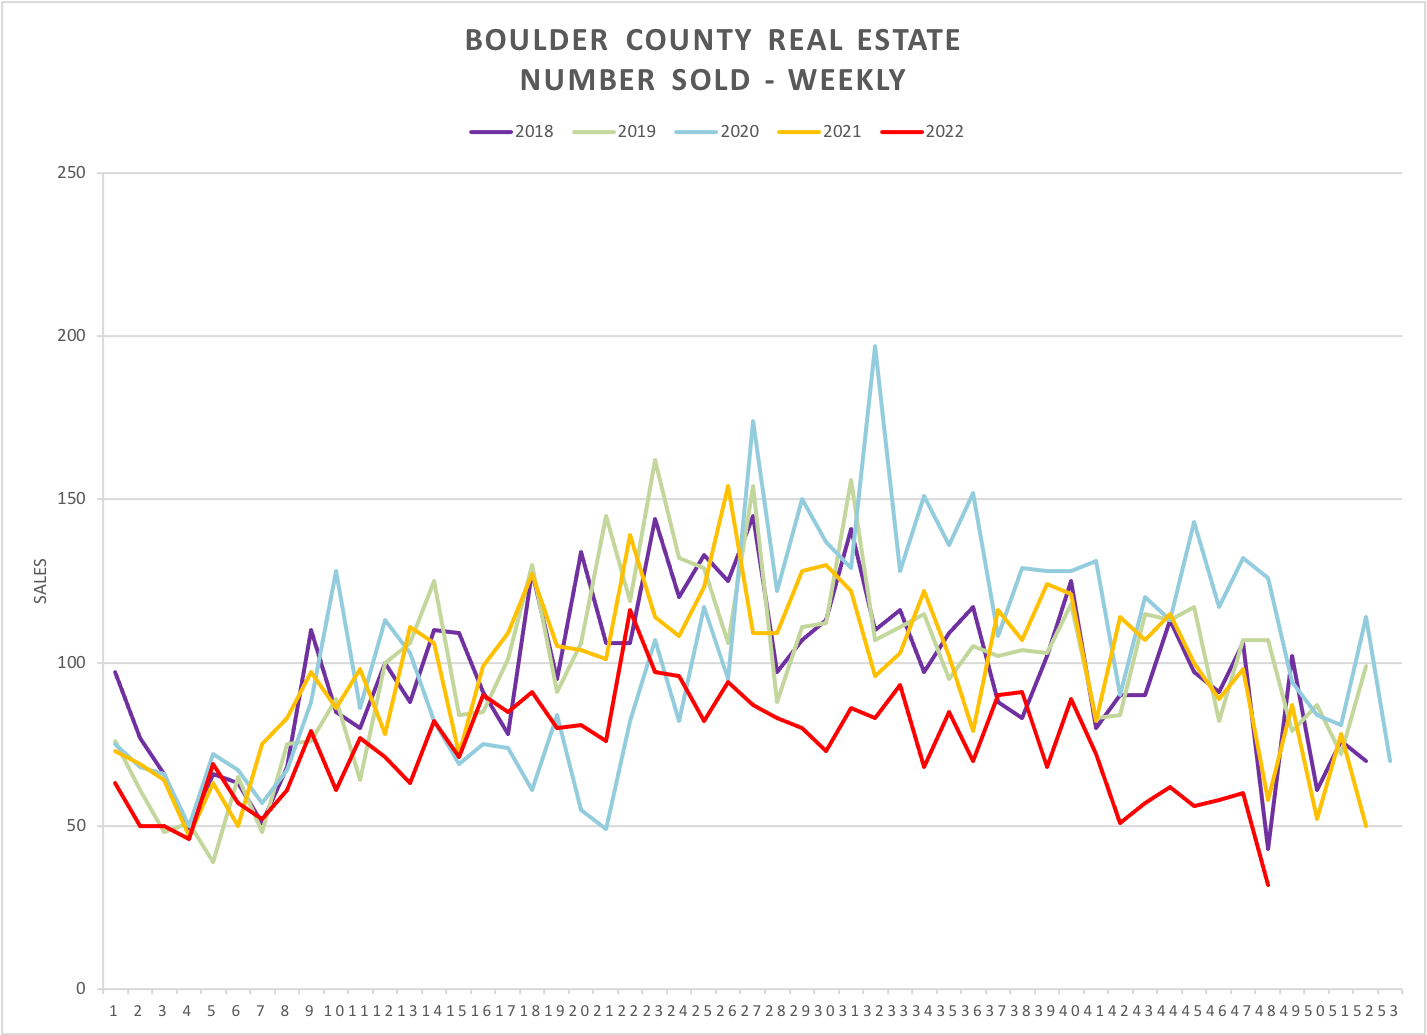
In retrospect, it is now clear that April was the peak month in terms of multiple bid statistics and overall market frenzy. But the hot market continued, though to a lesser degree through May, June and into July. By June, potential sellers were rushing to get their homes on the market, some were rewarded, and some kicked themselves about being a few months late to the party. By July, the storm (metaphorical) had passed and the market was slowing down quickly. Motivated buyers who hadn’t been able to compete earlier in the year were still out there, but many new would-be buyers were priced out of the market. In July sales were down 36% compared to the same month in 2021.
As the summer concluded and fall began, we saw interest rates continue to climb, the number of sales continue to fall, and negotiations shift to favor the buyer. The market had shifted.
Here are a few numbers to illustrate the change:
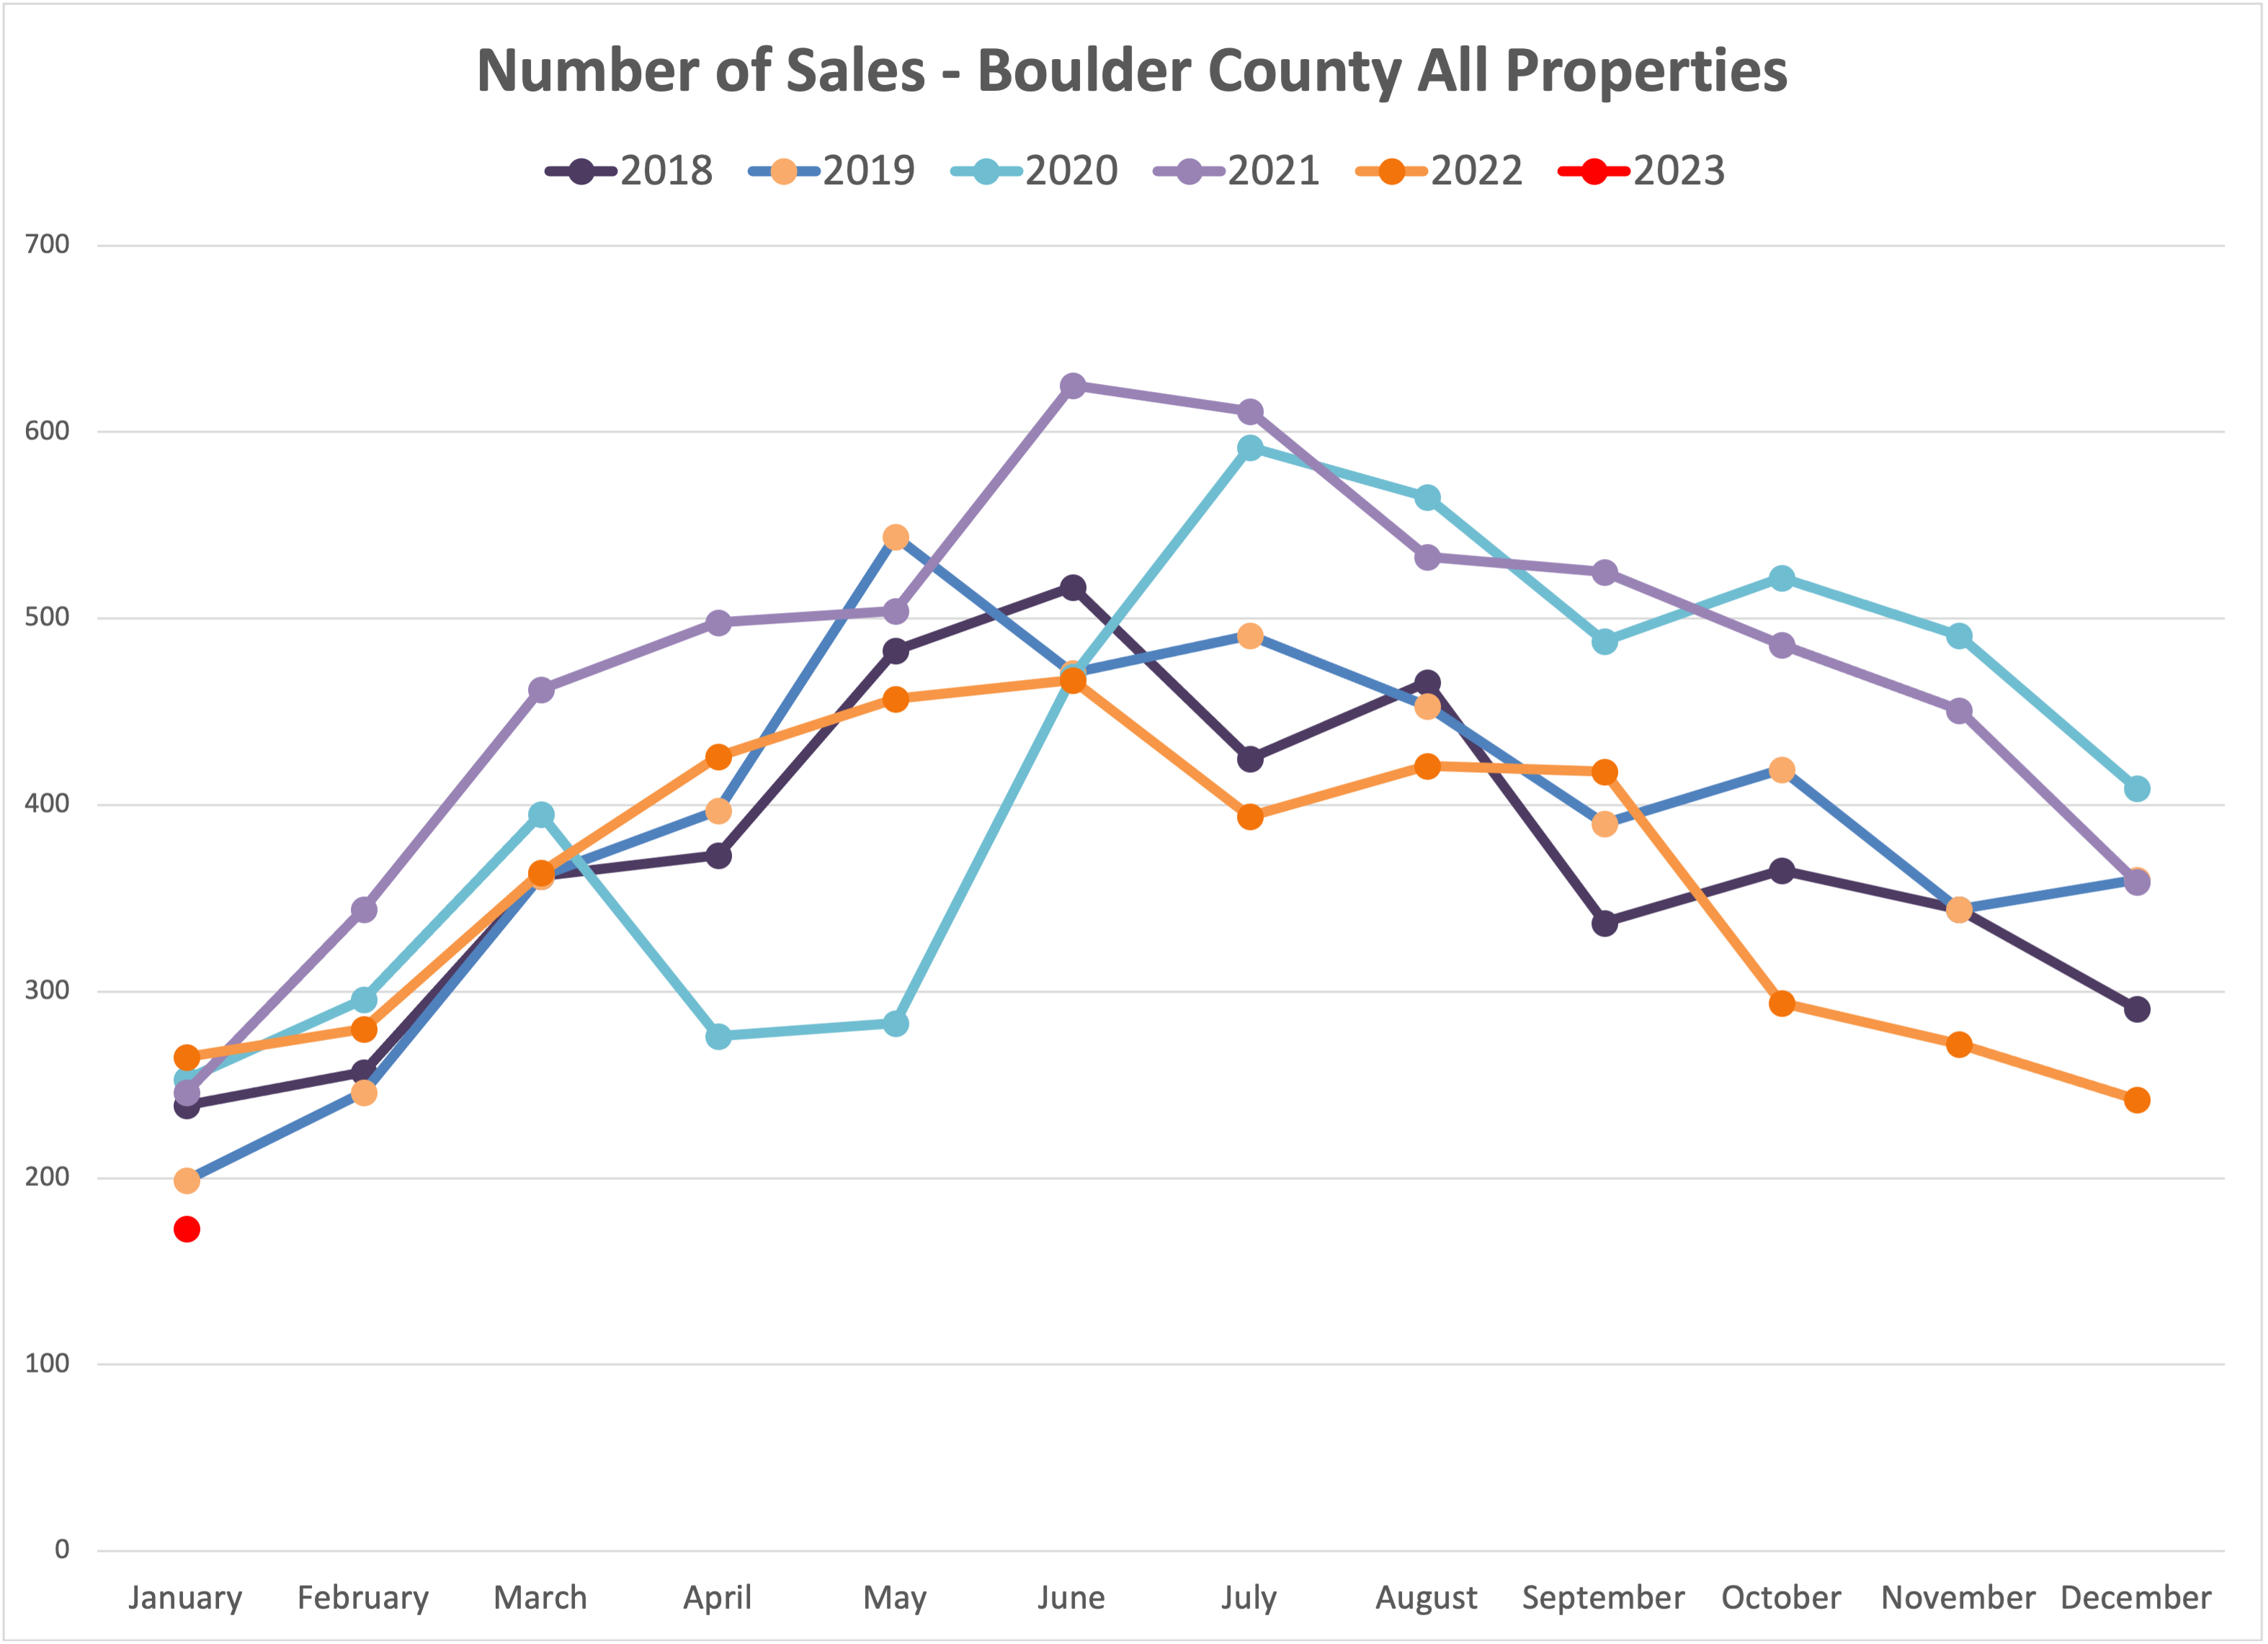
- Monthly sales difference compared to the same month in 2021 – June -25.3%, July -35.5%, August -21%, September -20.4%, October -39.5%, November -39.7%, December -32.6%.
- Sales price to list price ratio (what did a property sell for compared to the list price): April +7.2%, May +5.5%, June +1.9%, July -.7%, August -1.4%, September -1.3%, October -3.12%, November -3.18%, December -3.22%.
Part 3: 2022 Year-End Statistics
Even though the year was characterized by two separate halves, it is important and useful to look at it as a whole. Here is a compilation of the statistics for 2022.
- Total sales were down 23.8%.
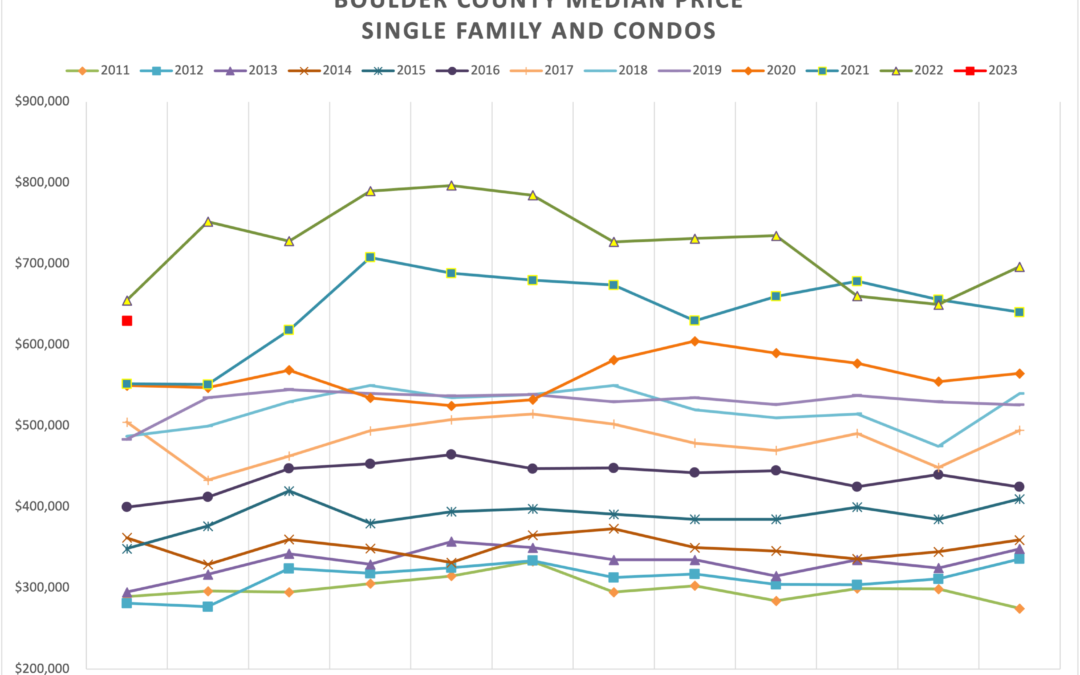
- Median prices increased by 12.2%. Most, if not all the appreciation took place during the first half of the year.
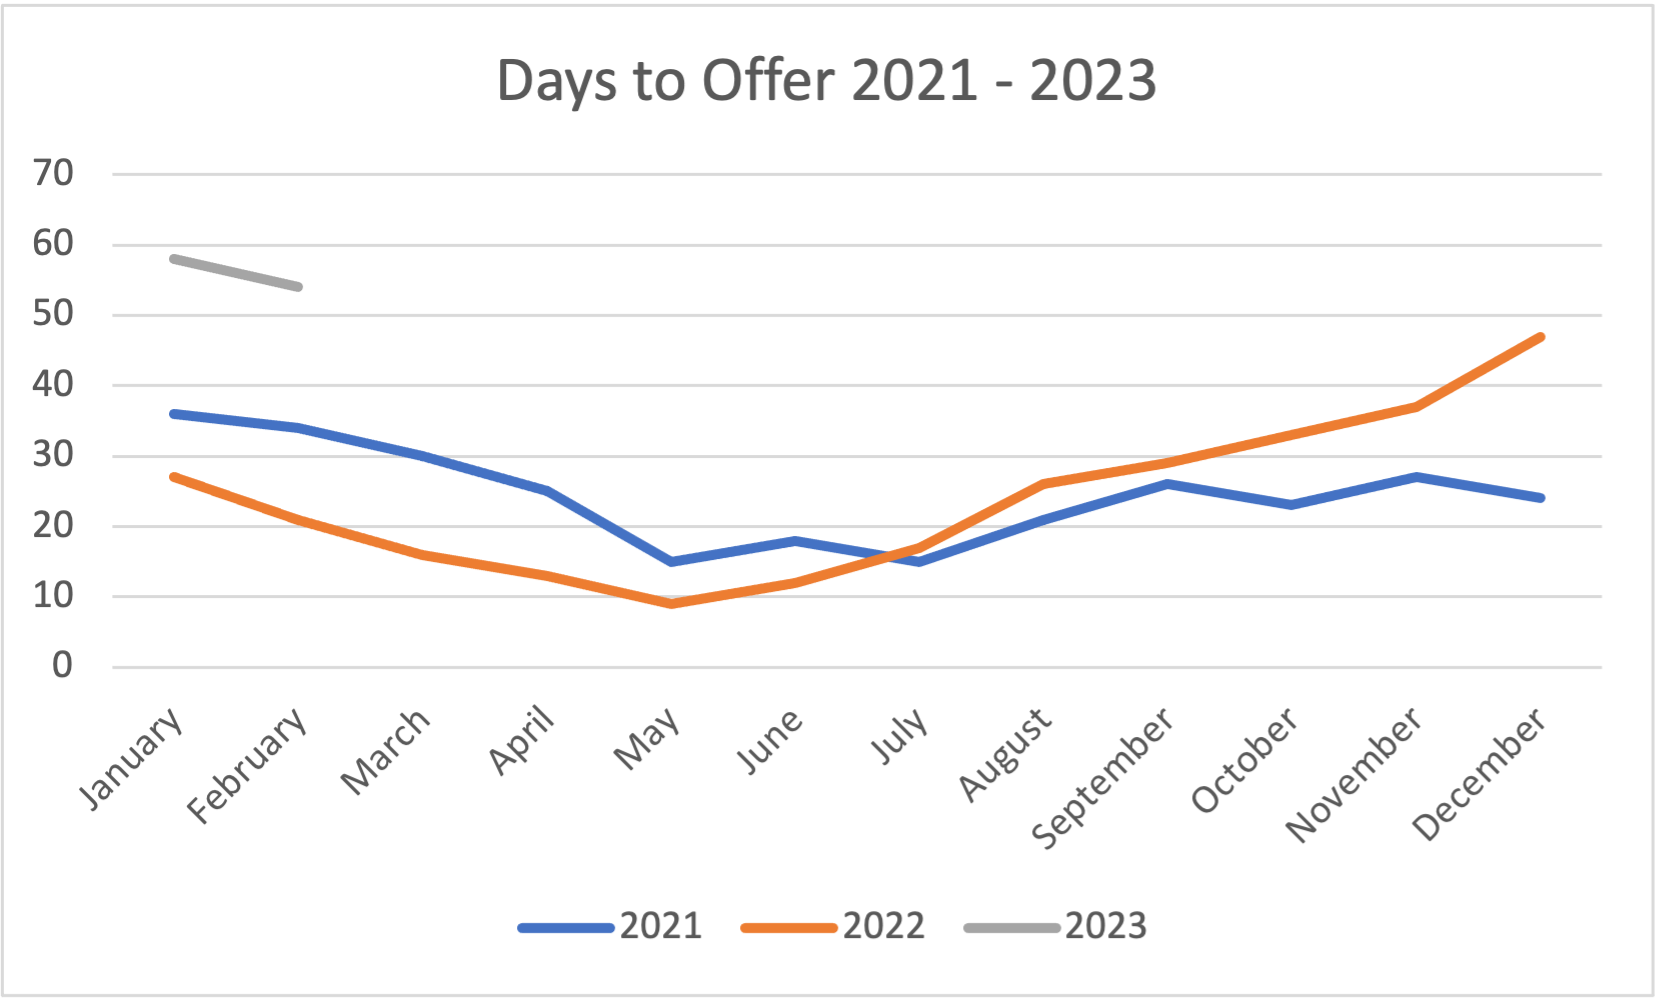
- The average days it took to get an offer on a house decreased by 1 day from 23 days to 22 days. During the first half of the year it was 15 days and the second half of the year it doubled to 30 days.
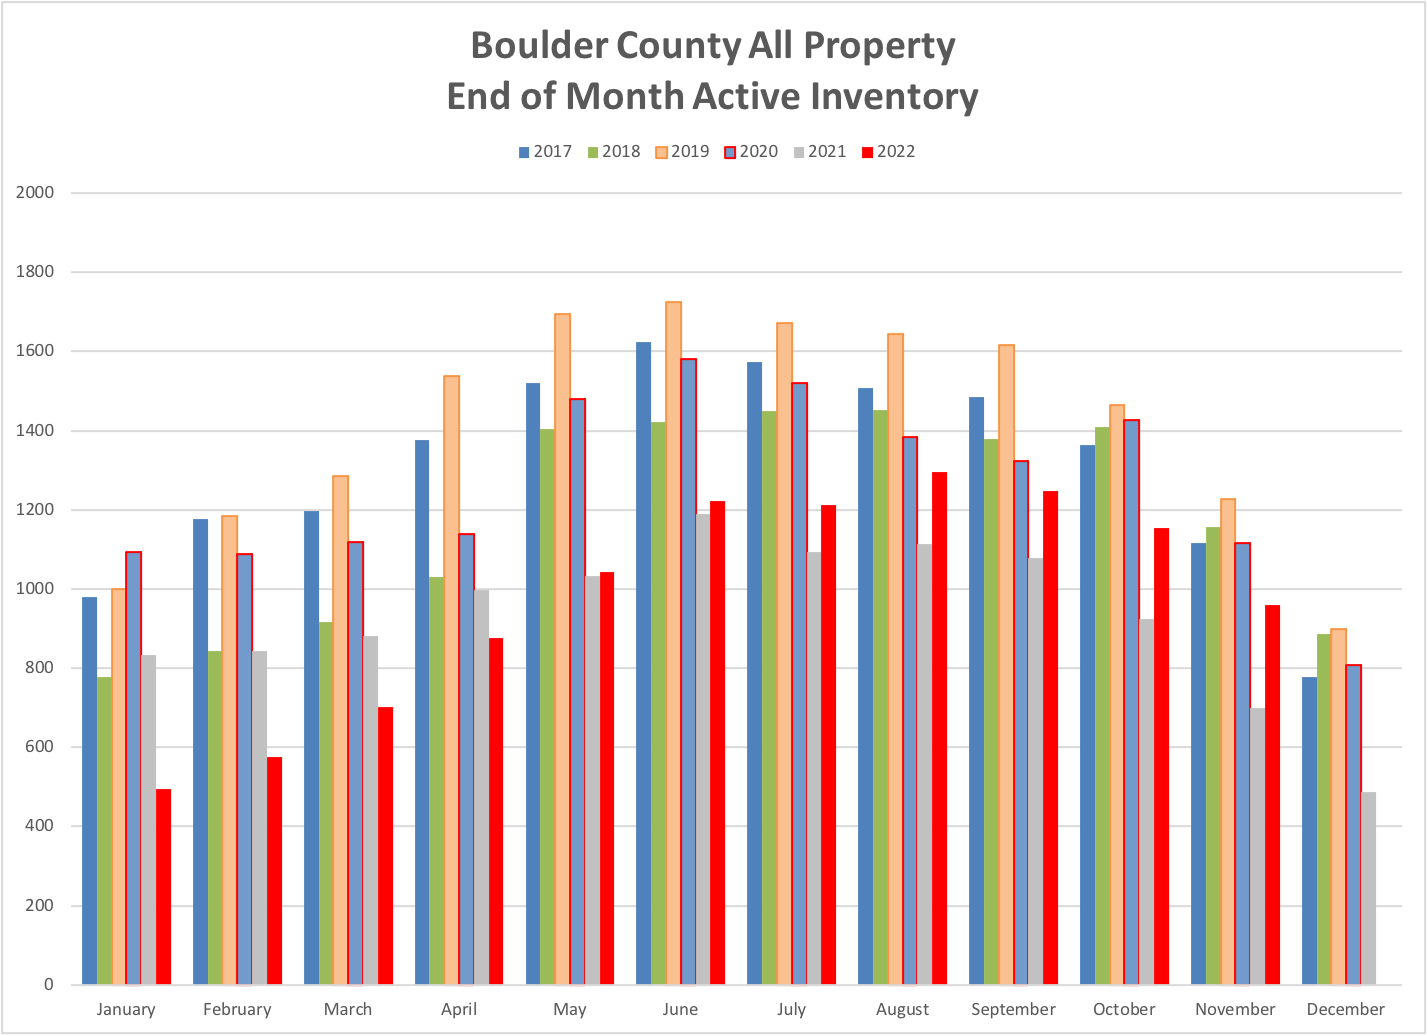
- Inventory remained historically low during the year, but inventory increased consistently after June. At the end of December inventory was up 41% from a year ago. The percentage of active homes that are under contract decreased from 73% in January of 2022 to 35% at the end of December.
Part 4: Looking Ahead, What’s in Store for 2023?
Over the past month predictions for the coming year for the real estate market have been rolling in from all corners of the internet. Predictions have run the gamut from a slight increase to a colossal correction. I can only give insight from what it looks like from my perspective here in Boulder County.
Prediction #1– There are still many reasons why sellers will sell and buyers will buy. Sales will continue and the sky is not falling. A certain number of buyers are adjusting to the new higher rates and have a compelling reason to buy. Life changes and those changes cause sellers to move.
Prediction #2 – I expect the number of sales to continue to contract. Continued high interest rates will cause both buyers and sellers to stay on the sidelines. The spike in interest rates along with the recent price gains combine to hamper the affordability of homes. Many buyers are waiting for either the rates to drop or prices to drop. Most would be sellers are sitting on mortgages with exceptionally low fixed rates. If they were to sell, they would be stepping up to a much higher interest rate. Unless there is a compelling reason to sell, Sellers are staying where they are.
Prediction #3 – Prices are sticky. Sellers are reluctant to reduce prices unless they are in a real pinch to sell quickly. If the supply of homes on the market (inventory) remains balanced with the reduced demand, I don’t see priced decreasing significantly. The only reasons we would see a significant drop in prices is because there are a ton of houses sitting on the market. At this point I don’t see that happening.
In summary, over the last six months we have seen a much-needed balancing in the local real estate market. Inventory is still low but the mix of new buyers and sellers to the market over the next few months will tell us a lot about where the market is heading. Interest rates have already come off their highs and buyers are enjoying the luxury of more time to process decisions and more leverage in negotiations. Sellers at the moment are enjoying the lack of competition that comes from a low inventory environment. As always, I will be be paying attention and keeping you posted. I always love hearing from you, working with you and getting the great compliment of your referrals.
Year End Graphs
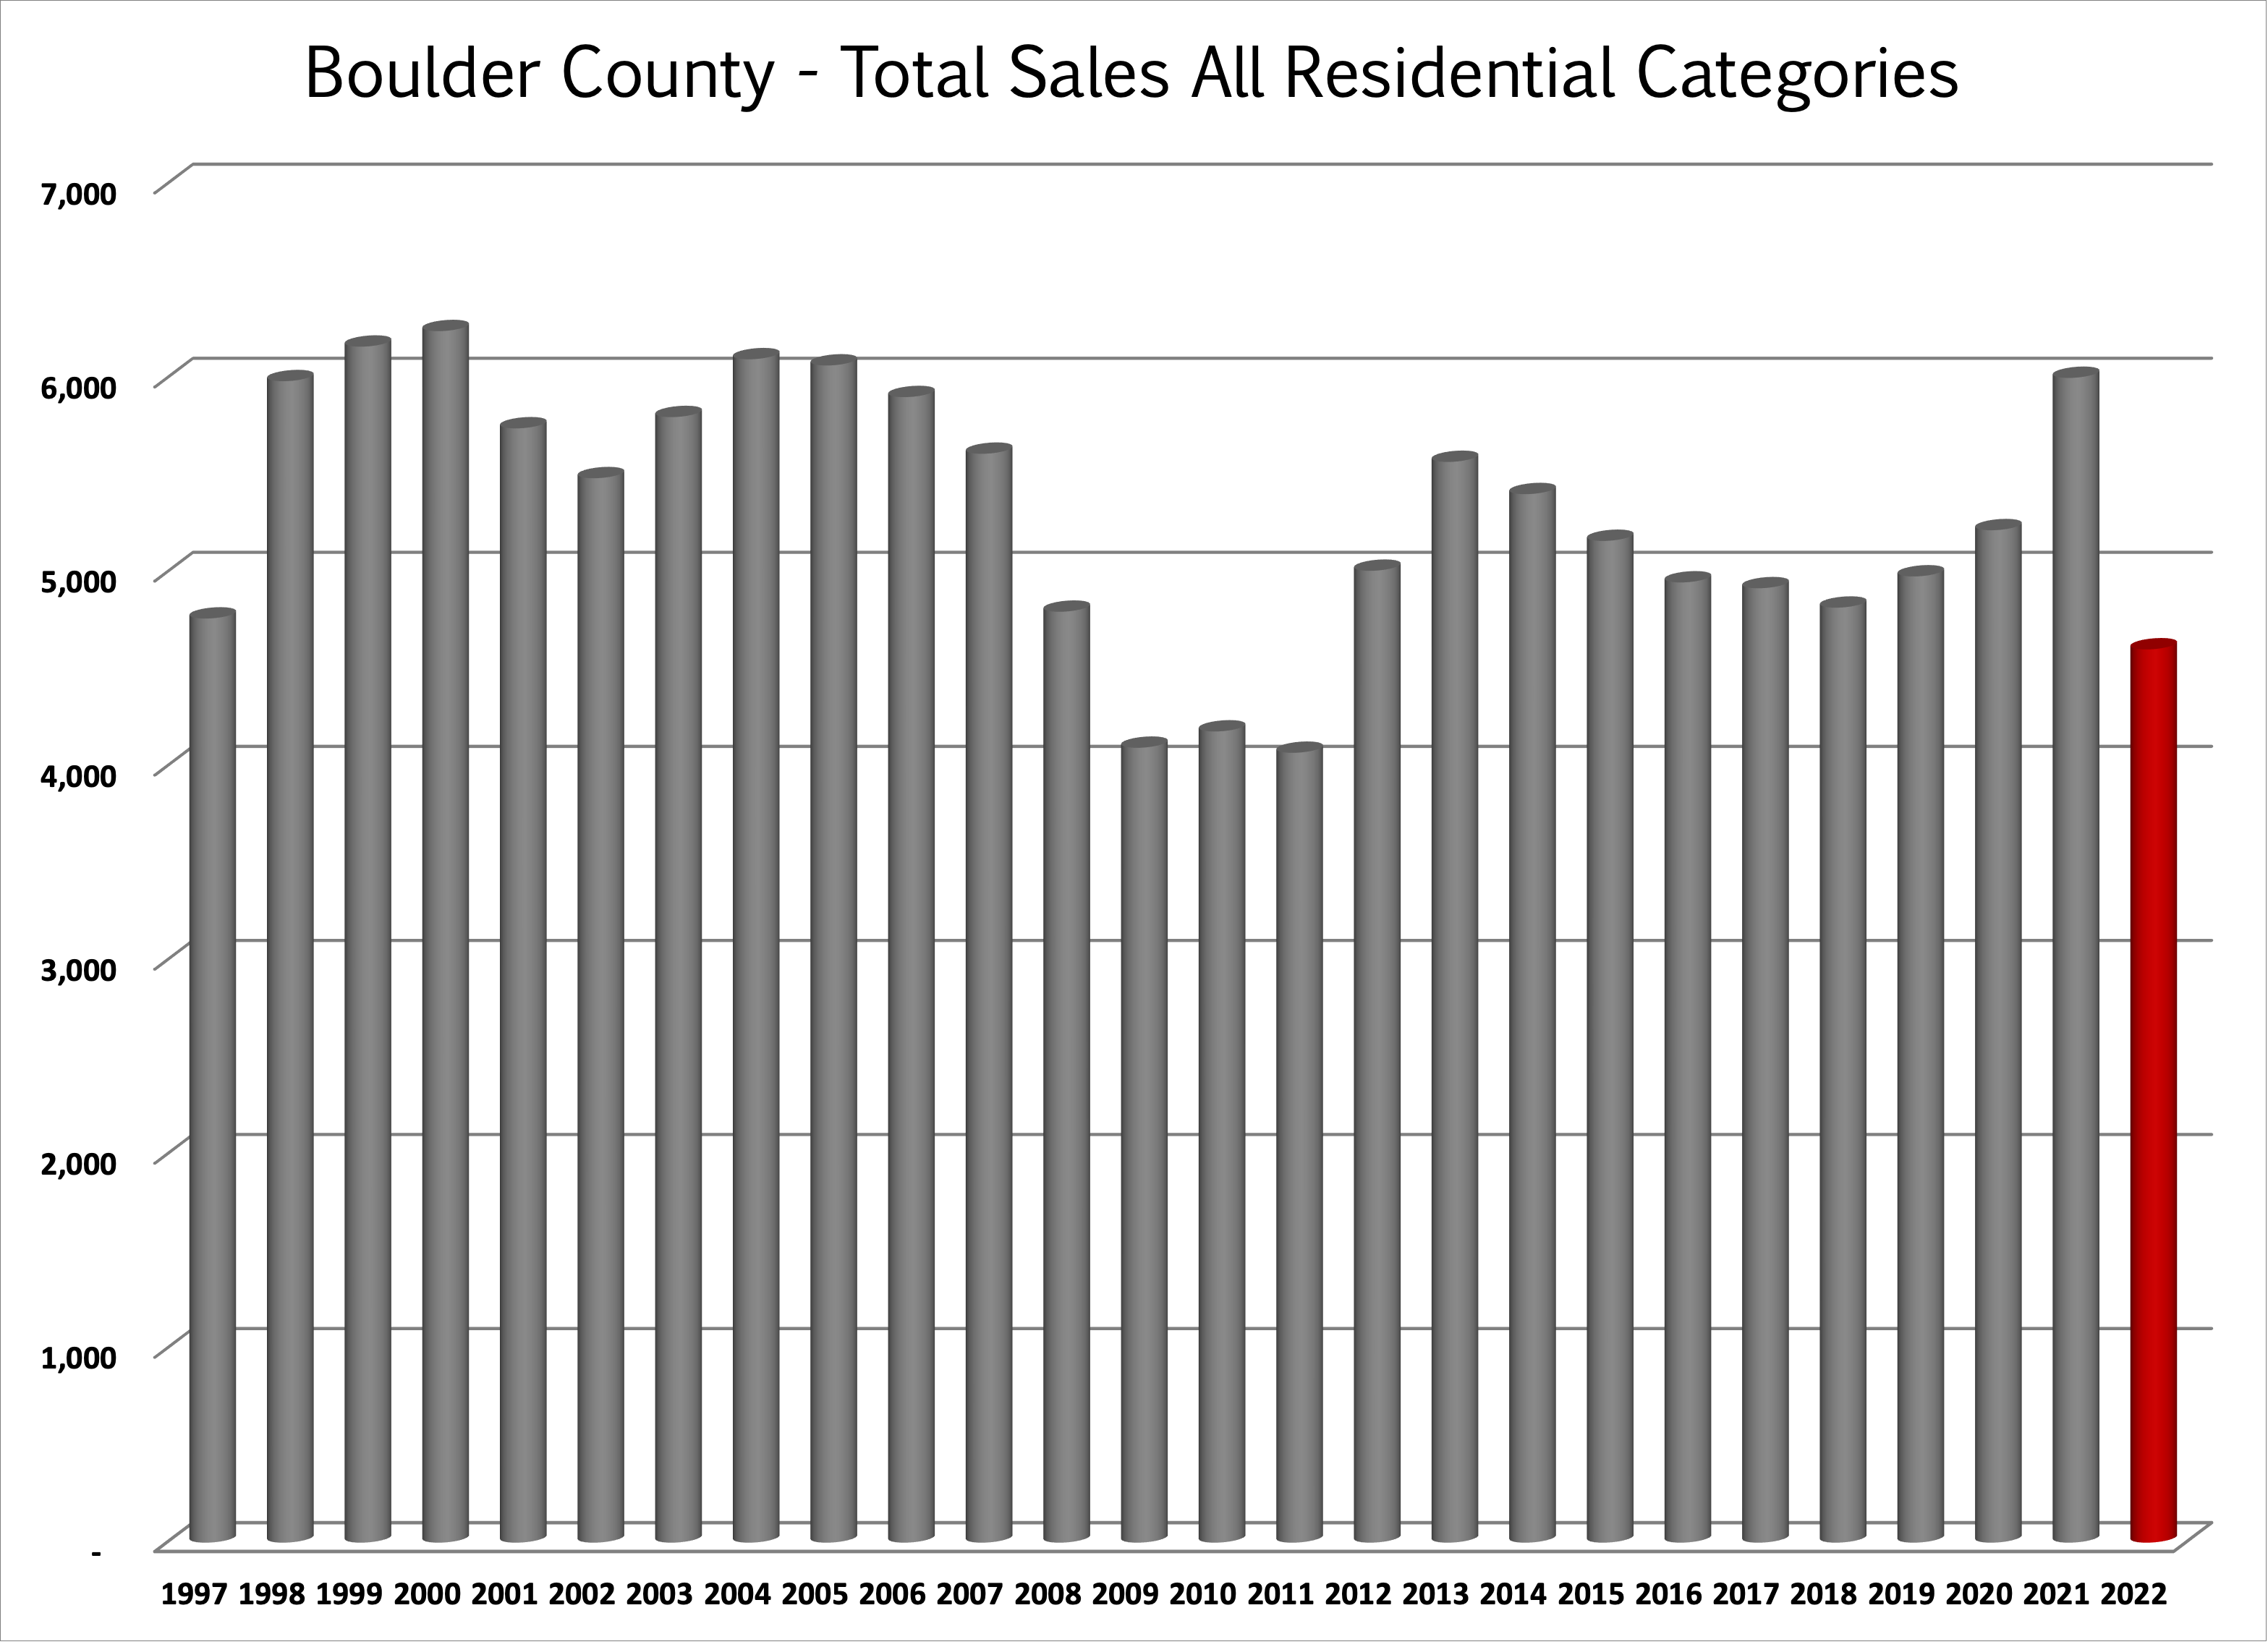
Total Yearly Sales
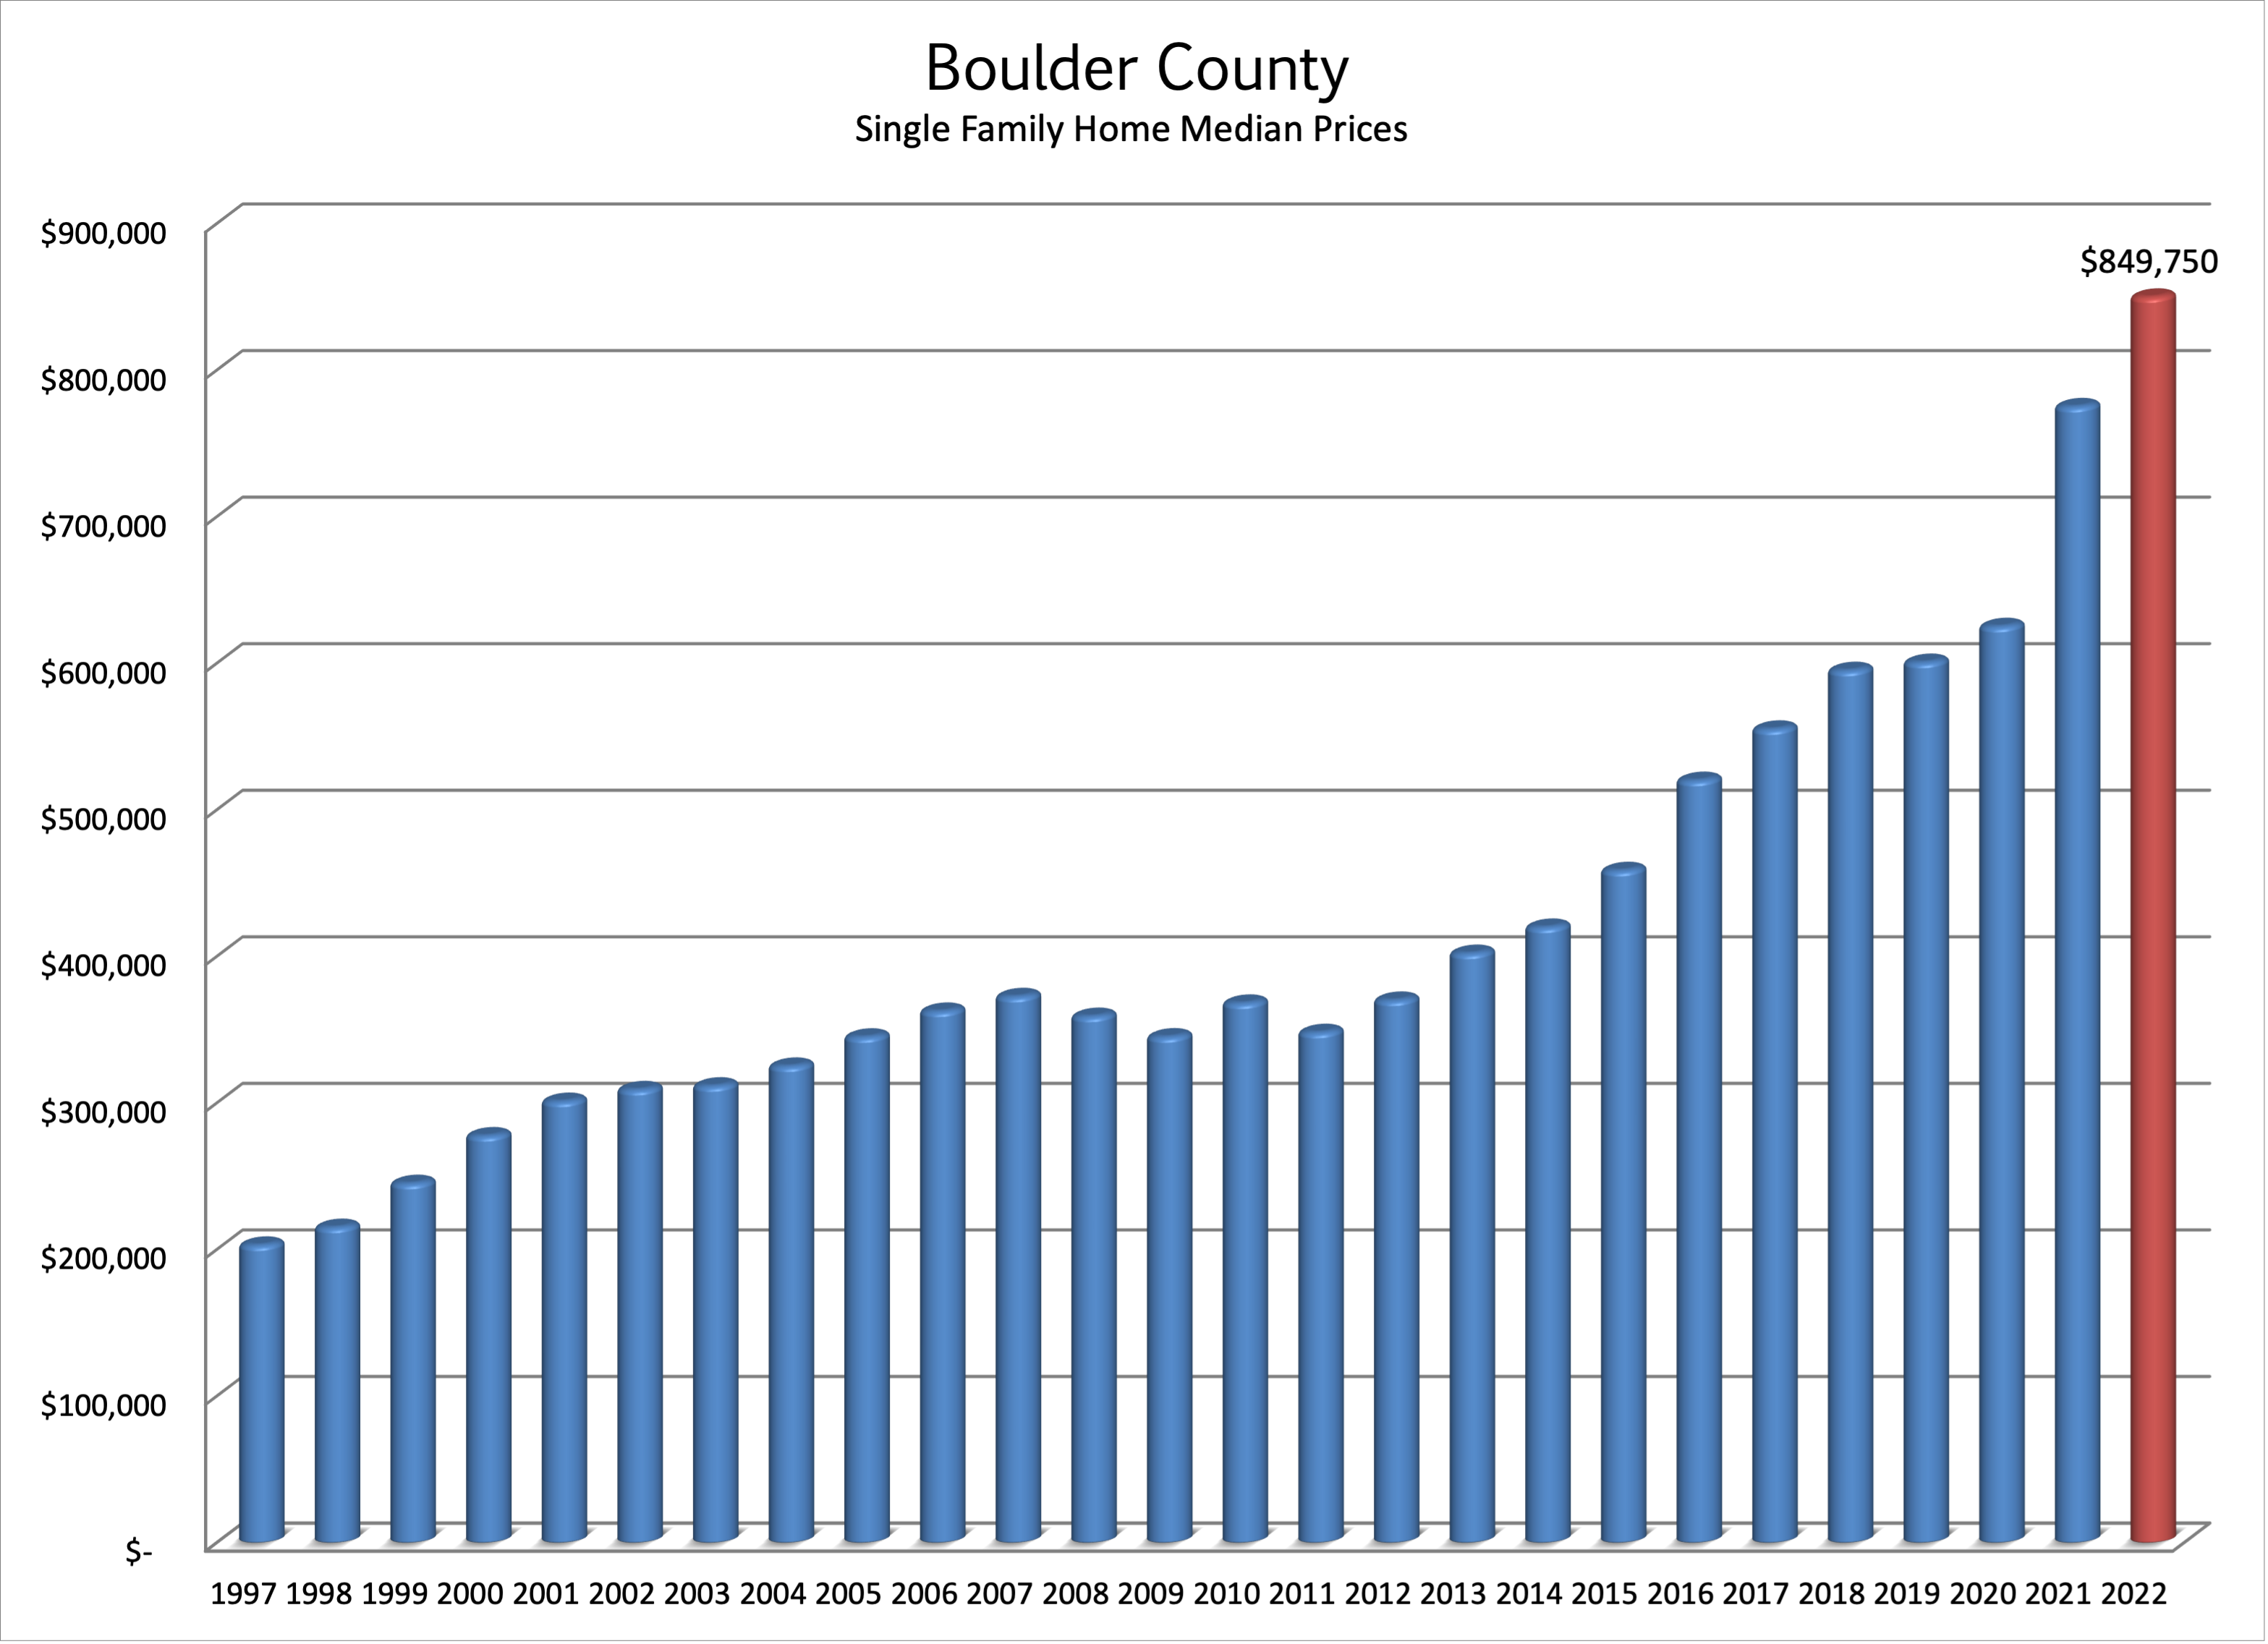
Median Sales Prices for Boulder County – Single Family and Condos/Townhomes
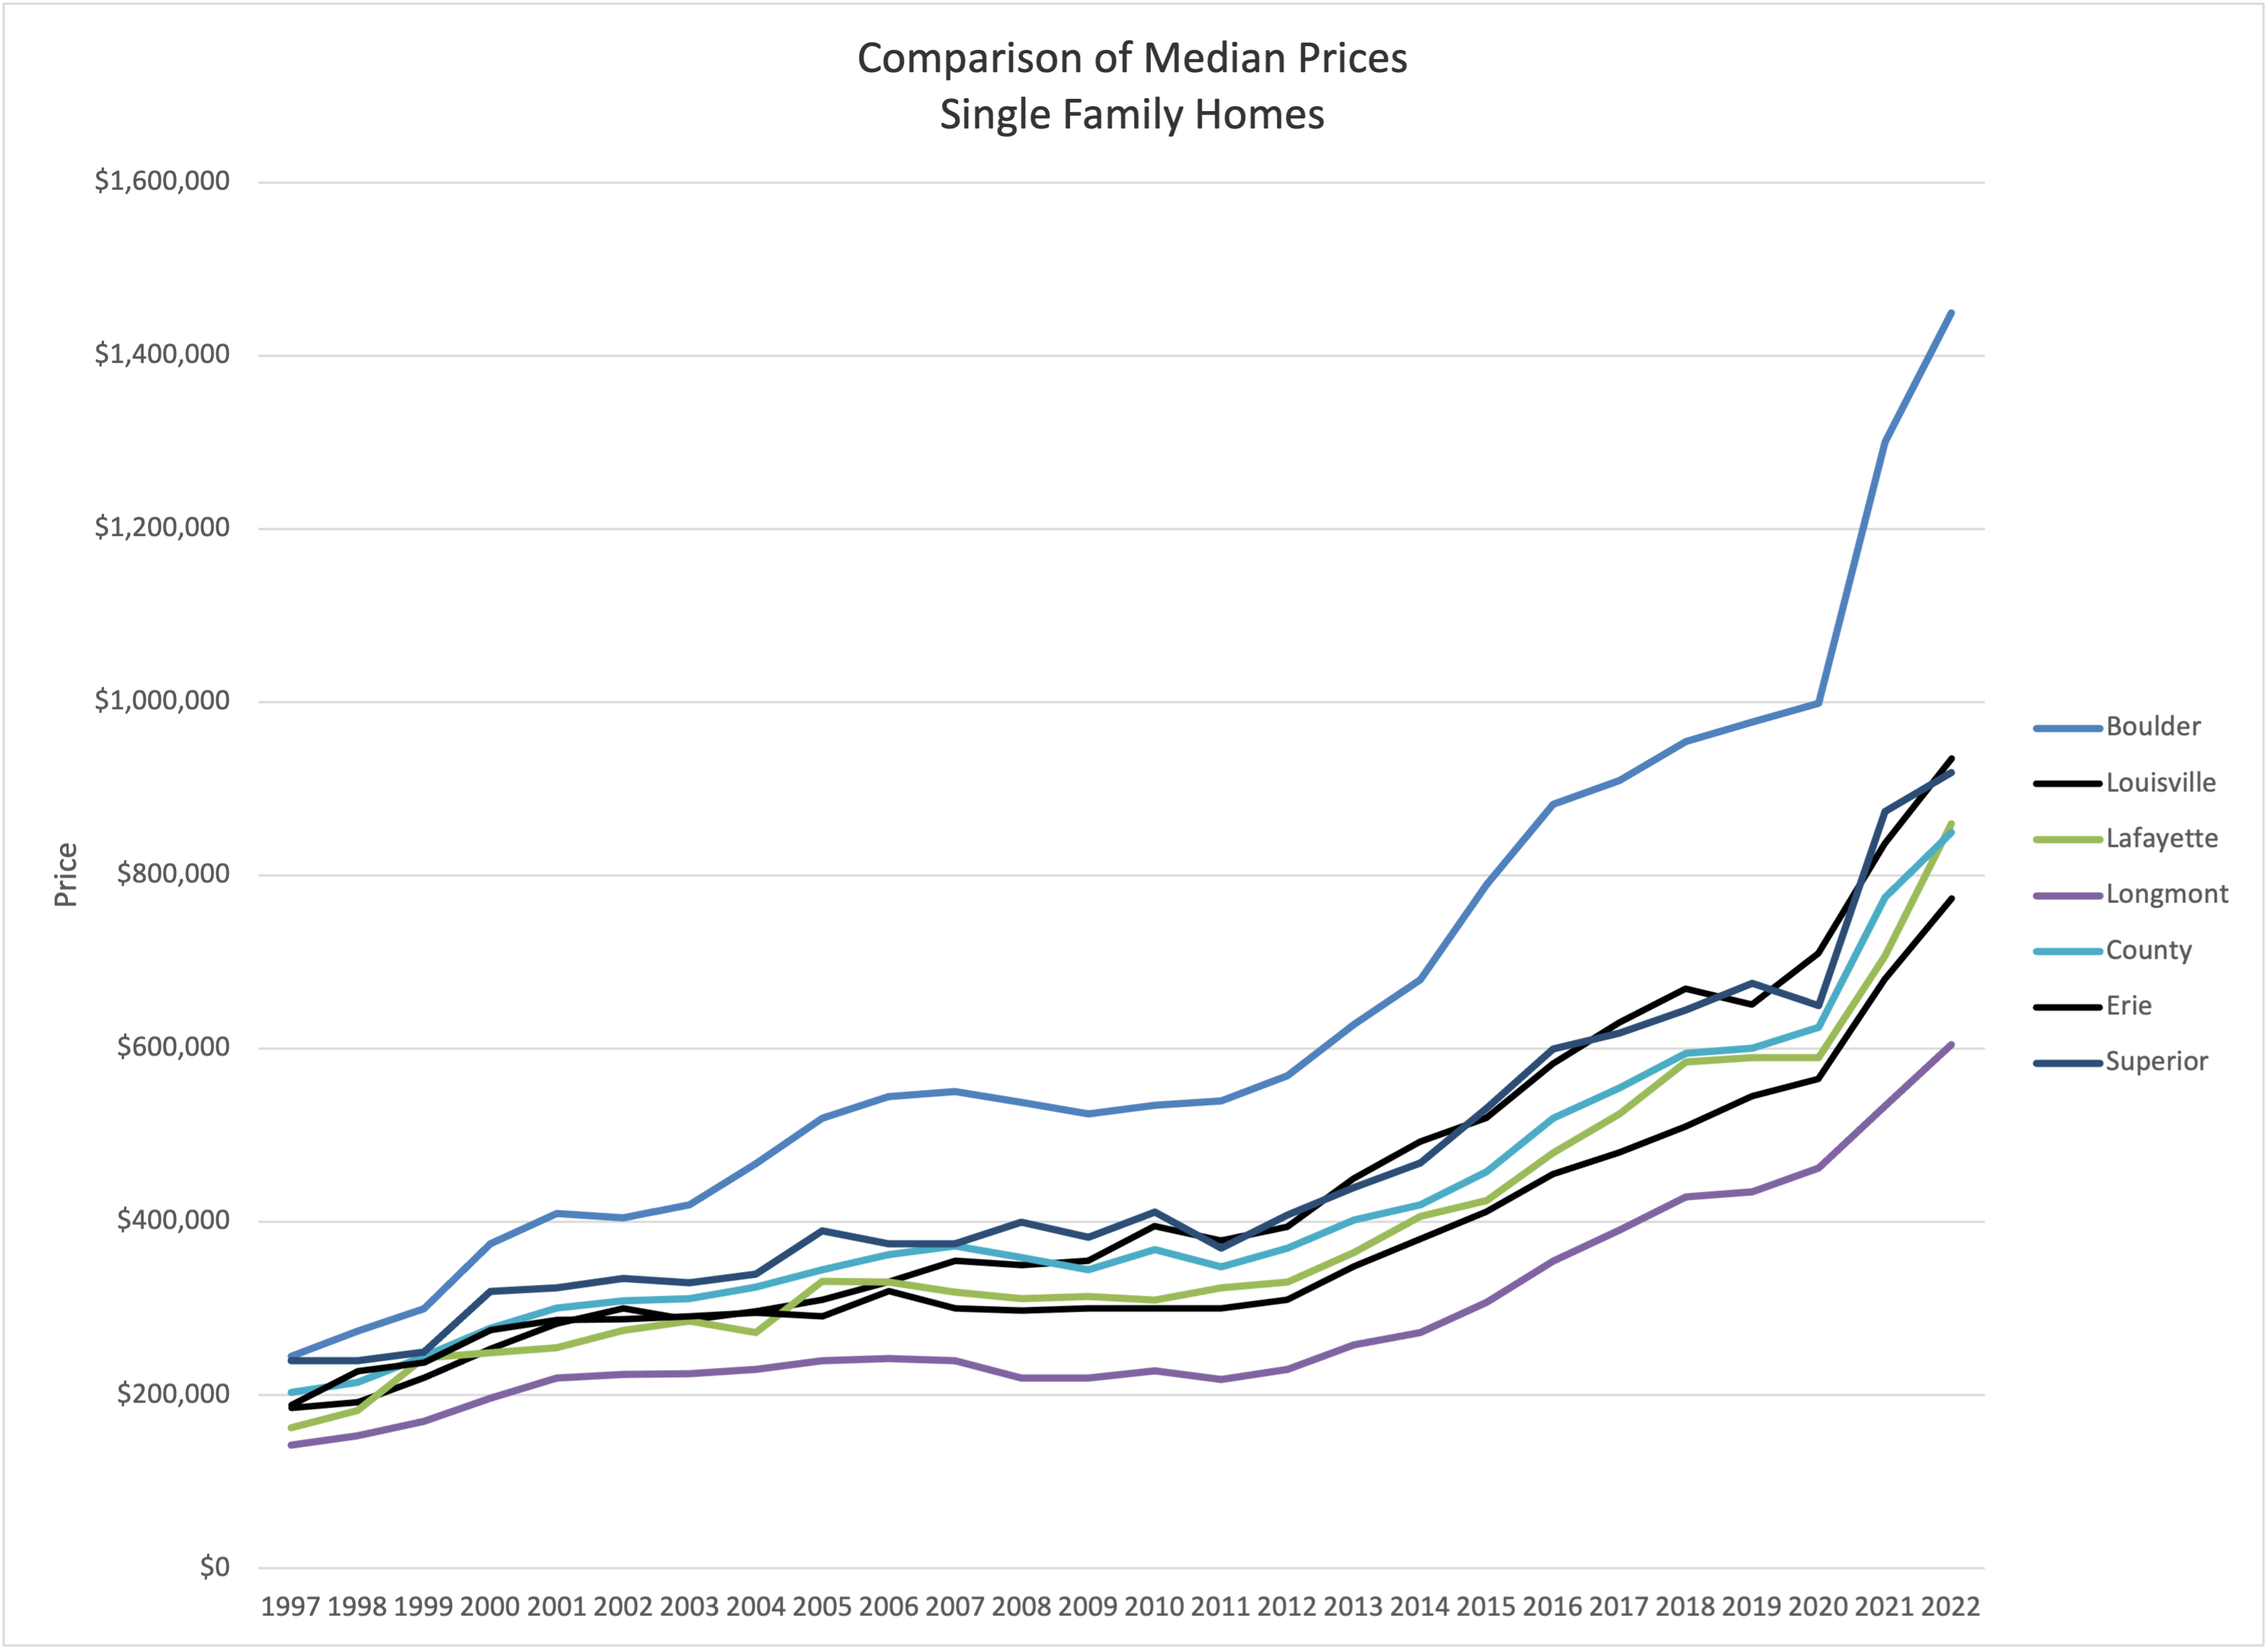
Comparison of median prices in each of the major communities in our area.
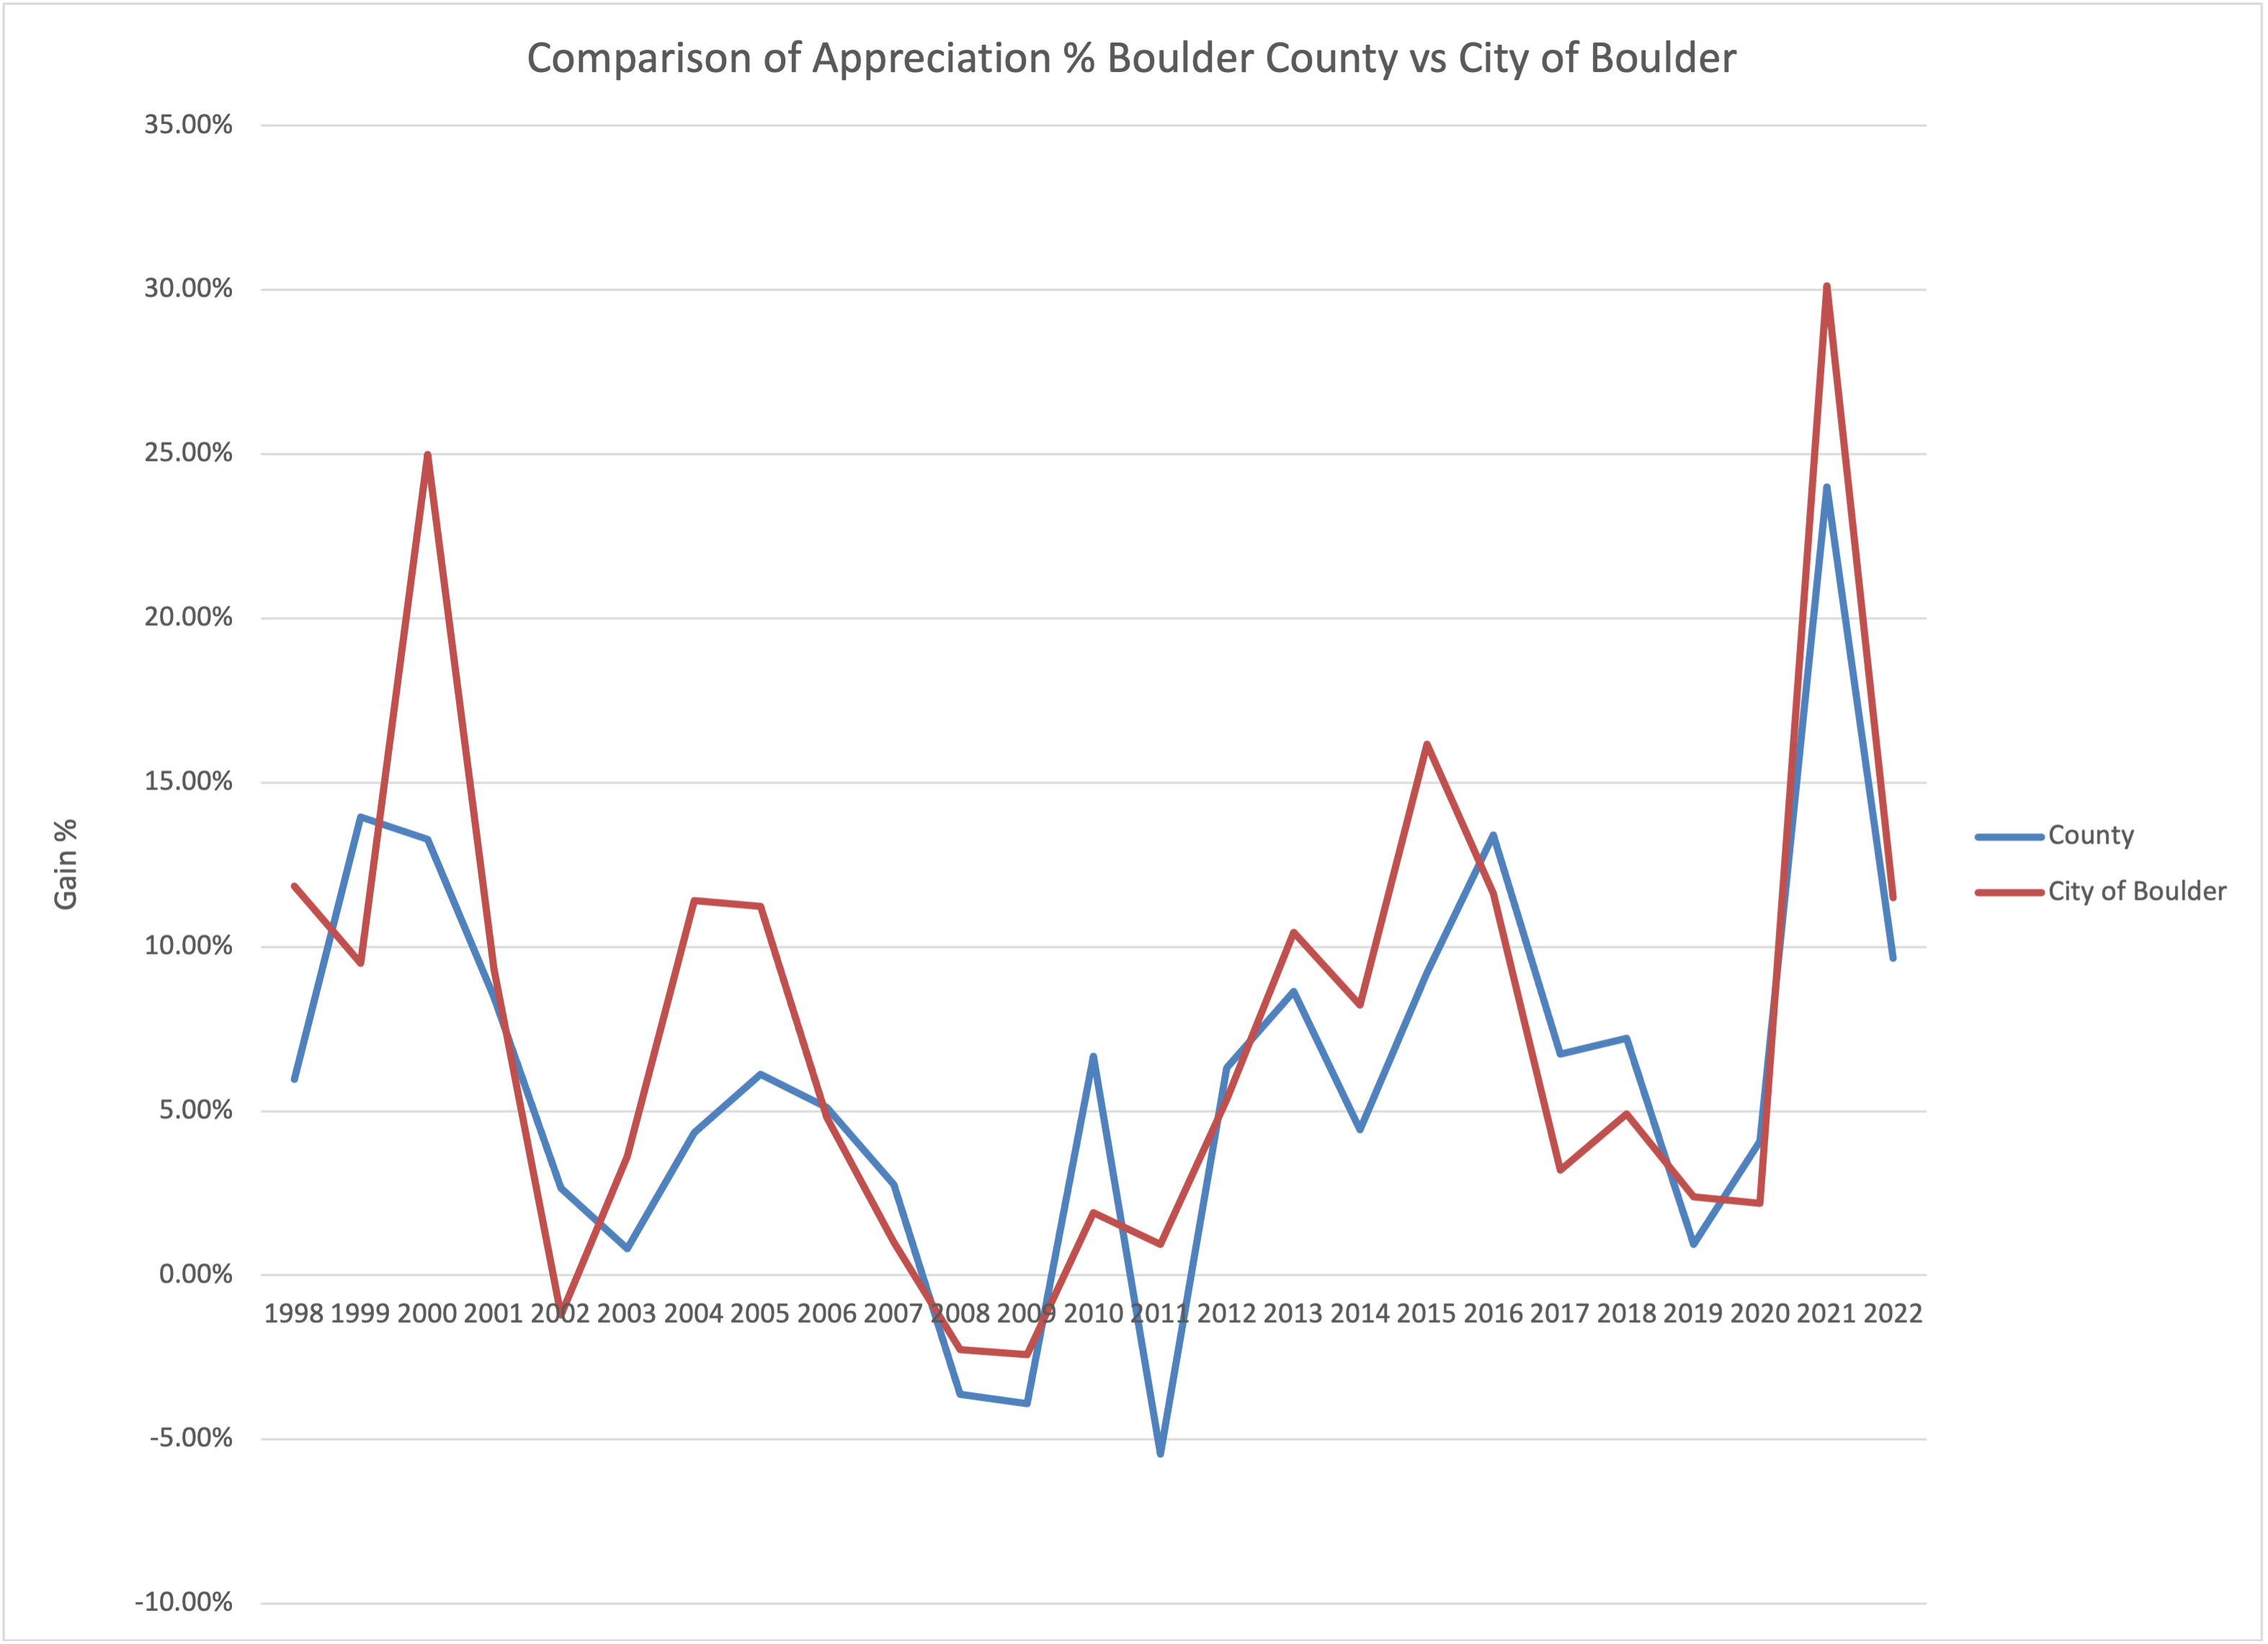
Annual appreciation percentages. City of Boulder and Boulder County
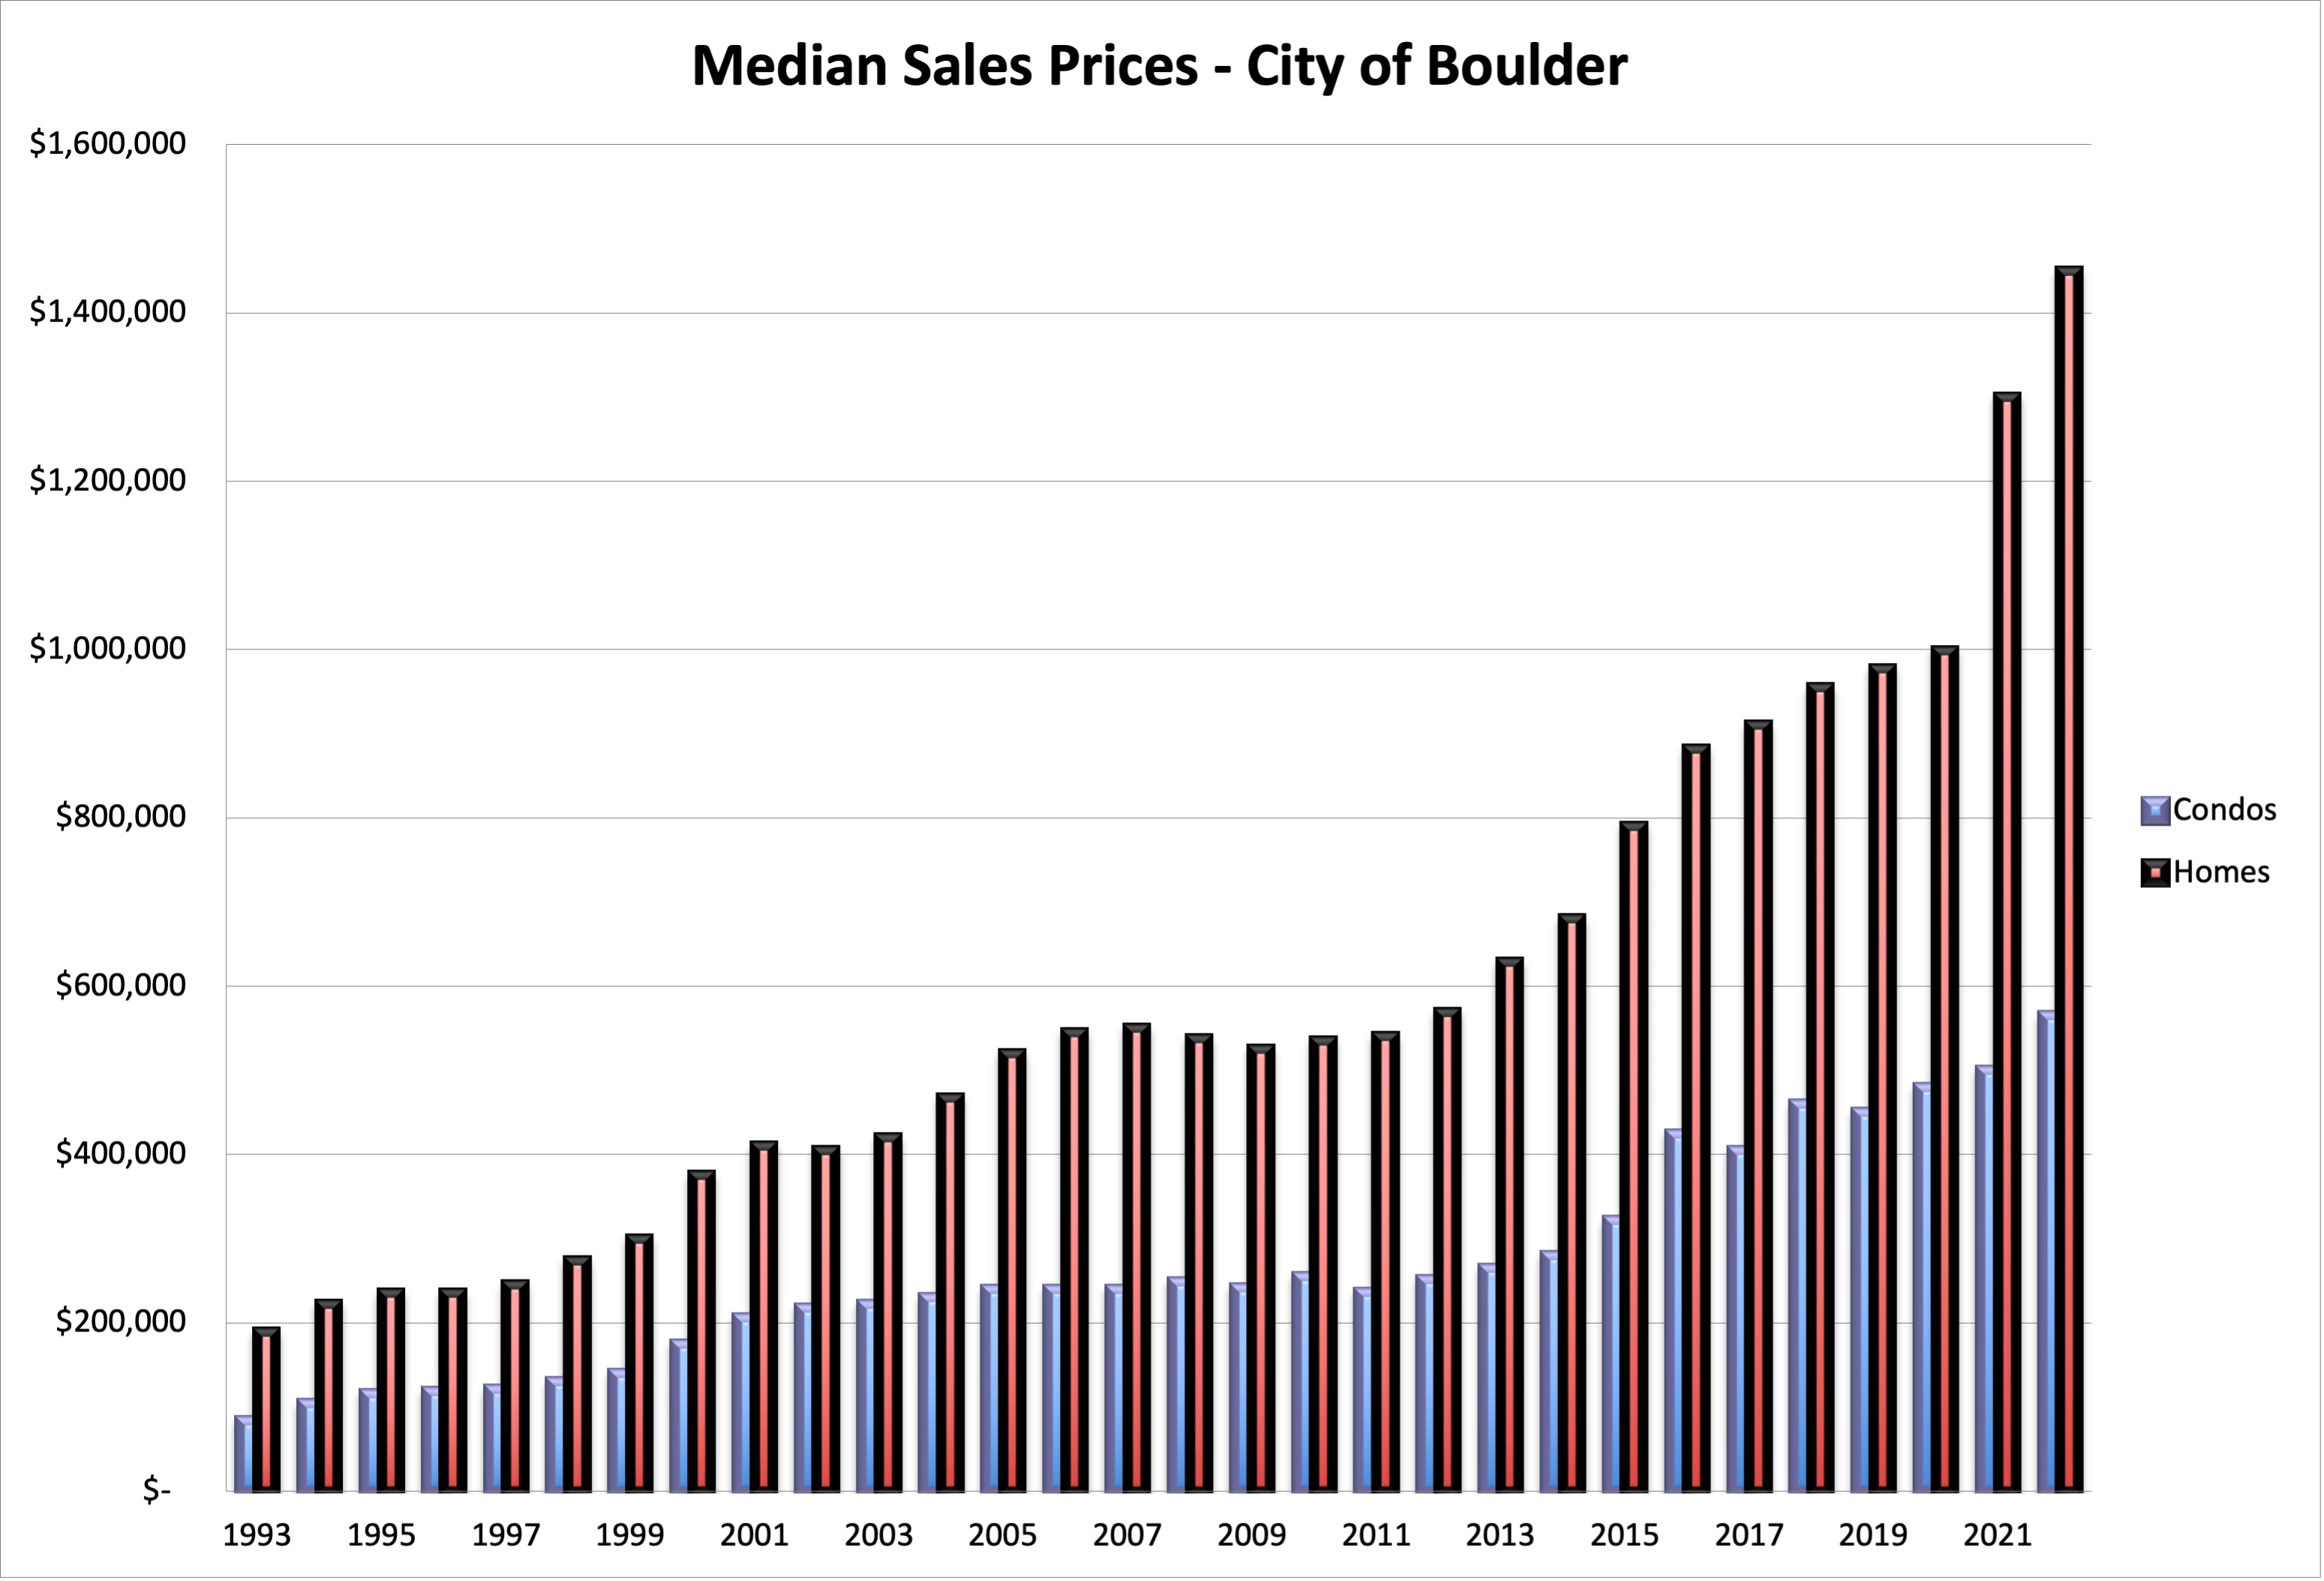
City of Boulder median prices. Single family residential and condo/townhomes.