
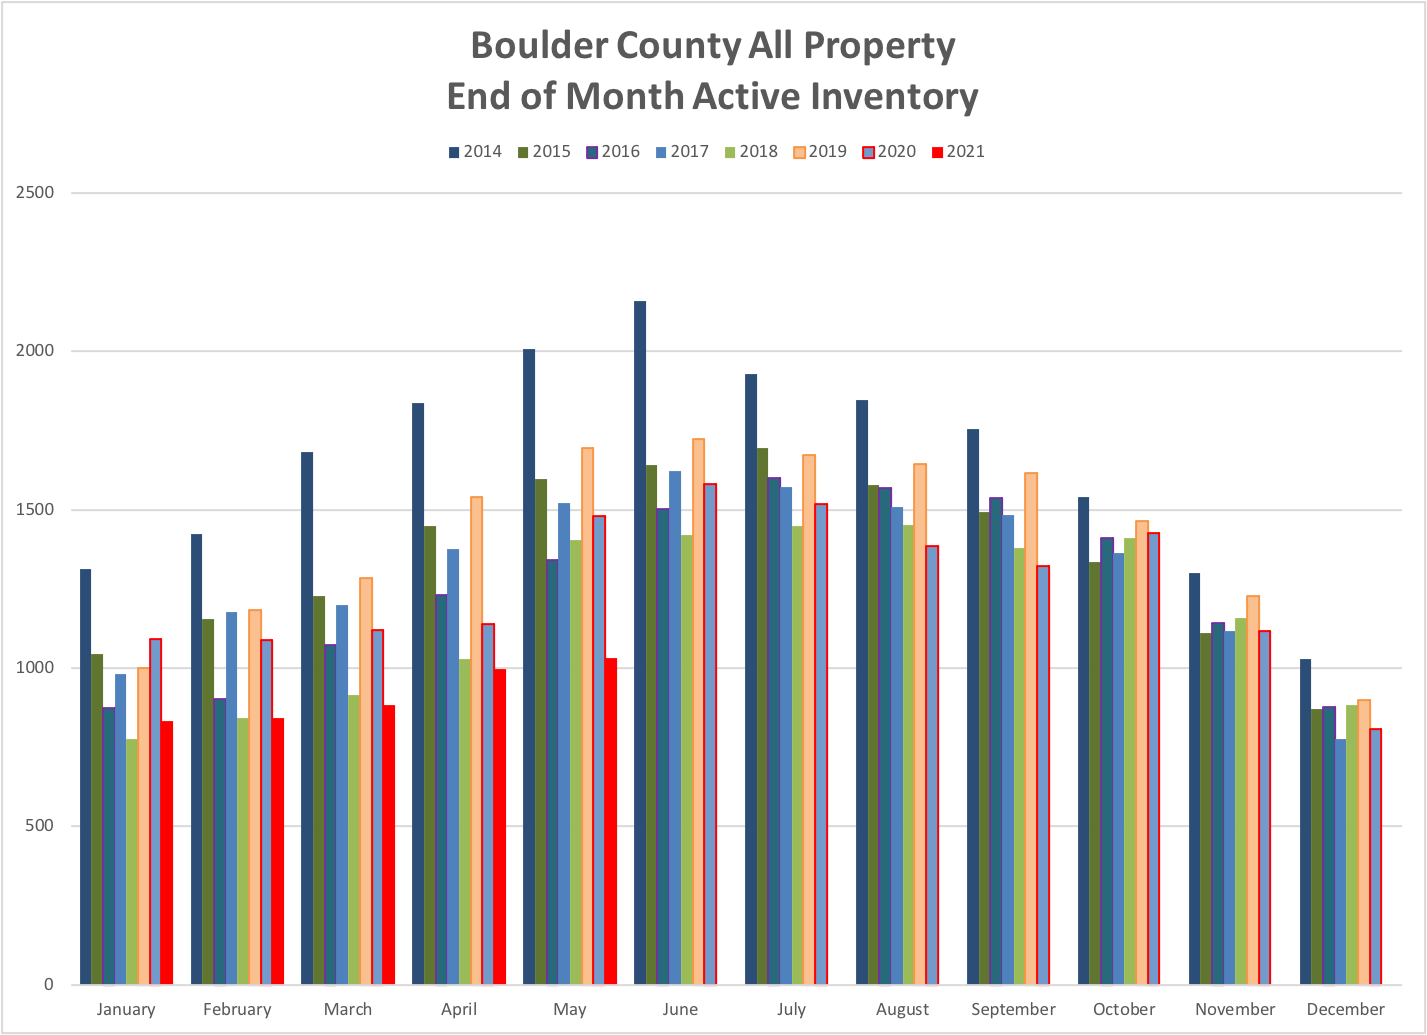
The normal method of analyzing statistics is to look back one year and see how the current month compares. Because of the pandemic, going back one year doesn’t provide useful information. Looking back further we see that total sales are lower than 2019 but slightly higher than May in 2016-2018. Inventory is still very low, and buyers are highly competitive in their offers for the listings that are coming to the market. The graph below shows the month-end inventory over the last 8 years.
Offers are coming in stronger than ever. In May 66% of sales closed for a price higher than the list price. Presumably, multiple offer situations. Of the properties that sold for more: the average premium paid was 9.78% or $69,355, the median was 18.3% higher than list and the top five sales above list price as a percentage were 29%, 30%, 32%, 36% and 50%. In most cases, homes are being listed where past sales justify the price. This means that values are rising quickly, and we are most likely going to see appreciation well into the double digits for the year.

