
Boulder Home Appreciation – 14.44% for the year and 41% over 5 years
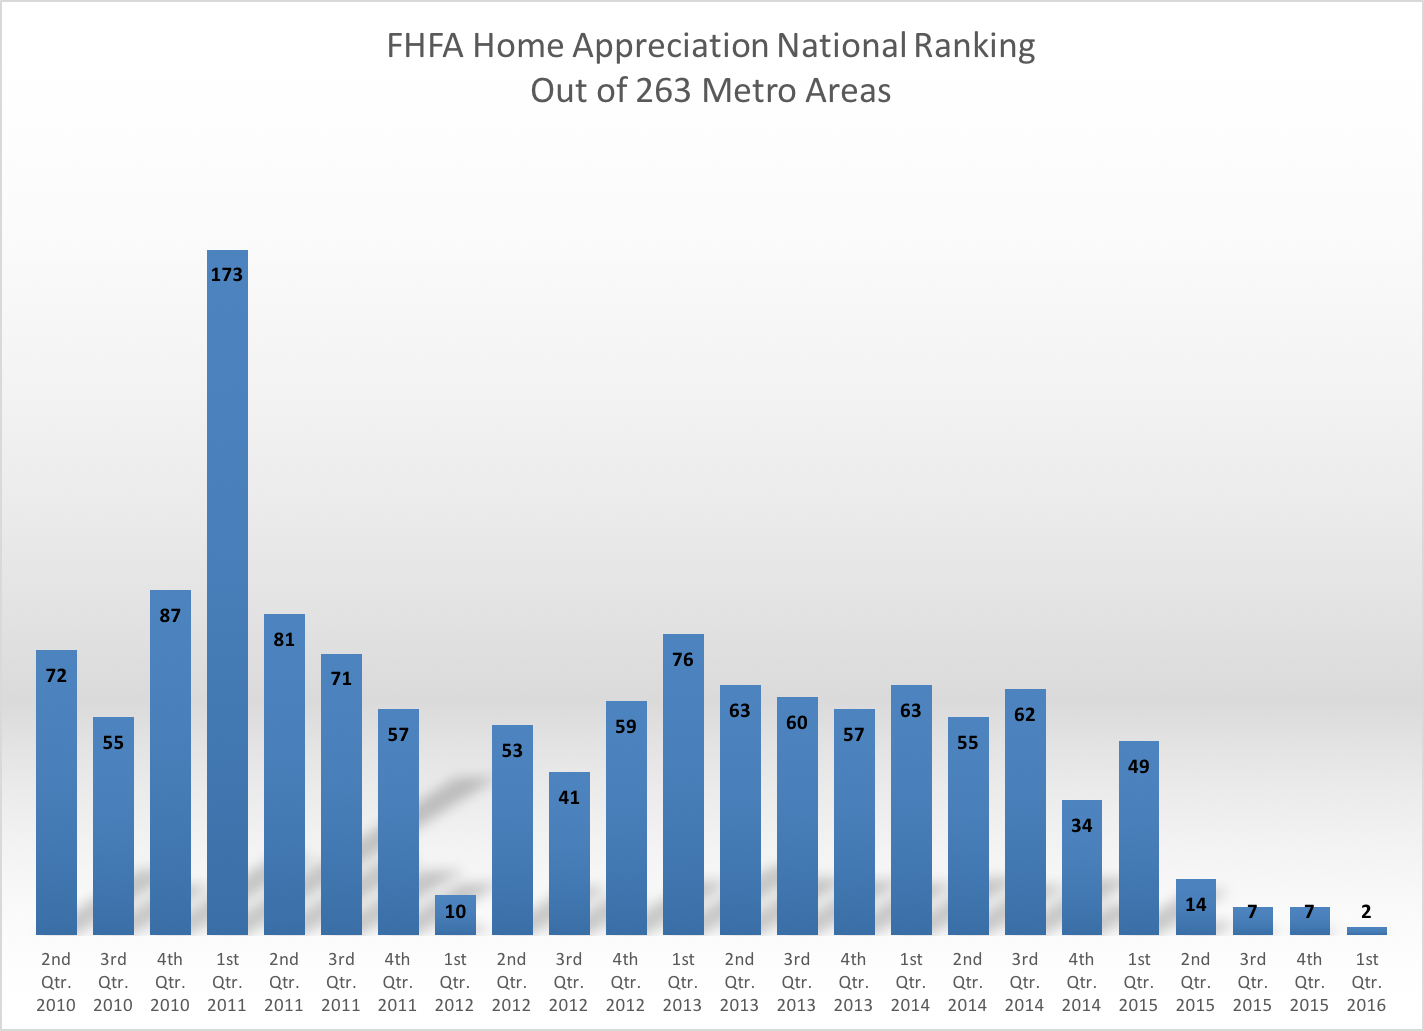
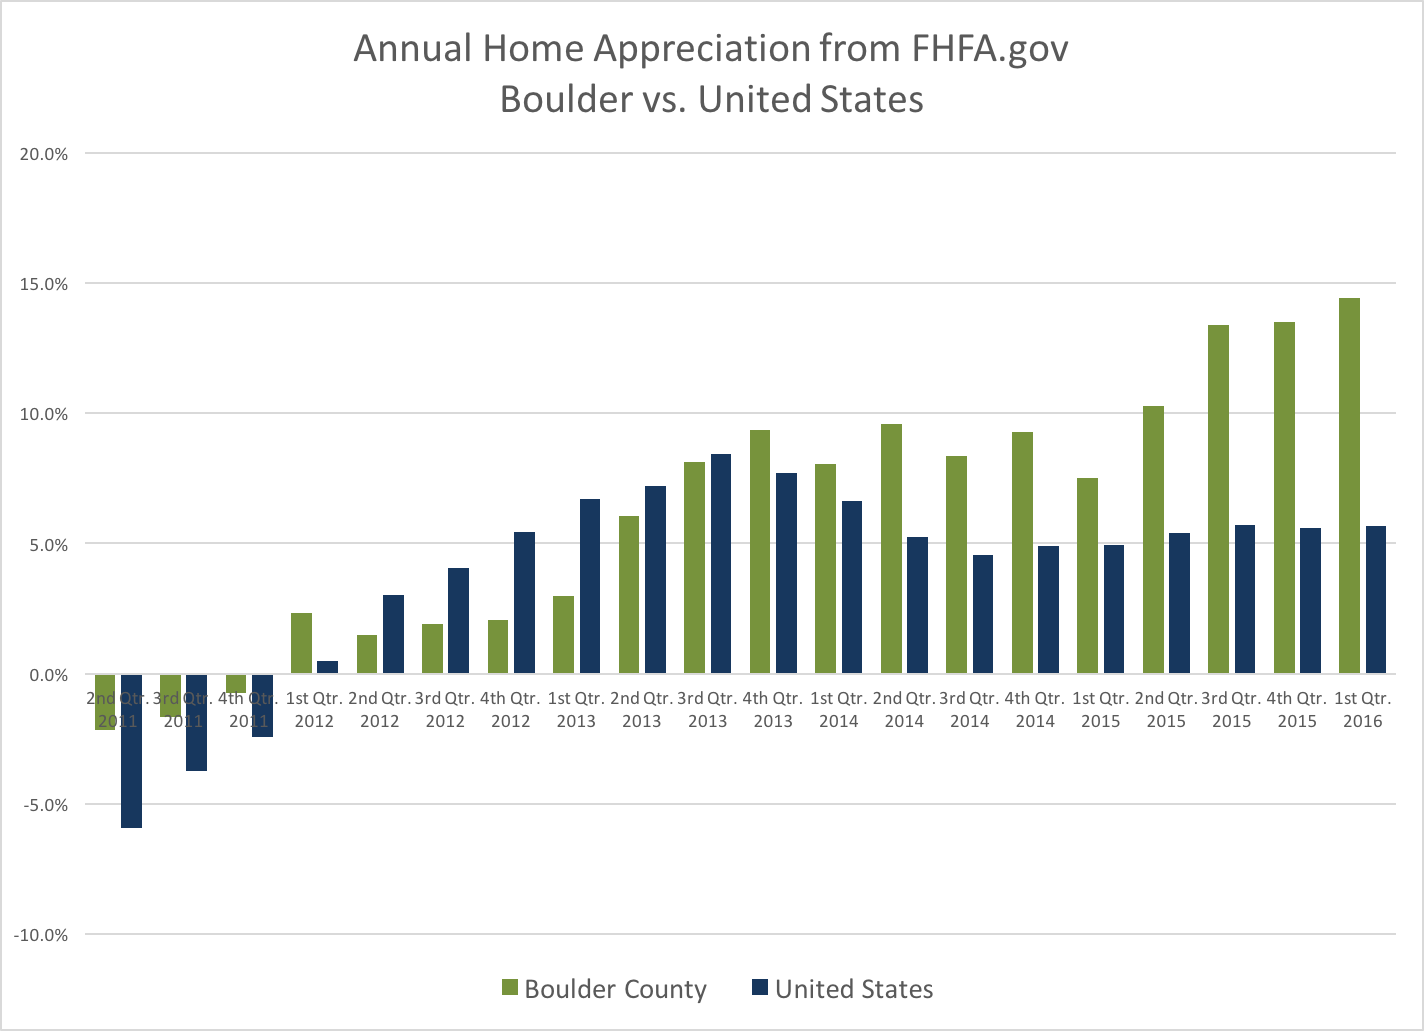
Each quarter FHFA.gov releases their Home Price Index. It is a report that tracks prices of homes in areas throughout the United States. This most current report ranked 263 MSA’s (Metropolitan Statistical Areas) and Boulder (actually all of Boulder County) was ranked #2 for home appreciation for the one year period ending March 21, 2016. The last time we were ranked so high was back in 1999 – 2000 when we were ranked #1 nationally. According to their study which relies heavily upon same house sales, houses in our area gained, on average 14.44% during the one year period. The first of the two graphs below show the history of our national ranking and the second one shows our home appreciation compared to the United States.
Taking a Deeper Look – Comparing 10 year appreciation of 20 hottest real estate markets
When you rank highly in anything for a 1 year period it doesn’t begin to tell the entire story. The old adage is what goes up must come down (I think Issac Newton said that). But in real estate that isn’t always true. So here is deeper look at the current top twenty real estate markets for home appreciation. In this list there are six markets in Florida, four from Colorado, four in California, two each in Oregon and Washington, and one in Nevada and Texas. Click on the tabs below to see the rankings for 1 year, 5 year and 10 year.
Ranking of the Top 20 Real Estate Markets in the U.S. - 1 Year Appreciation
Here are the top 20 markets ranked for 1 year appreciation for the period ending March 31, 2016.
- Port Lucie, FL – 14.68%
- Boulder, CO – 14.44%
- Bend/Redmond, OR – 14.09%
- Reno, NV – 13.97%
- Denver/Aurora/Lakewood, CO – 13.74%
- San Francisco, CA – 13.33%
- Sarasota, FL – 13.21%
- Napa, CA – 13.15%
- Portland, OR – 13.03%
- Greeley, CO – 13.02%
- Melbourne, FL – 12.67%
- Seattle, WA – 12.63%
- Fort Collins, CO – 12.54%
- Oakland, CA – 12.05%
- Fort Myers, FL – 11.81%
- West Palm Beach, FL – 11.46%
- Mount Vernon, WA – 11.23%
- Miami, FL – 11.23%
- San Jose, CA – 11.17%
- Dallas, TX – 10.92%
Ranking of the Top 20 Real Estate Markets in the U.S. - 5 Year Appreciation
Here are the current hottest markets in nation ranked for five year appreciation. The number in parenthesis is their current one year ranking.
- Bend/Redmond, OR – 69.90% (3)
- San Francisco, CA – 59.65% (6)
- Fort Myers, FL – 58.05% (15)
- Napa, CA – 56.88% (8)
- San Jose, CA – 56.15% (19)
- Reno, NV – 55.82% (4)
- Oakland, CA – 54.37% (14)
- Miami, FL – 47.82% (18)
- Sarasota, FL – 47.40% (7)
- Port Lucie, FL – 47.35% (1)
- Denver/Aurora/Lakewood, CO – 47.02% (5)
- West Palm Beach, FL – 45.96% (16)
- Greeley, CO – 44.94% (10)
- Boulder, CO – 40.96% (2)
- Fort Collins, CO – 39.36% (13)
- Portland, OR – 38.77% (9)
- Melbourne, FL – 37.35% (11)
- Seattle, WA – 36.43% (12)
- Dallas, TX – 35.95% (20)
- Mount Vernon, WA – 16.65% (17)
Ranking of the Top 20 Real Estate Markets in the U.S. - 10 Year Appreciation
Unless you are timing the market this is the one that matters!
Over the past year we have experienced an extreme housing crisis and the recovery. So when you look at the 1 year or the 5 year appreciation numbers you definitely don’t get the full picture. Here are the current hottest markets in nation ranked for appreciation over the past 10 years. The number in parenthesis is their ranking over the past five years during the recovery.
- Denver/Aurora/Lakewood, CO – 42.40% (11)
- Boulder, CO – 41.35% (14)
- San Francisco, CA – 40.88% (2)
- Fort Collins, CO – 35.36% (15)
- San Jose, CA – 34.65% (5)
- Bend/Redmond, OR – 32.25% (1)
- Dallas, TX – 32.29% (19)
- Greeley, CO – 29.73% (13)
- Portland, OR – 27.32% (16)
- Seattle, WA – 25.64% (18)
- Oakland, CA – 20.71% (7)
- Napa, CA – 17.49% (4)
- Miami, FL – 10.22% (8)
- Melbourne, FL – 9.16% (17)
- Reno, NV – 7.72% (6)
- Mount Vernon, WA – 6.59% (20)
- Fort Myers, FL – 3.97% (3)
- West Palm Beach, FL – 2.85% (12)
- Sarasota, FL – .42% (9)
- Port Lucie, FL – (-3.06) (10)
Conclusions
If you look closely at the previous three sections you may have found, as I did, that having the hottest market in the short term sometimes means that it is also the most volatile. For example, homes in Port Lucie, Florida, which had the highest appreciation percentage over the past year and was up 47% over the past five years actually lost value over the past 10 years.
When you look at a longer time frame like 10 years it evens out the short term boom and bust. Boulder and Denver were the #1 and #2 market for appreciation (of this group) over the past 10 years. The top five over the past 10 years are Denver, Boulder, San Francisco, Fort Collins and San Jose. These are the markets that have weathered the long term better than the others.

