Being a home buyer is Boulder County is challenging right now. All of the indicators say that this is a great time to buy a home, but home hunters are finding that one key component to their plan is missing. That missing element is the perfect home.
Banks are giving away money, the economy is looking up, Colorado is gaining population, finding a suitable rental property is hard to do and expensive and prices are very similar to what they were five years ago. People who are paying attention recognize an opportunity that may not come again for a long time. But right now in a county of nearly 300,000 people, there are 1,519 properties available for purchase. I hate to be the bearer of bad news but not all 1,519 homes are dream homes. In fact, typically a very small number of homes are available for any combination of area / home type / price range.
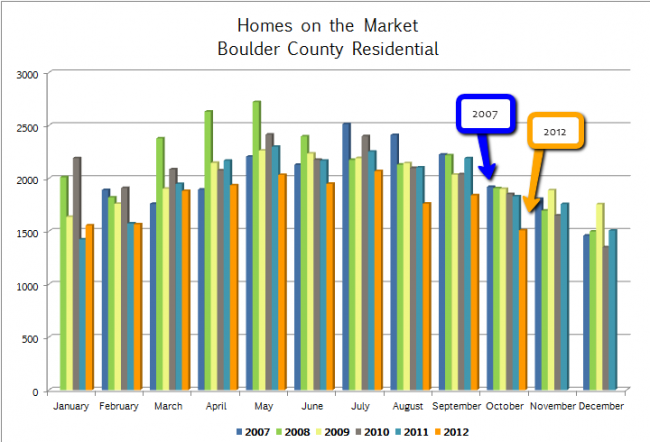
To illustrate the situation let’s compare the number of active listings (without a contract) now versus the same time five years ago. Right now there are 1,091 single family homes on the market in Boulder County that are ready for purchase. At the end of October in 2007 there were 1,919. That is a 43% drop! No wonder there feels like a lack of listings to view. Here is a graph showing single family home inventory at the end of each month over the past five years.
An equation that makes sense to explain the number of houses on the market at any given time is: unsold active homes + new listings – sales – withdrawn listings = current inventory
I have already shown the answer but let’s break it down a bit more and look into the components that make up inventory.
New Listings
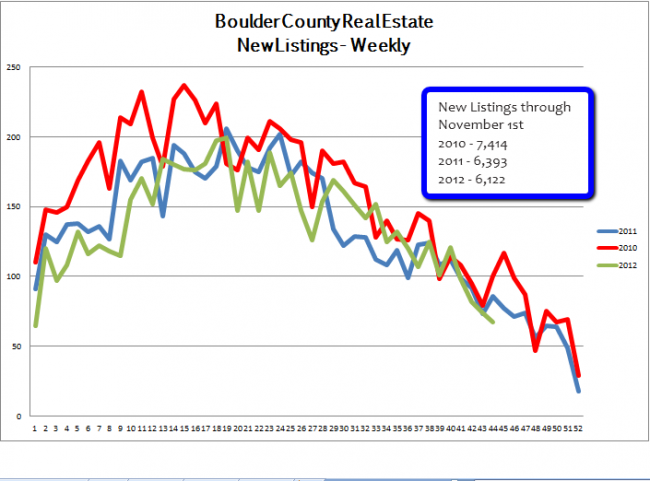
The life blood of a healthy real estate market is new listings. The hope is that a good percentage of those homes are salable; that is well priced, in good condition and in a reasonable location. I have been tracking weekly data over the past three years and one of the measures I look at is new listings. Over the first 43 weeks of this year 6,122 new listings have come on the market. This is 4% less than 2011 and 17% fewer than two years ago. Clearly not all potential sellers have gotten the message that the market has turned. Here’s how this looks graphically.
Sold Listings
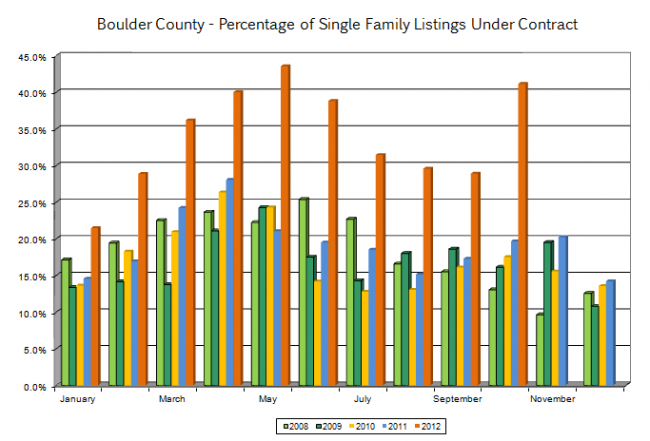
The main component to our listing shortage right now is the increase in market activity as it is shown by sales and the number of homes that are under contract. Sales for the year are up approximately 25%. This is a welcome gain to a market that had been falling in terms of number of transactions for a number of years. Activity has been strong even into the fall and the competition between buyers has made finding the right home even more difficult. In a normal, healthy market, the number of homes that are under contract compared to the available homes falls in the 15 – 20% range. This year we have spent most of the year with a 40% under contract percentage. This means that at any one time only 60% of the active listings are actually available. When you subtract the overpriced and outdated homes that are listed the inventory that a buyer would actually be interested in shrinks significantly.
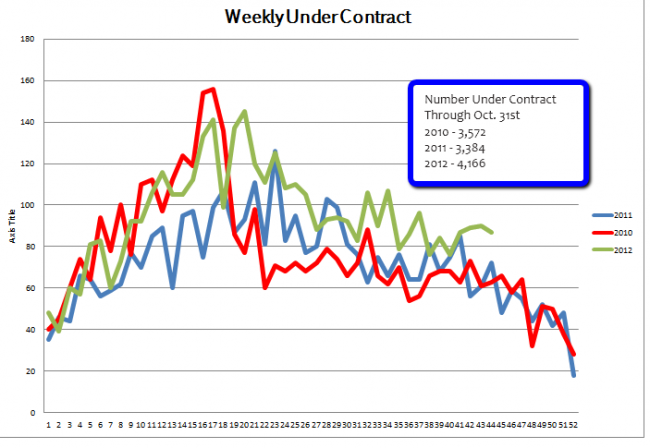
This year through the end of October 4,166 homes have gone under contract in Boulder County that is a 23% increase over last year. Here are two graphs that show the increases in the sale side of the equation.
If you are a buyer, I hope this gives you an in depth understanding on why it’s hard to find a home right now. If you are a seller, I hope it gives you the information you need to give you the courage to list your home. Either way, it is a market where you need help to make sure you are getting good information in a timely fashion. If you need a good Realtor who understands the market and works in it every day call me I’m ready to be of assistance.


