
Boulder Real Estate Market Activity Report
Summer is over and fall is definitely in the air. The sizzle that we felt during the spring in the Boulder real estate market is now a simmer. Properties are still selling and there are even multiple offer situations going on, but houses flying off the market the minute they are listed is no longer the norm. During both 2014 ad 2015 we saw a strong fall surge in the market but now that we are nearing the end of September it’s apparent that we are not going to see that again in 2016.
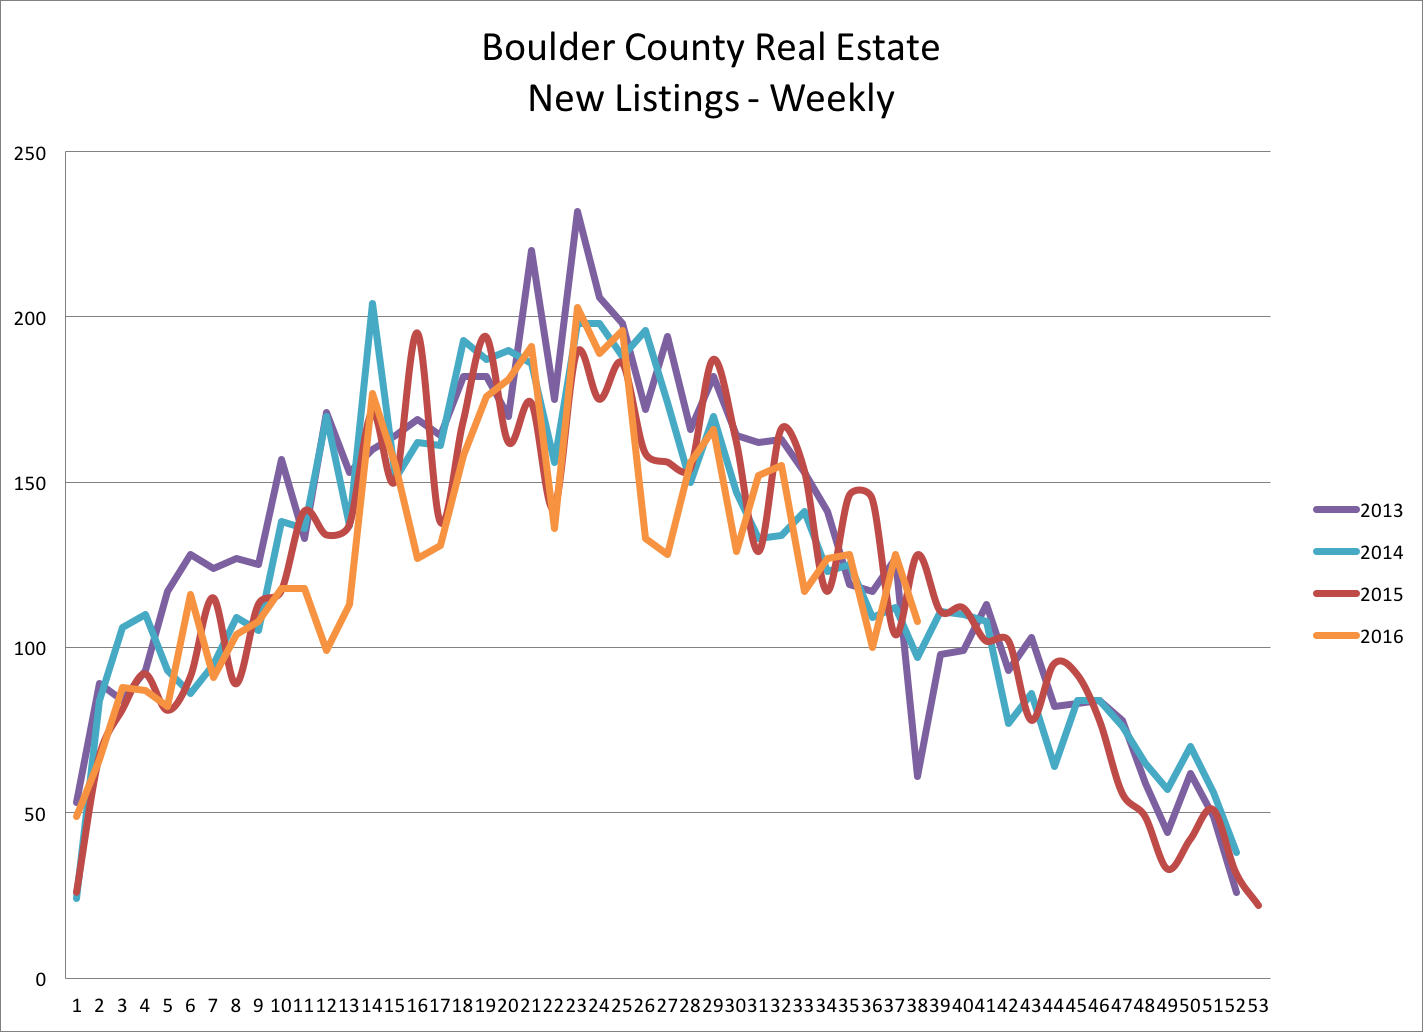
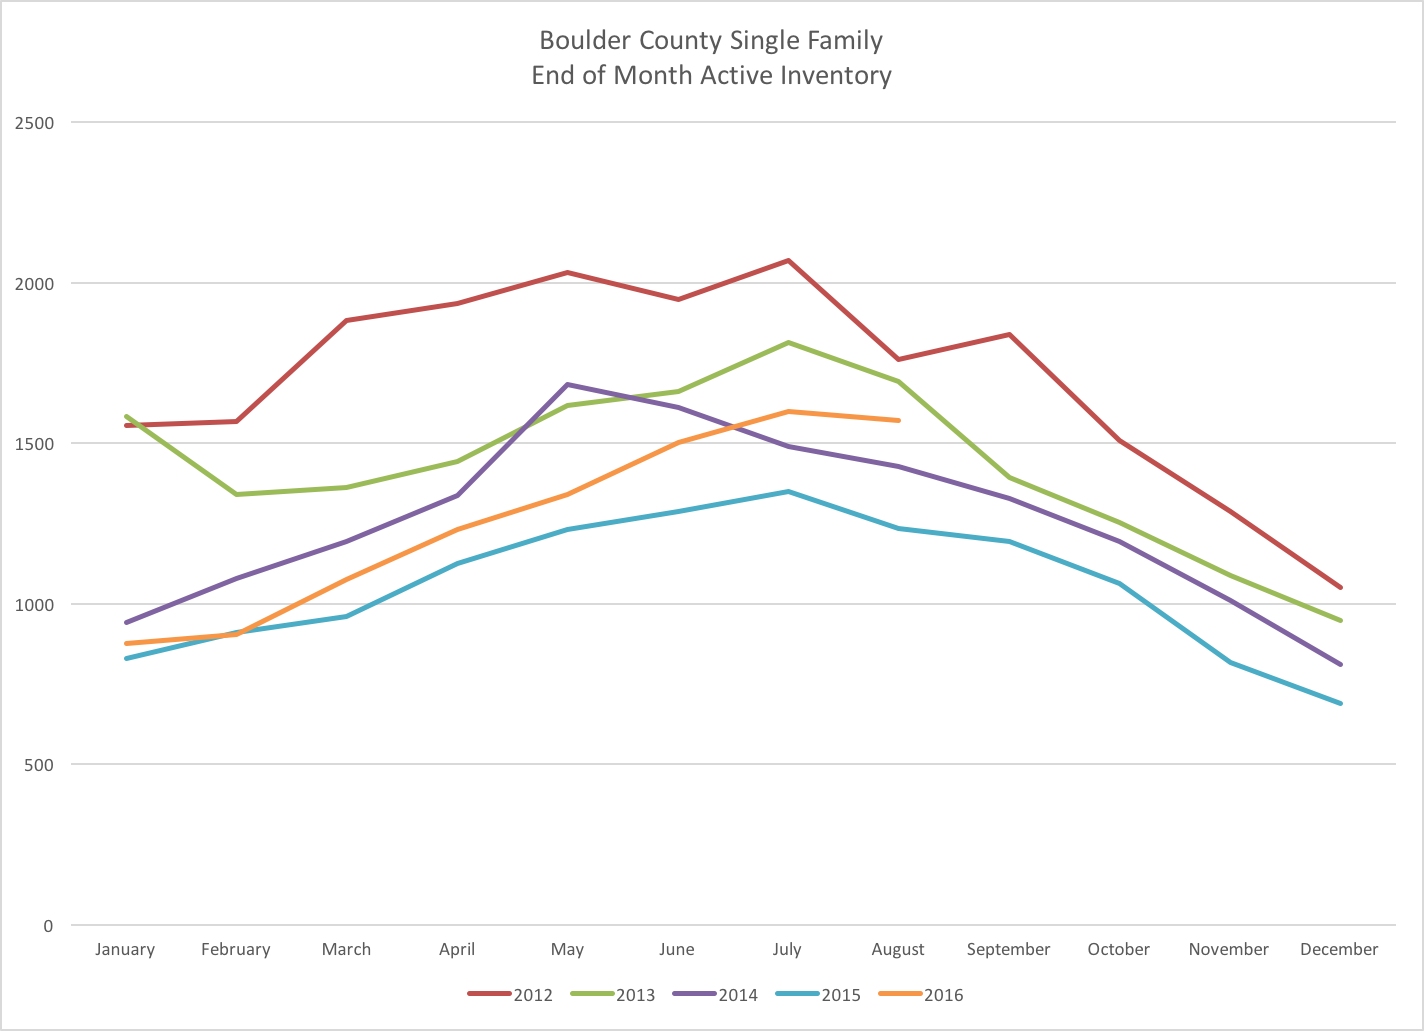
The first graph (below left) shows the number of new listings that have hit the Boulder County market each week over the past three years. The orange line shows that in 2016 we have had fewer listings go on the market. This continues the trend of fewer homes listed. However, the graph on the right shows the end of month inventory of properties for sale in Boulder County. We have more inventory this year than last. Fewer new listings, but higher inventory….how does that happen? Fewer sales. (note you can click on any graph and see it in a larger format)
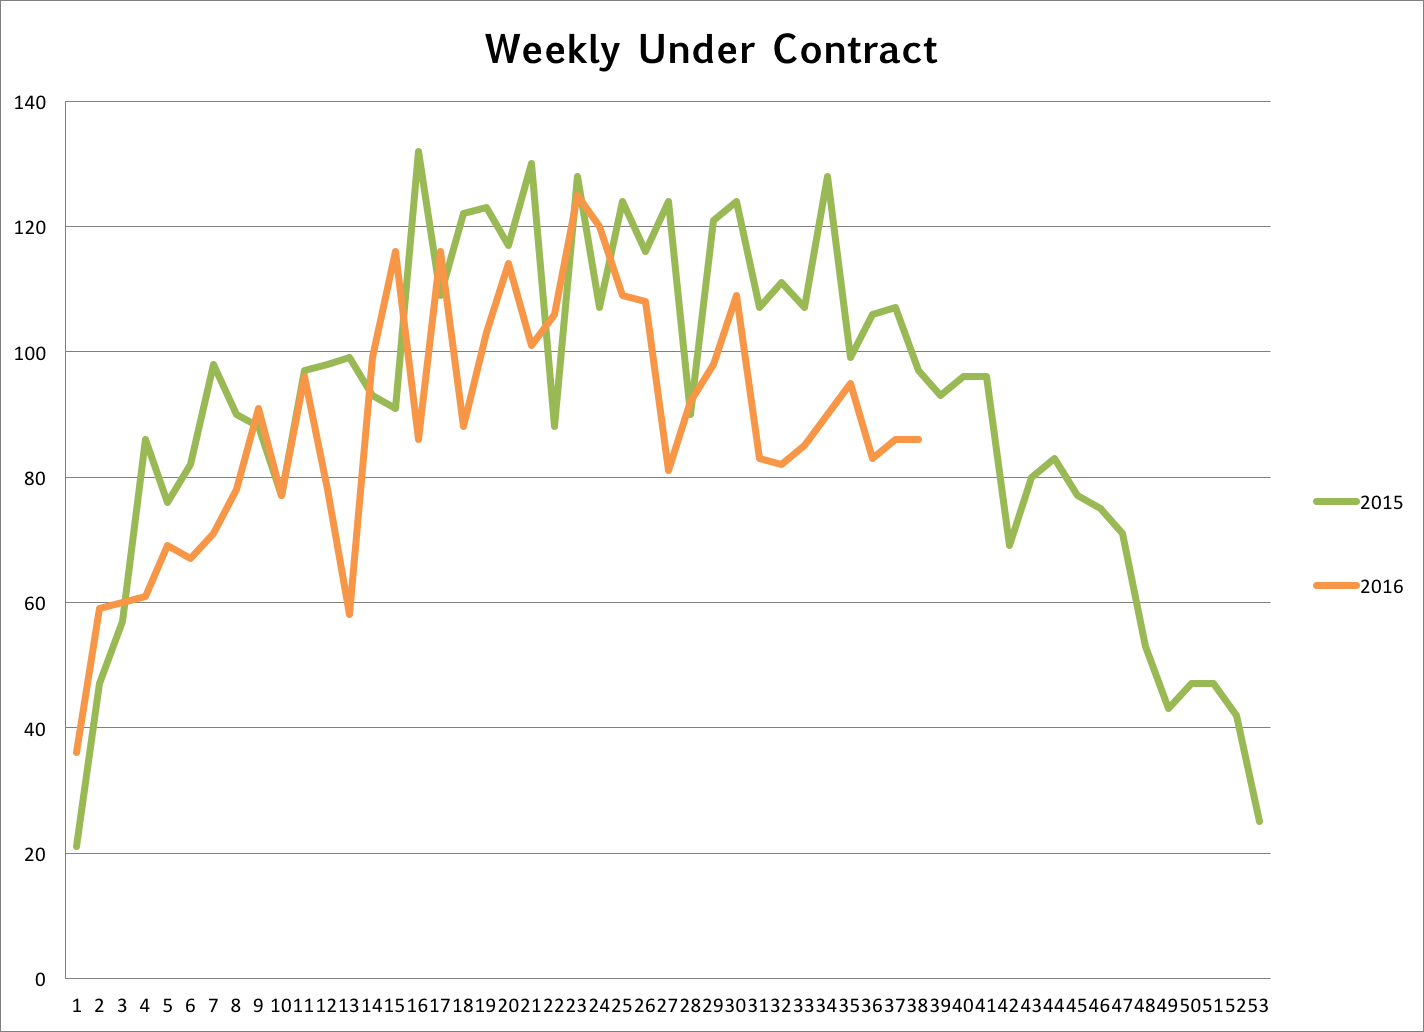
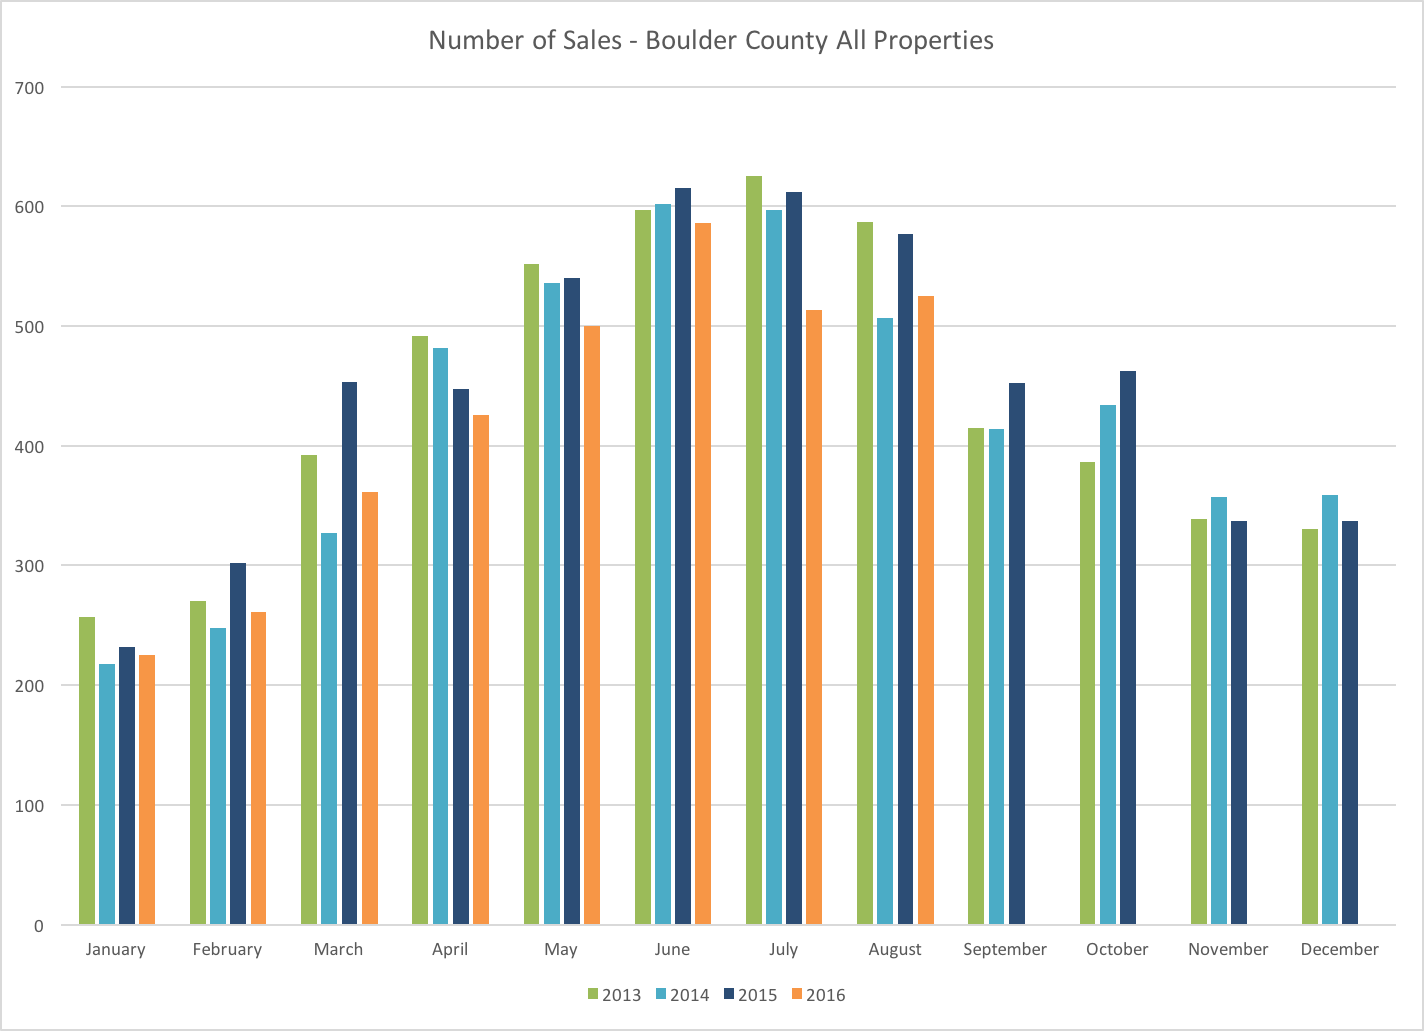
The number of properties that go under contract is a good predictor of future sales. Over the last few months (as seen on the graph below and to the left) the market is definitely slower than it was a year ago. Fewer houses are selling. The graph on the right shows monthly sales through the end of August. Given the recent under contract activity we can predict that we will again lose ground in terms of total sales to 2015. At the end of August we were down 10% year to date.
Absorption Rate by Price Range
A good statistic to gauge market strength is absorption rate. It is basically tells us how long it would take to sell all of the available listings in a given price range if the sales rate remained equal and no new listings came on the market. The math: find the monthly sales rate by dividing the total sales over six months by six; then divide the total number of active listings by the monthly sales rate you just came up with. For example the current absorption rate for properties priced $250,000 and below is 2.33 months. That number steadily climbs up to 5.38 months for properties between $1 and $1.5 million and then jumps to 9.94 months for properties listed above $1.5 million. This large number in the luxury sector represents a high inventory of listings since last year we had record sales in that price range.
Absorption Rate by Price Range (months)
0 - $250k
$750 - $1M
$500 - $750k
$1 - $1.5M
$500 - $750k
> $1.5M

