by Neil Kearney | Sep 27, 2016 | Boulder County Housing Trends, Statistics
Boulder Real Estate Market Activity Report
Summer is over and fall is definitely in the air. The sizzle that we felt during the spring in the Boulder real estate market is now a simmer. Properties are still selling and there are even multiple offer situations going on, but houses flying off the market the minute they are listed is no longer the norm. During both 2014 ad 2015 we saw a strong fall surge in the market but now that we are nearing the end of September it’s apparent that we are not going to see that again in 2016.
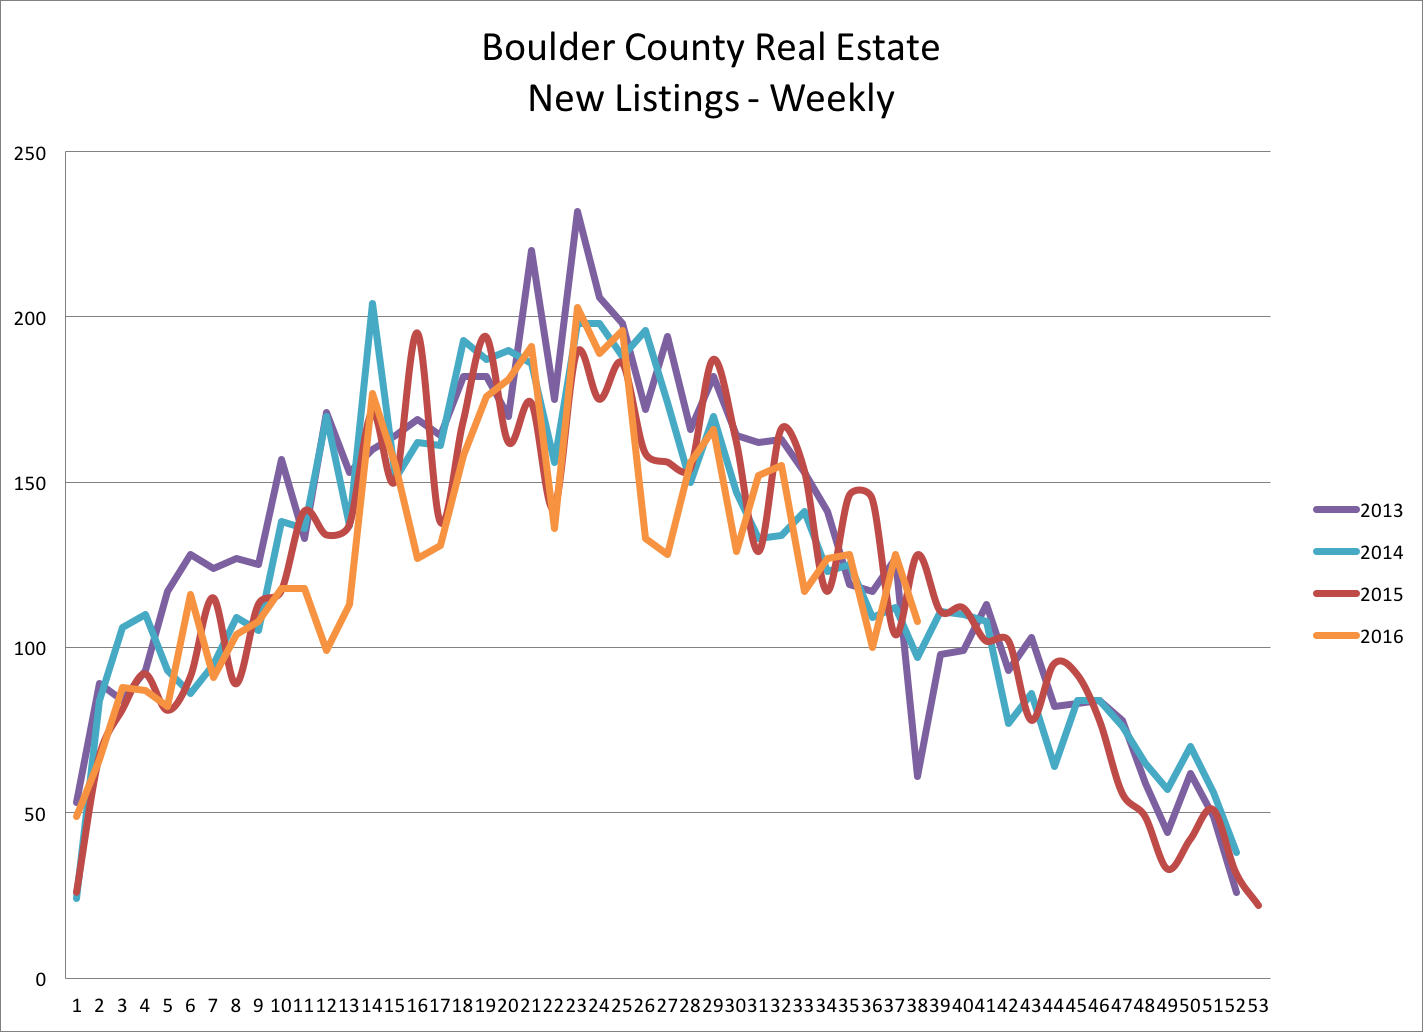
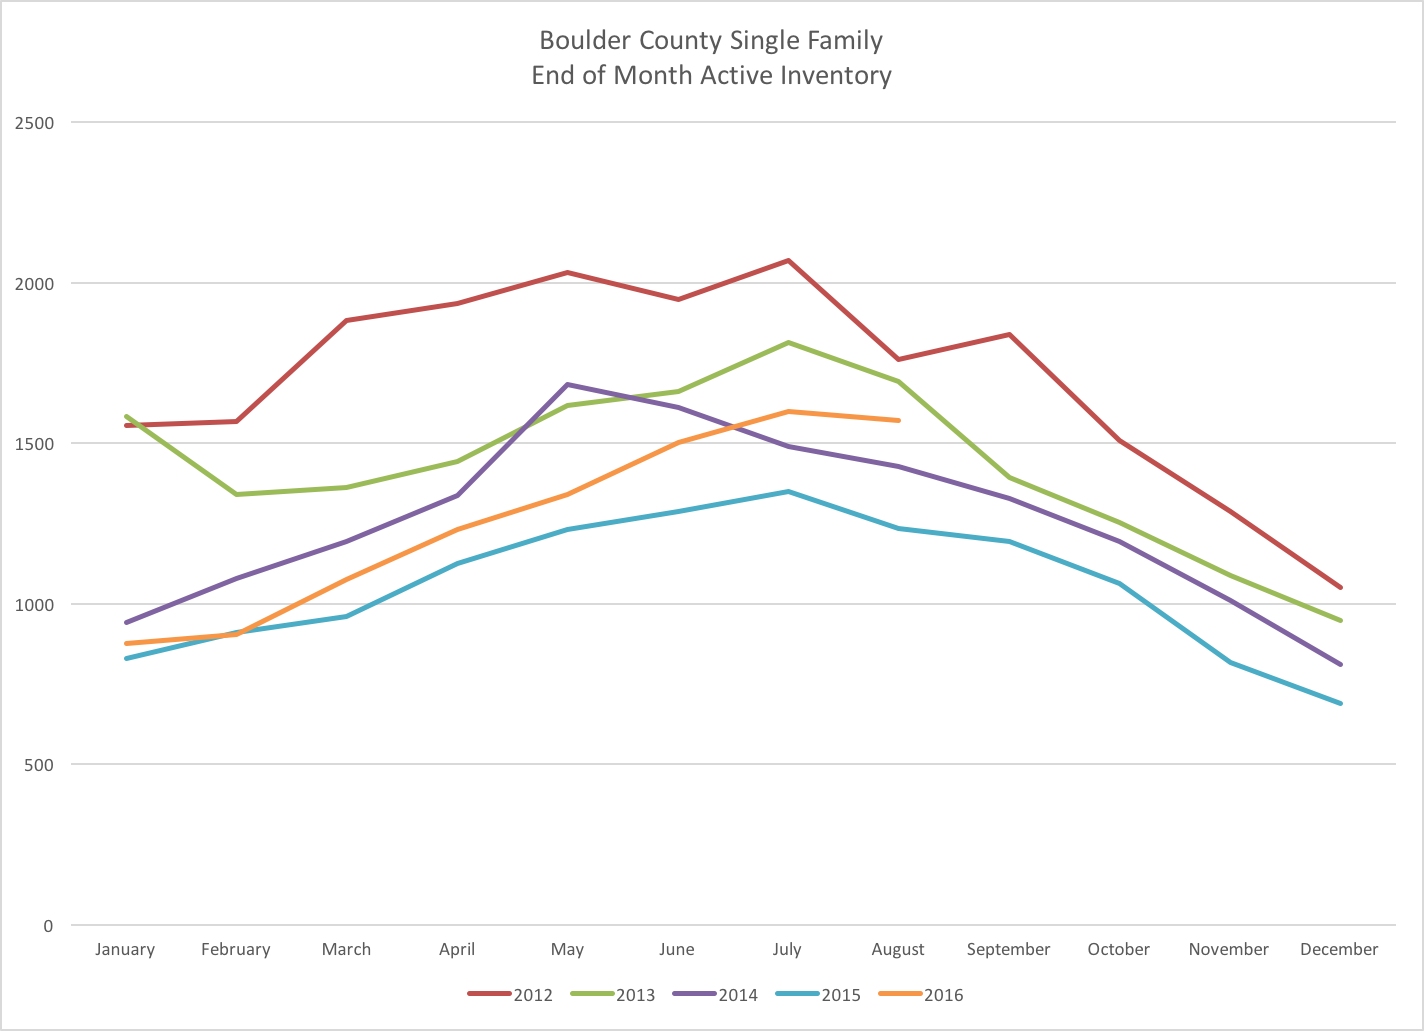
The first graph (below left) shows the number of new listings that have hit the Boulder County market each week over the past three years. The orange line shows that in 2016 we have had fewer listings go on the market. This continues the trend of fewer homes listed. However, the graph on the right shows the end of month inventory of properties for sale in Boulder County. We have more inventory this year than last. Fewer new listings, but higher inventory….how does that happen? Fewer sales. (note you can click on any graph and see it in a larger format)
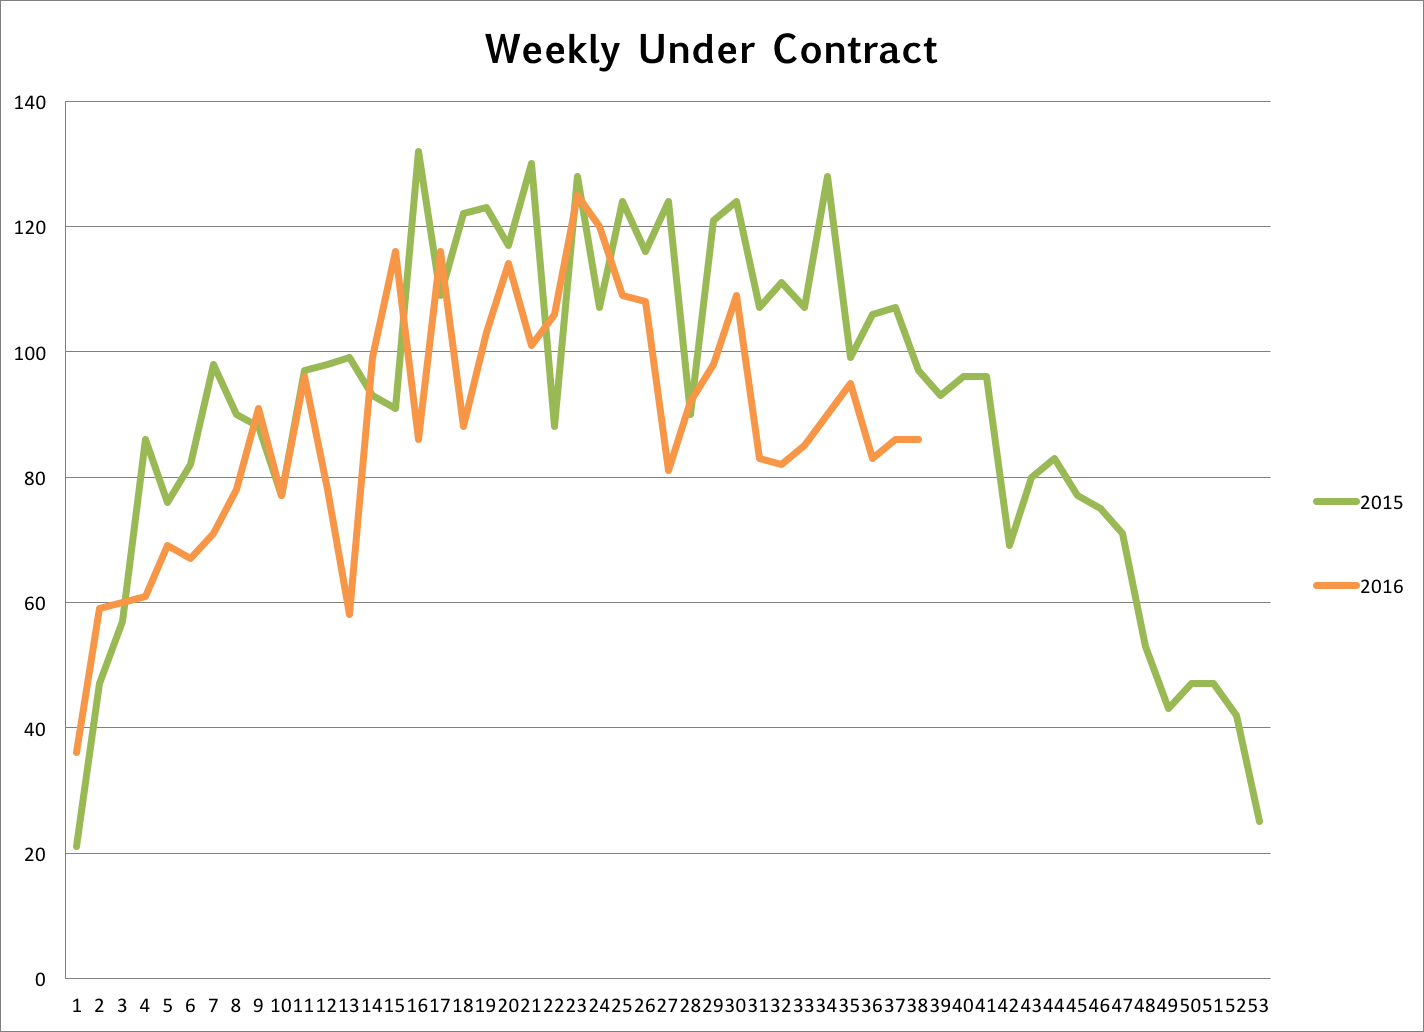
The number of properties that go under contract is a good predictor of future sales. Over the last few months (as seen on the graph below and to the left) the market is definitely slower than it was a year ago. Fewer houses are selling. The graph on the right shows monthly sales through the end of August. Given the recent under contract activity we can predict that we will again lose ground in terms of total sales to 2015. At the end of August we were down 10% year to date.
Absorption Rate by Price Range
A good statistic to gauge market strength is absorption rate. It is basically tells us how long it would take to sell all of the available listings in a given price range if the sales rate remained equal and no new listings came on the market. The math: find the monthly sales rate by dividing the total sales over six months by six; then divide the total number of active listings by the monthly sales rate you just came up with. For example the current absorption rate for properties priced $250,000 and below is 2.33 months. That number steadily climbs up to 5.38 months for properties between $1 and $1.5 million and then jumps to 9.94 months for properties listed above $1.5 million. This large number in the luxury sector represents a high inventory of listings since last year we had record sales in that price range.

by Neil Kearney | Mar 1, 2013 | Boulder County Housing Trends, Statistics
To say the real estate market in Boulder is busy is an understatement. The market is red hot! New  listings are getting as much attention as piece of cheese at a mouse convention.
Here is some hard evidence which illustrates what is going on in the market. The list below shows the new listings that have come on the market in the city of Boulder priced under $600,000 over the past two weeks. As you can see there have been 16 new listings. Of those, 11 are already under contract. Of the five that are not under contract; two are brand new listings today, one was listed yesterday, one was listed four days ago and the worn listing of the bunch has been listed a whopping eight days! On the chart below A/B under the status column signifies that is under contract but taking backup offers.
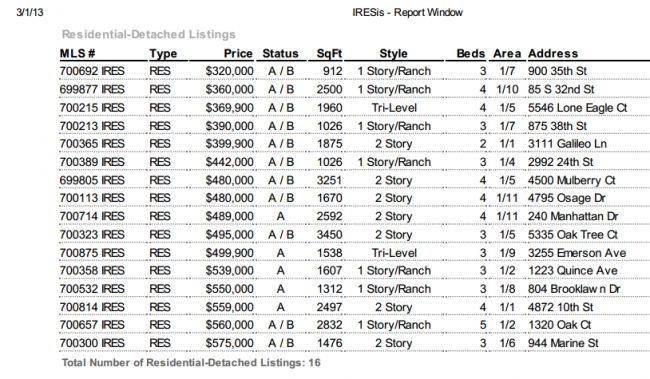
After a long cycle where buyers have been in the drivers seat the market has clearly shifted to a sellers market. Let me give you a few examples of seller confidence as seen in the listings above.
875 38th – This home is a nicely maintained and modestly updated home in the starter home neighborhood of Baseline Subdivision. Over the past year the average price per square foot in this neighborhood has been $312. The price per square foot on this listing came to $380. The previous high over the past year on a per square foot price was $362. This home was listed on February 21st and it was marked as under contract by February 25th with what the listing agent says is a “close to full price offer”.
804 Brooklawn – This is basically a vacant lot listing. The house probably won’t be worth saving since it sits on a very large lot. The house across the street is under contract and is listed for just under $1.1 million. This home closed on February 19th for $430,000. It came back on the market four days ago for $550,000.
3255 Emerson – This house is brand new on the market today. They know the market is hot. They have announced in the listing that all offers will be presented Sunday at 4 pm. I wonder how many they will get?
We put a house on the market last week and within four days we had four offers. The property went for well above list price and we have a backup offer.
 What is causing this dramatic sellers market? Buyers are out in force ready to buy and the supply of homes is no where near satisfying the demand. At the end of January there were 1171 properties on the market in all of Boulder County which didn’t have a contract on it. As we progress toward spring you would expect more properties to be available but the opposite is true. As of this morning, exactly four weeks later there are 900 single family residential listings on the market available.
How long this will last will be anyone’s guess, but for the moment we have extreme competition for the best new listings and that competition is causing prices to rise.


