by Neil Kearney | Jan 27, 2017 | Boulder County Housing Trends, Statistics
If you are looking for the entire statistical overview of the Boulder real estate market in 2016 check out this comprehensive post and then this one about sales by price range. After working on those year end reviews articles I realized that I had some random charts that may be of interest. These include DTO (Days To Offer); Average Negotiation; and Sales by Area throughout Boulder County.

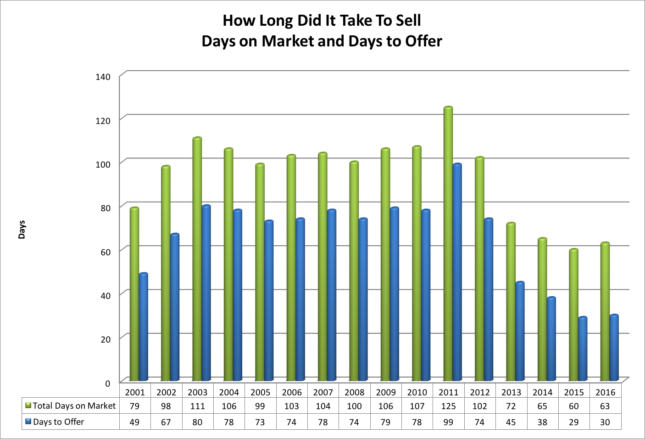
Both Days on Market (DOM) and Days to Offer (DTO) are presented in the chart above. I like DTO better because it gives a more reliable read of the strength o of the market. Days To Offer tells how long it took for an average listing (in this case all residential properties in Boulder County) to go under contract. In 2016 it took on average just 30 days to go under contract. This was one day longer than a year ago but less than half as long as the 15 year average of 66 days. We have been blessed with lots of buyer demand.

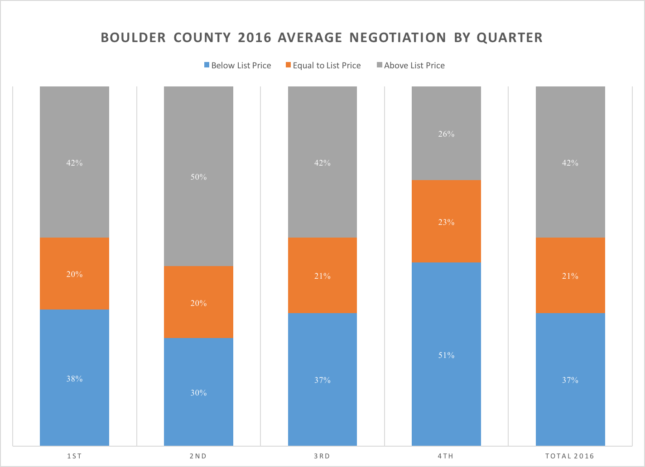
The graph above takes a bit of explanation. Each column represents a quarter except for the one on the far right which represents 2016 as a whole. The graph is measuring the relationship between sales price and listing price. The blue section represents those properties that close below list price (at a discount). The orange section represents those properties that sell for exactly list price. The gray section represents those properties that sell for above list price (at a premium). The data included was both single family and attached homes in Boulder County.
Throughout the year the properties that sold at list price (orange) were consistently between 20% and 35%. In order to get a good sense of the strength of the market look at the gray sections. In the first quarter of 2016, 42% of properties sold for above list price; in the second quarter it was 50%; in the third quarter 42% sold at a premium; and in the fourth quarter the market slowed and just 26% of all sales closed with a price above the list price. On average for the year, if a property did sell at a premium it sold for 4.7% above the list price.
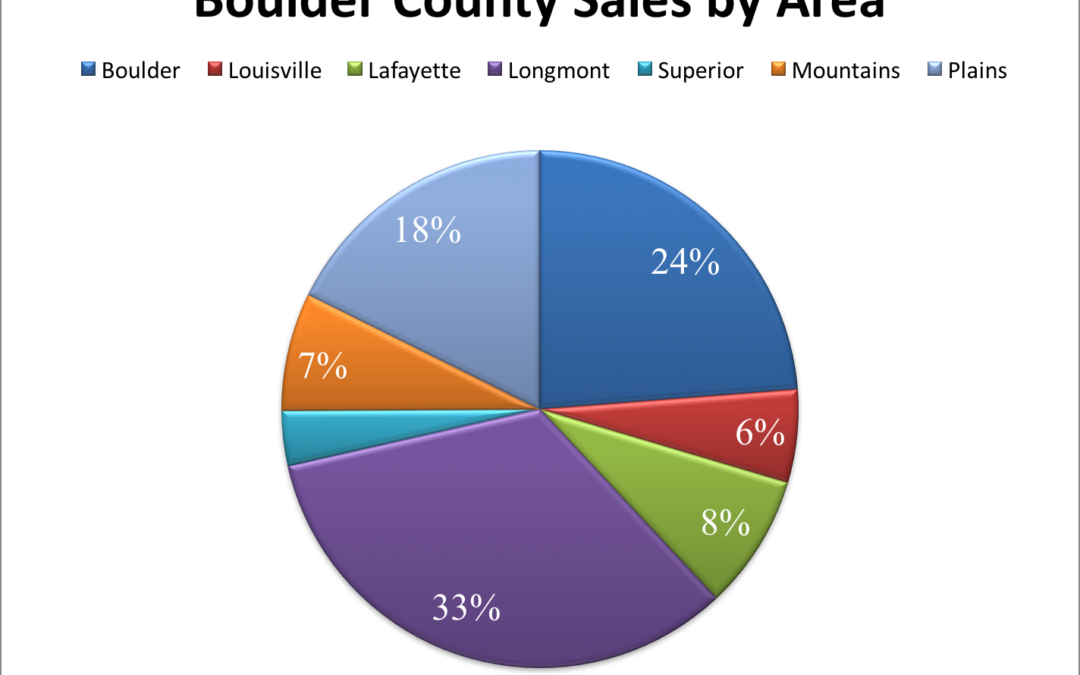
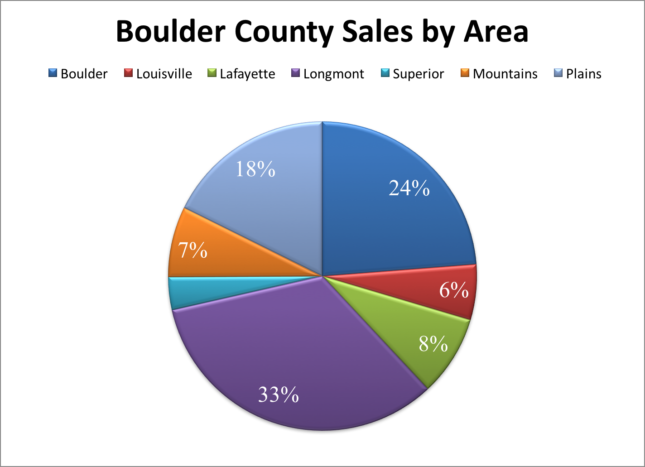
 The pie chart above shows the percentage of sales that took place in each of the major communities during 2016. It’s interesting that Longmont has the most sales even though Boulder has more population. Here is a quick comparison of the percentage of the county population and the percentage of the county’s real estate sales.
Community Population % of County pop. % of County sales
Boulder 103,166 33% 24%
Longmont 89,919 29% 33%
Lafayette 26,784 9% 8%
Louisville 19,588 6% 6%
Half of Boulder’s housing units are rentals. This is one explanation why it’s sales lack its population as a percentage.

by Neil Kearney | Mar 17, 2015 | Boulder County Housing Trends, For Buyers, For Sellers
 The Boulder real estate market is currently characterized by low inventory and good buyer demand. It’s a sellers market. Many home buyers are finding that the houses that they are interested in buying are also coveted by other buyers. This leads to a multiple offer situation. A great situation to be in – if you are a seller. But for a buyer it’s a difficult situation. To see some perspectives on multiple offers from both sides, read this article.
In our area, multiple offers are most often handled in this way- the listing agent receives an offer and then lets all other agents who are showing or have showed the house know that they will be presenting the offer at a certain time and day. If another offer does come in, the first offering party is advised of the second offer and is offered the opportunity to revise their offer. For the buyer, the information available is usually only limited to the number of offers that will be looked at and when to expect an answer. This year many homes are being listed knowing that there will be much initial interest. They state clearly in the MLS listing that showings start on Saturday and all offers will be reviewed on Monday. Being the first to show the house or the first to submit an offer doesn’t seem to have any advantage.
This information gap leads to much buyer anxiety. How much should we offer? What are the other offers? Are we crazy to offer $X? Will there be another better house coming down the line that is less hassle and not priced so high? Will it appraise if we go over full price? It goes on and on and each of these questions are rhetorical.
Since I can’t answer these questions for my clients with any clarity. I rely on experience to advise them the best I can and ultimately I leave it up to them to pick a number. Sometimes we use an escalation clause to calm the anxiety a bit and to hedge an overpriced offer. In the end it’s an inexact science and the results favor the bold.
So far this year (through March 16th) there have been approximately 728 sales in Boulder County. In 27% of these transactions the buyer paid more than the listing price for the property. I can only assume that most of these 198 transactions had multiple offers. So in an effort to bring some data to the unanswerable, here are the statistics from those multiple offer situations.
- The average successful offer over all price ranges exceeded the listing price by 3.4%.
- The highest percentage paid over the list price was 44%. It was a foreclosure that was priced “well” below the current market value.
- The average price paid over list in transactions under $250,000 (39% of all transactions) was 4.42%.
- The average price paid over list in transactions between $250,000 and $500,000 (44% of all transactions) was 2.79%.
- The average price paid over list in transactions over $500,000 (17% of all transactions) was 4%.
- In 37 of the 198 transactions the buyer paid $2,000 or less over list price.
- The average premium paid across all price ranges was $13,010.
- The median premium over list price was $6,600.
- In the City of Boulder the average premium paid for those properties that sold above list price was 4.52%.

by Neil Kearney | Dec 1, 2011 | Boulder County Housing Trends, For Buyers, Statistics
Yesterday, I shared with you how different price ranges are currently selling in the Boulder County home market. Today we are going  to look at the same indicators but today, we will use the data to find out which town has the strongest real estate market.
Under Contract Percentage:
This is simply the number of homes currently under contract divided by the number of homes on the market. The higher the number the stronger the market. The areas that have the highest percentage of homes under contract (Louisville and Superior) also happen to have the fewest homes on the market. Few homes on the market, steady demand = strong market.
- Boulder 14%
- Louisville 24%
- Lafayette 22%
- Longmont 20%
- Superior 25%
- Mountains 14%
- Plains 13%
Absorption Rate:
Absorption rate compares the number of homes that sell during an average month (I use 12 months) to the number of homes currently on the market. For example if on average 10 homes sell per month and there are 120 homes on the market, the absorption rate would be 12 months. Another way of saying it would be, that it would take 1 year to sell all of the current inventory. A low number shows quick turnover and a strong market. During the late fall and winter when many would-be sellers remove their homes from the market the absorption rates are unusually low. Again, Superior and Louisville show the healthiest market and the mountains show the weakest market.
- Boulder 6.9 months
- Louisville 4.3 months
- Lafayette 5.9 months
- Longmont 6.1 months
- Superior 4.2 months
- Mountains 12.4 months
- Plains 9.2 months
Average Negotiation Off Of List Price:
The areas that showed the strongest indicators in the statistics above also had the smallest average negotiation off of the list price.
- Boulder 4.74%
- Louisville 2.63%
- Lafayette 2.65%
- Longmont 2.95%
- Superior 2.84%
- Mountains 6.28%
- Plains 4.78%
Overall Ranking of Strength of Market:
When you average out these results and rank for total strength, here are the strongest real estate markets in Boulder County right now.
1. Louisville and Superior (tie)
2. Lafayette
3. Longmont
4. Boulder
5. Suburban Mountains and Suburban Plains (tie)
Of course more goes into it than just these three statistics. So when you are ready to buy or sell real estate in Boulder County call a professional real estate agent like me. Neil Kearney 303.818.4055

 The pie chart above shows the percentage of sales that took place in each of the major communities during 2016. It’s interesting that Longmont has the most sales even though Boulder has more population. Here is a quick comparison of the percentage of the county population and the percentage of the county’s real estate sales.


