I’m not ready to say that the market has made a turn, but it certainly seems clear that the upward trajectory has slowed over the last few months. Both inventory and interest rates remain low. When that is coupled with strong demand the result is that houses are still selling. In august 49% of closings were for a price above full price. Taken alone that still signals a very strong seller’s market. But when compared to May when 86% of sales were for above list price it isn’t quite as impressive. On average properties sold for 2.9% above list, in May it was 6%. Still a really strong market, but not quite so crazy.
Here is a summary for the month of August in Boulder County (this includes both single family and condo/townhome listings)
Number of sales 533 (down from 565 a year ago)
Median price $630,000 (up from $605,000 a year ago)
The average sale closed for 2.9% above the asking price. (last month it was 4% and it was 6% in May)
End of month inventory of active and under contract homes 1,114 (down 20% from last year)
30% of sales during the month sold for below list price
21% of sales during the month closed exactly at list price
49% of sales during the month sold for above list price
The average premium paid for those sales that closed above asking price was 5.09% (July was 7.5%, June 8.7%, May 9.7%)
There were 10 sales during the month that closed for 15% or more above list price. (36 in July, 72 in June)
Real estate sales in Boulder County continue to be very strong. There were 611 sales in June, which is the highest number for the month since 2015. Year-to-date cumulative sales are up 28% over last year and median prices throughout the county (both single family and attached dwellings) are up 16% from a year ago. On average properties sold for 4% over the list price. For most of the years I’ve been tracking the market, homes sold for at a 2-3% discount. 62% of the sales in July sold for above the asking price. When looking only at those homes that sold above list price, the average sale was for a 7.5% premium. The median premium paid was 9.7%. These numbers are down from last month. Meaning that the bidding wars were a bit less intense.
Key statistics for July:
Sales were up 3.2% from last year. Down a bit from June.
Inventory of active homes is down 28% from last year.
62% of active listings were already under contract at the end of July. Just 400 homes to seriously consider at the end of June.
Prices continue to be considerably higher than they were a year ago. For July only the median price was 16% higher than last July
To view all of the statistics in graphical format with trending scroll through the report below.
Sales Reach High Water Mark Since 2007 – The Average Property Sold for 4% Over List Price
Real estate sales in Boulder County continue to be very strong. There were 625 sales in June, which is the highest number for the month since 2007. It tied the highest sales total for any month over the past nine years with July of 2013. Year-to-date cumulative sales are up 36% over last year and median prices throughout the county (both single family and attached dwellings) are up 21% from a year ago. On average properties sold for 4% over the list price, this is the highest I have seen in my time tracking the local market. Interest rates are up just .3% since January and are just above 3% for the most qualified borrowers. Despite the strong sales, some buyers are showing fatigue in this ultra-competitive market and are starting to pace themselves or deciding to rent and hope for an easier time to buy in the future.
To view all of the statistics in charts along with commentary and trending, view the slideshow below.
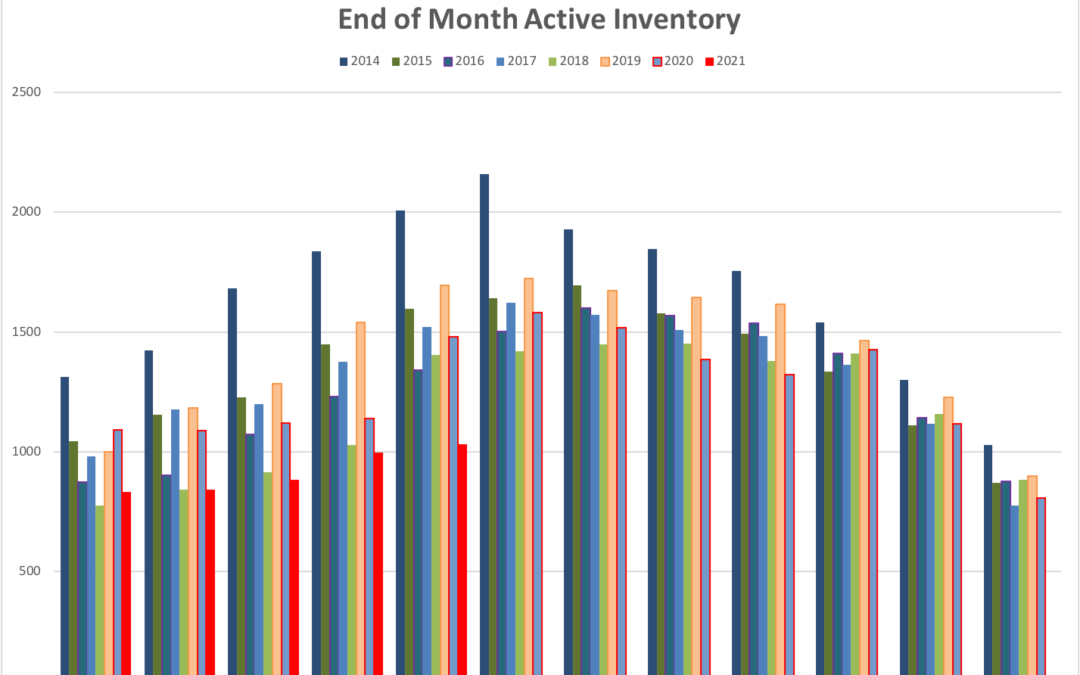
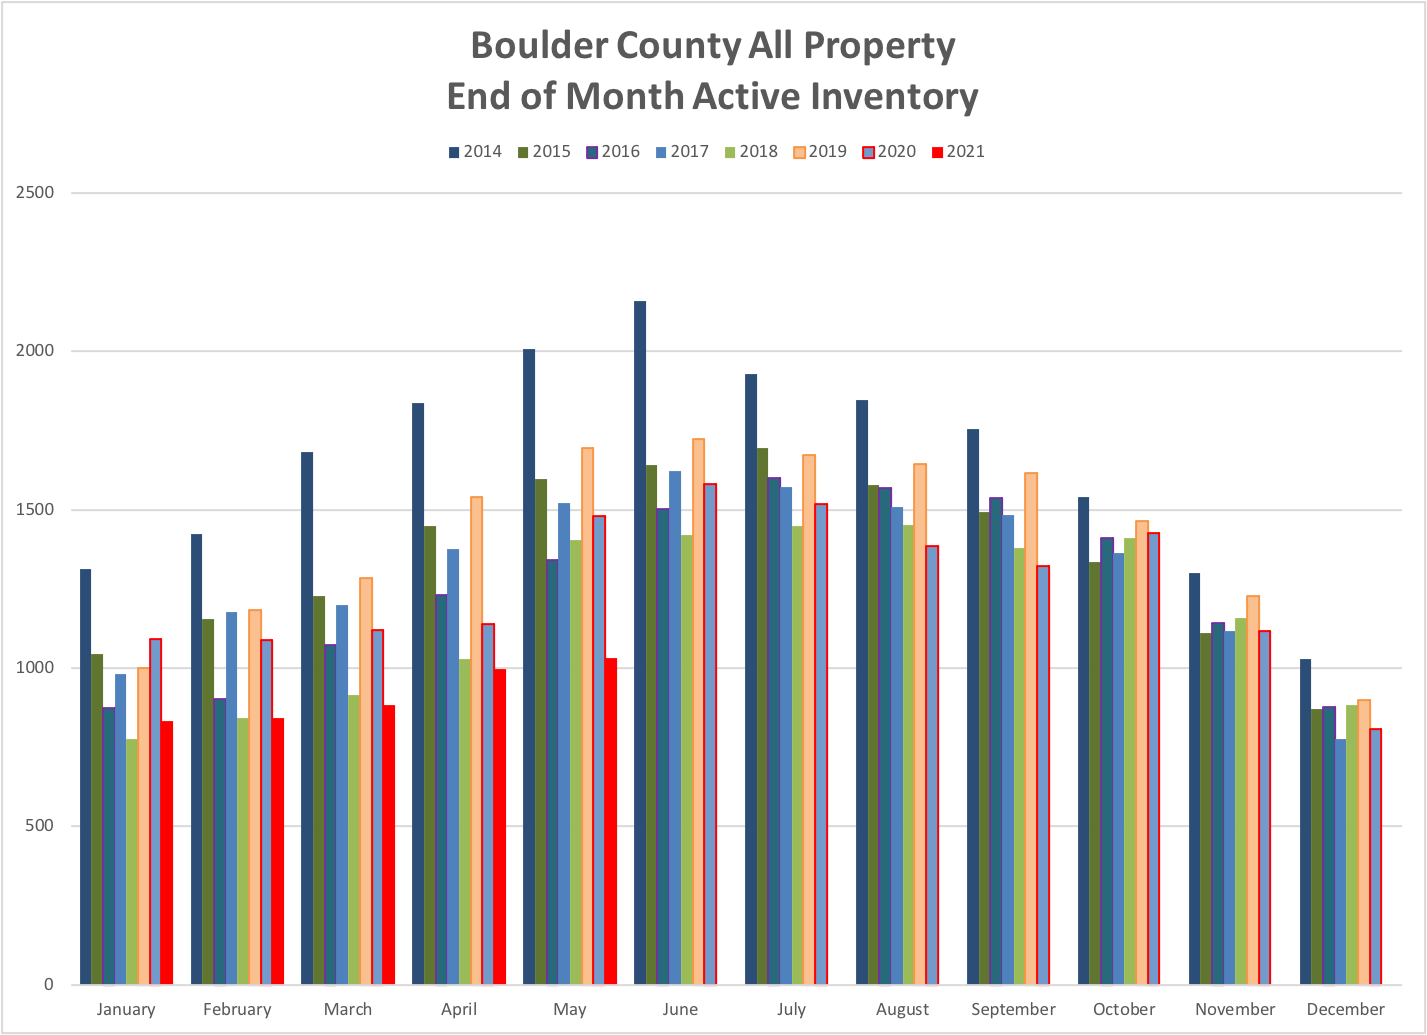
The normal method of analyzing statistics is to look back one year and see how the current month compares. Because of the pandemic, going back one year doesn’t provide useful information. Looking back further we see that total sales are lower than 2019 but slightly higher than May in 2016-2018. Inventory is still very low, and buyers are highly competitive in their offers for the listings that are coming to the market. The graph below shows the month-end inventory over the last 8 years.
Offers are coming in stronger than ever. In May 66% of sales closed for a price higher than the list price. Presumably, multiple offer situations. Of the properties that sold for more: the average premium paid was 9.78% or $69,355, the median was 18.3% higher than list and the top five sales above list price as a percentage were 29%, 30%, 32%, 36% and 50%. In most cases, homes are being listed where past sales justify the price. This means that values are rising quickly, and we are most likely going to see appreciation well into the double digits for the year.
I’m hearing reports from all around the country that the unprecedented market conditions we are seeing in our market are not unique. Prices are appreciating quickly. Competition has escalated and it’s quite common to see buyers pay 12-15% over the asking price. Along with that they are waiving the right to object to low appraisals and limiting or waiving inspections altogether. This is happening at a time when we are seeing fewer new listings coming on the market. Buyers are writing offer after offer and as they get beat out, they find new ways to be competitive and bid higher and bolder the next time around. It’s a frustrating cycle for buyers and a windfall for sellers.
For many buyers and buyer’s agents it’s like beginning anew each week. Scour the new listings, quickly set an appointment, decide which house in which to make an offer and then answer the big question, how high do we need to go on this one? More often than not the listing agent calls, or worse yet, sends a mass email informing of a better offer. Better luck next time! So the search starts anew, maybe with lower expectations and a willingness to go even higher next week.
Scroll through the slide deck showing the latest statistics for Boulder County. The quick change in prices is easy to see.