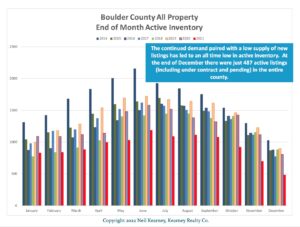
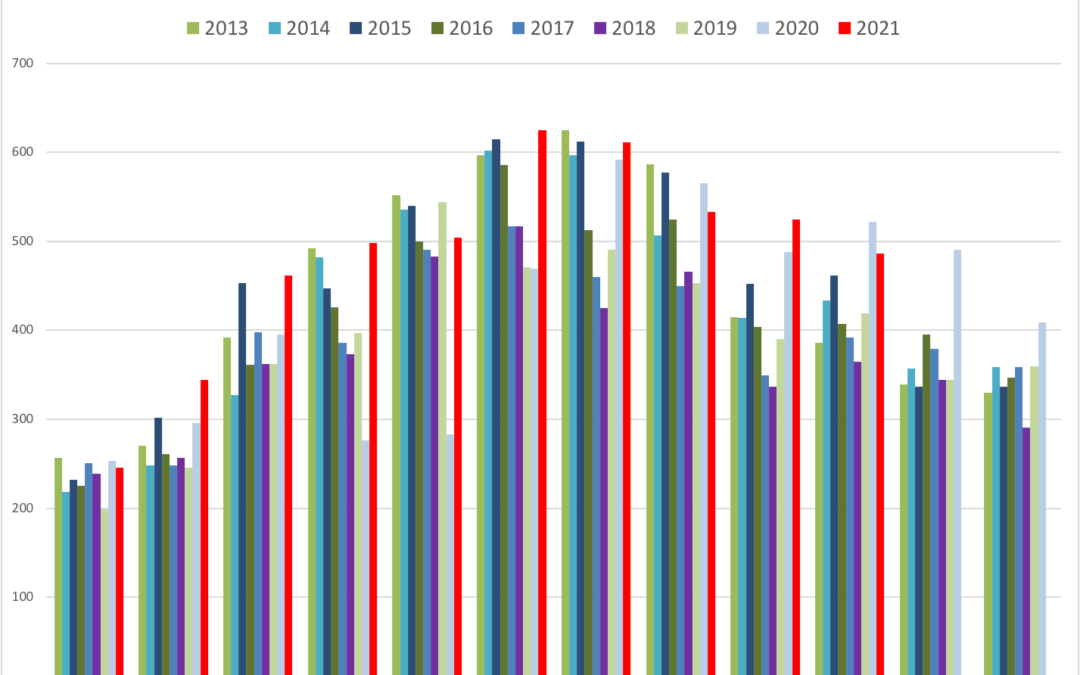
The Boulder County real estate market is still red hot. It seems like the pressure was turned up after the recent wildfires and it’s not easy to buy a nice place. Inventory is down 41% from a year ago and sales are up 7.7% from last January. It’s a very efficient market. Multiple offers on properties are still very common and expected on all well priced properties. Interest rates are rising but instead of suppressing sales, we are seeing buyer’s urgency to buy now increase before rates rise further. The average price paid for all properties is 2% over the list price and for the 48% of sales that closed for a price above the list price, the average premium paid was 6.3%. The property that closed with the highest percentage price in excess of the asking price that closed this month was 28%. For all details watch the video below and view the slides below.
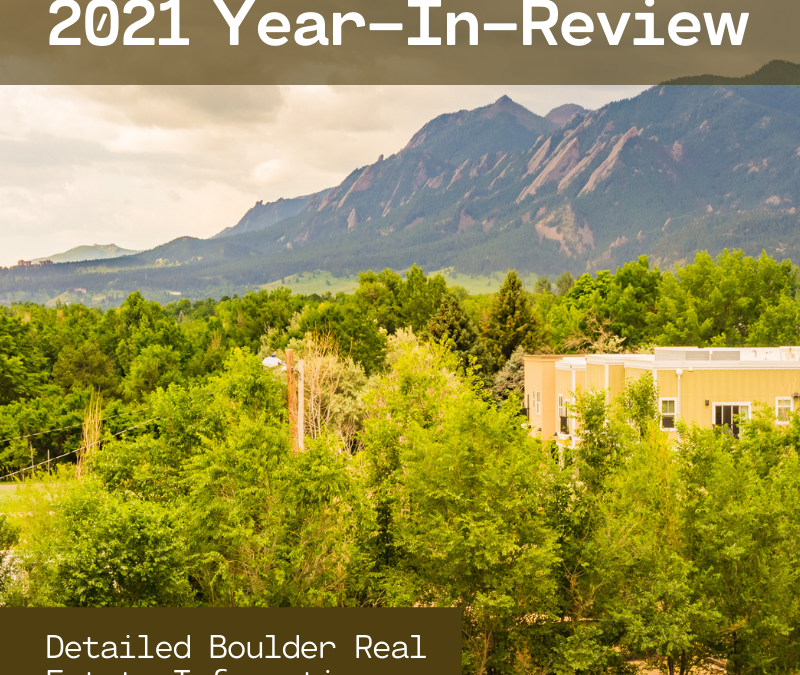
2021 Boulder County Real Estate Market Report The Year In Review The residential real estate market in Boulder County was especially strong during 2021. Even though sales increased by 15% throughout the county the inventory of available homes seemed to never quite...
We are at a strange juncture in the market. The statistics show that sales continue to be strong and that the inventory of available listings is at an all time low. Now with the devastating fires in our community, the questions about the market going forward just got more complicated.
How will the loss of nearly 1,000 homes in Louisville, East Boulder and Superior affect our market going forward?
Will the news of the fires stem the flow of new residents to our area?
Given the high cost of construction, will all of the homes that were lost be able to be rebuilt with insurance proceeds?
Currently there is a huge demand for rental homes. Will the market be able to absorb that demand in a reasonable way?
So many questions and we have a full year ahead of us. It’s really too early to tell what affect the first will have but there will most certainly be immediate demand for rental housing. Some owners who have displaced will be able to purchase right away and go through the long process of recovery in a new home. But those will be the great minority.
Instead of dwelling on what seems to be a very difficult spot many find themselves in, I am looking for and celebrating each bit of good news as families are finding rentals, as help is received, as insurance claims are processed and as our community circles around those who need us most right now.
Click through the slide deck below to see an annotated presentation on the latest real estate statistics for Boulder County.
Even though sales are down 7% from the same month a year ago, the market continues to be strong. When comparing October 2021 to the past I find that this past month was 11% higher than the five-year average. The average price for all sales in Boulder County exceeded the list price by 2.6%. 44% of the sales during the month closed for above the list price. Another example of the strength of the market is that the average premium paid for those that closed above the list price was 5.22%, this was .33% high than last month. The inventory of properties on the market is 35% lower than it was a year ago and last year was already historically low.
Below are a few key charts. Below that is the full annotated slide deck showing all of the key statistics compared to past years.
As always please let me know if you have a specific area or price range you would like me to research feature.
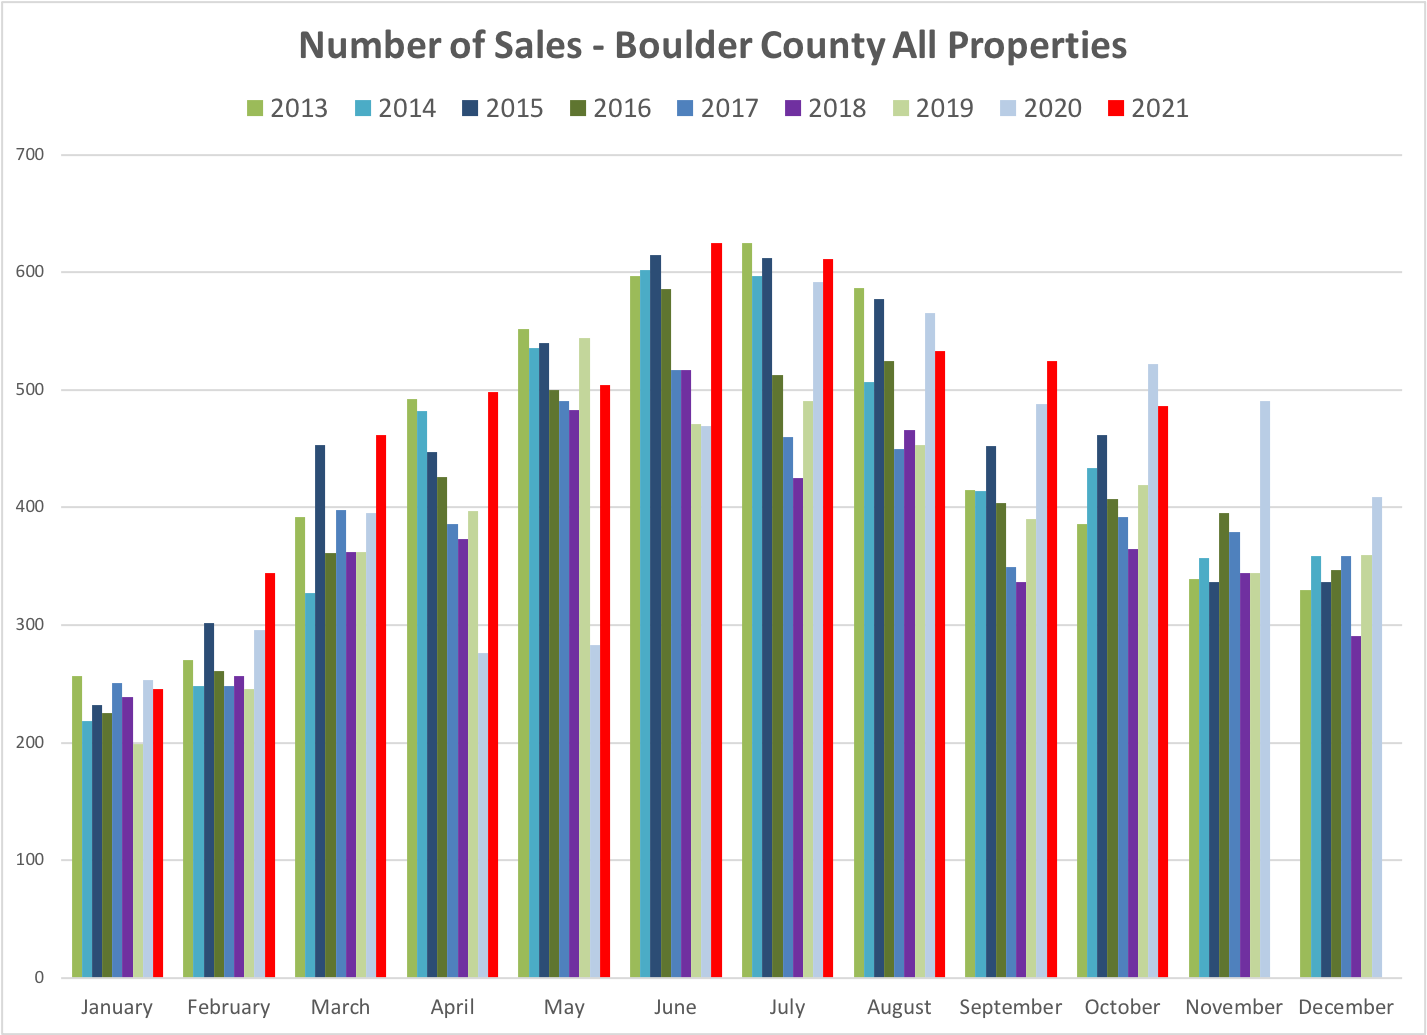
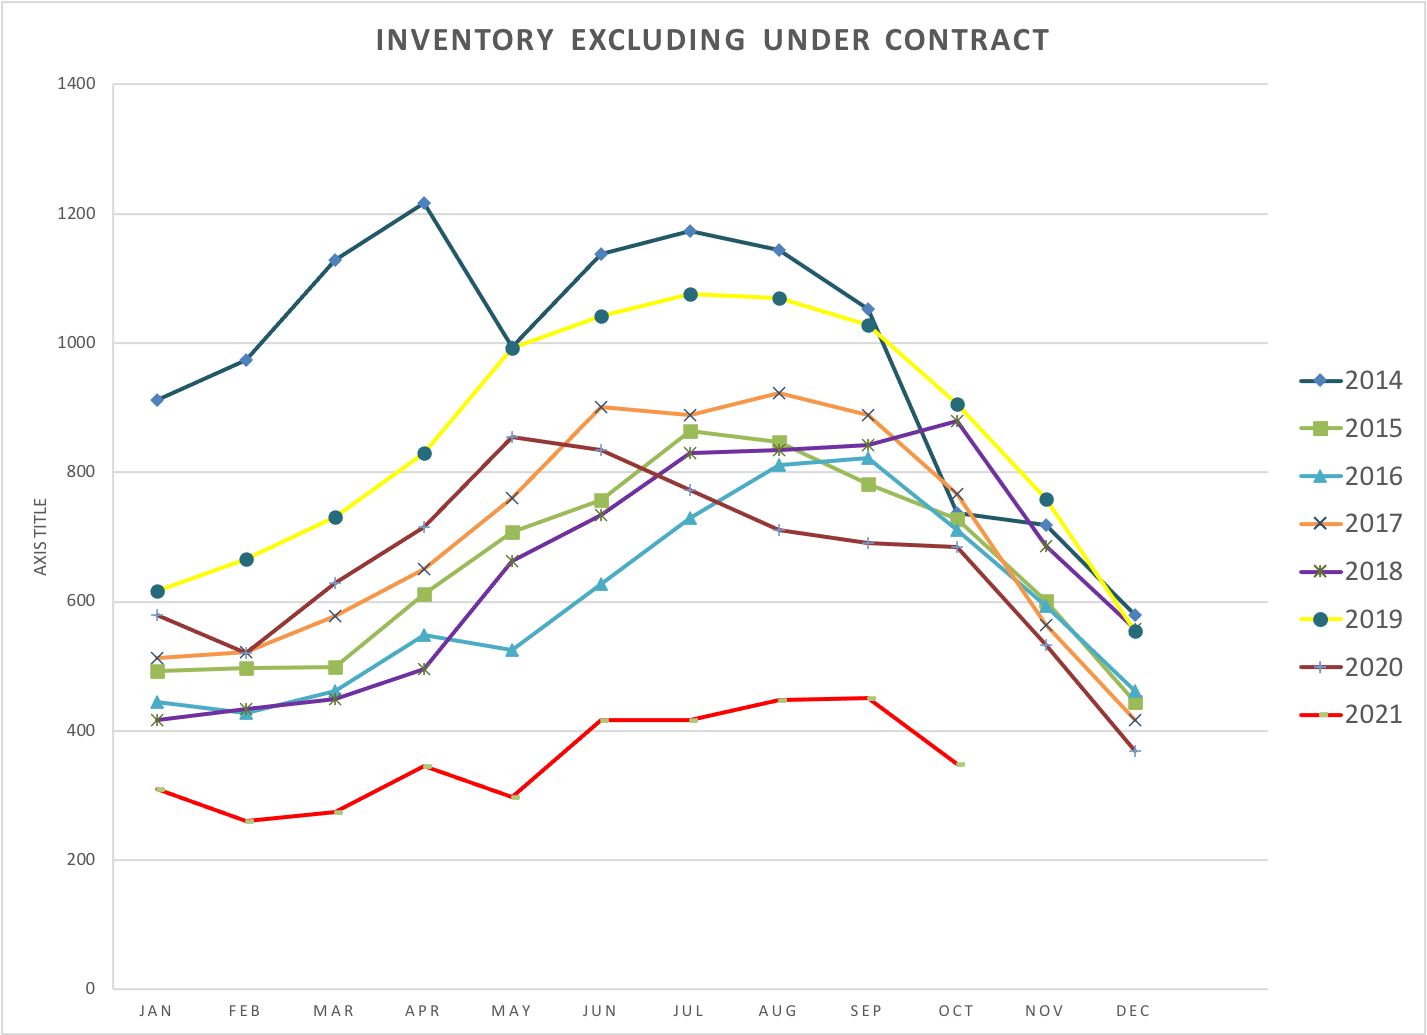
The market is showing some good resilience and strength as we head into the 4th quarter. I started tracking sales on a monthly basis in 2004 and sales this September were higher than in any other September during that 17 year stretch. Inventory is holding steady at a very low level. In September 48% of the sales sold for over the asking price. The average premium paid for those that went for over the list price was 4.89%. Compare this to May when the average premium paid was 9.74%. The market is still strong but the strength isn’t quite so deep. Some houses are still garnering a lot of interest and are selling right away for well over asking price and others are sitting on the market for awhile. The average sale in Boulder County last month sold for 1.3% over the asking price.