by Neil Kearney | Jun 7, 2016 | Boulder County Housing Trends, Statistics
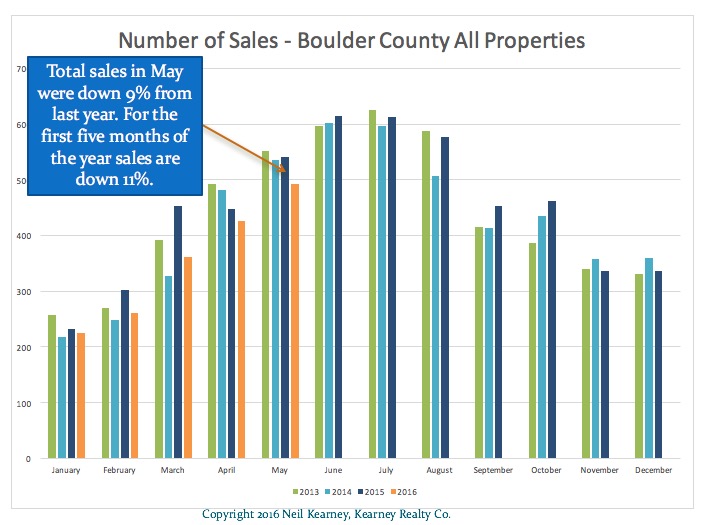
Boulder Real Estate Statistics for May 2016
This is the busy time of year. Buyers are out looking, home sellers who have been prepping their homes all spring are putting them on the market. There is a lot of activity! However, the trends I have been watching over the past few years are continuing; low inventory of available homes and high buyer demand – which are resulting in higher prices and fewer sales.
Here are a few highlights from the slideshow/report below.
- Through the end of May sales are down 11% for the year.
- Inventory is down 45% when compared to two years ago.
- 53% of the homes available on the market at the end of May were already under contract.

by Neil Kearney | Apr 19, 2016 | Boulder County Housing Trends, Statistics
The major themes for the real estate market in Boulder County have been constant over the past three years; low inventory, high buyer demand and rising prices. During the first quarter and the month of March in particular these themes were exasperated. There are many buyers out there and the percentage of active homes that are already under contract is still over 50%. So why were sales down 20% in March and down 14% year-to-date? Low inventory. There just are not enough houses out there on the market to satisfy the demand in the market. So when a house does come on the market it gets multiple offers. For the quarter homes sold for 99.35% of the list price throughout the county but houses sold for above list price in Boulder, Louisville, Lafayette, Erie and Gunbarrel. It’s a good time to be a seller!
To see all of the real estate statistics for Boulder County, check out the slideshow below.

by Neil Kearney | Mar 9, 2016 | Boulder Real Estate, For Buyers, For Sellers, Visiting Boulder
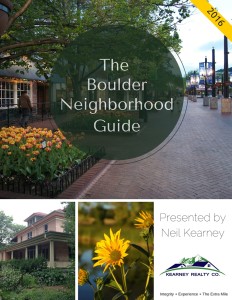 Boulder Neighborhood Guide
I realized a few years ago that people coming from out of town were having a hard time characterizing the different neighborhoods within Boulder. In response I created the Boulder Neighborhood Guide. In this report I have split Boulder into eleven different areas and present the lifestyle highlights, schools, shopping districts, local recreation and real estate statistics for each area. If you’re interested in learning more about the different neighborhoods within the City of Boulder this is your guide.
Click this link to view and download the report. Boulder Neighborhood Guide 2016
It is recognized that Boulder is a great place to live but the neighborhoods in Boulder are a bit hard to peg. Boulder was developed over time in a piece-meal fashion. The result is that many of the neighborhoods are only a few hundred homes in size. It is common to have two adjacent neighborhoods developed at different times and with completely different price ranges. While this report is not comprehensive, it will give the reader valuable information from which to start understanding the real estate market in Boulder. I will highlight the major neighborhoods in each area.
Here are some highlights from within this years report.
Last year homes in Boulder County appreciated roughly 13.52%. But the appreciation varied between areas and price ranges. Within Boulder neighborhoods as I have split them in the report gains in median prices ranged between 6.6% to 35% depending upon the area. Here is the list of neighborhoods sorted by median price appreciation last year:
- Wonderland Lake / Dakota Ridge = 35%
- North Boulder East = 28%
- North East Neighborhoods = 28%
- Whittier = 24%
- Chautauqua / University Hill = 16%
- Gunbarrel = 13%
- Retail / Industrial Core = 12%
- South Boulder / Table Mesa = 11%
- East Boulder = 7%
- Newlands – 6.7%
- Mapleton Hill = 6.6%
A Few Notes: Wonderland Hill / Dakota Ridge is in the far NW portion of town and this is where there are the newest houses coming online. It is also west of Broadway which always means premium prices. Newlands and Mapleton Hill have some of the highest priced real estate in Boulder. The luxury market did not increase in price as much as other, lower priced markets so those areas saw the smallest average appreciation.
Click this link to view and download the report. Boulder Neighborhood Guide 2016
by Neil Kearney | Jan 14, 2016 | Boulder County Housing Trends, Statistics
2015 Boulder County Real Estate Market Report Overview 2015 was one of the most interesting years in the Boulder County real estate market since I have been tracking it. Although inventory of available homes was very low throughout the year, sales increased by about...
by Neil Kearney | Oct 16, 2015
VISITING BOULDER COLORADO If you have plans to visit Boulder you will need to know where to stay, what to do , where to eat and where to go. This page will help you answer all of those questions. The information below is a mix of information developed by me and...

