January is normally a slow month for closings. This year was no exception. However, the sales this past month were at the lowest level since 2009. The flow of properties going under contract is still very low, but there are still sales happening every day. Inventory continued a slow climb from the all-time lows in 2022, but the flow of new listings is lower than recent years. In general, prices have plateaued temporarily and for the month of January they are just a bit below where they were a year ago. See all of the statistics and graphs in the slideshow below.
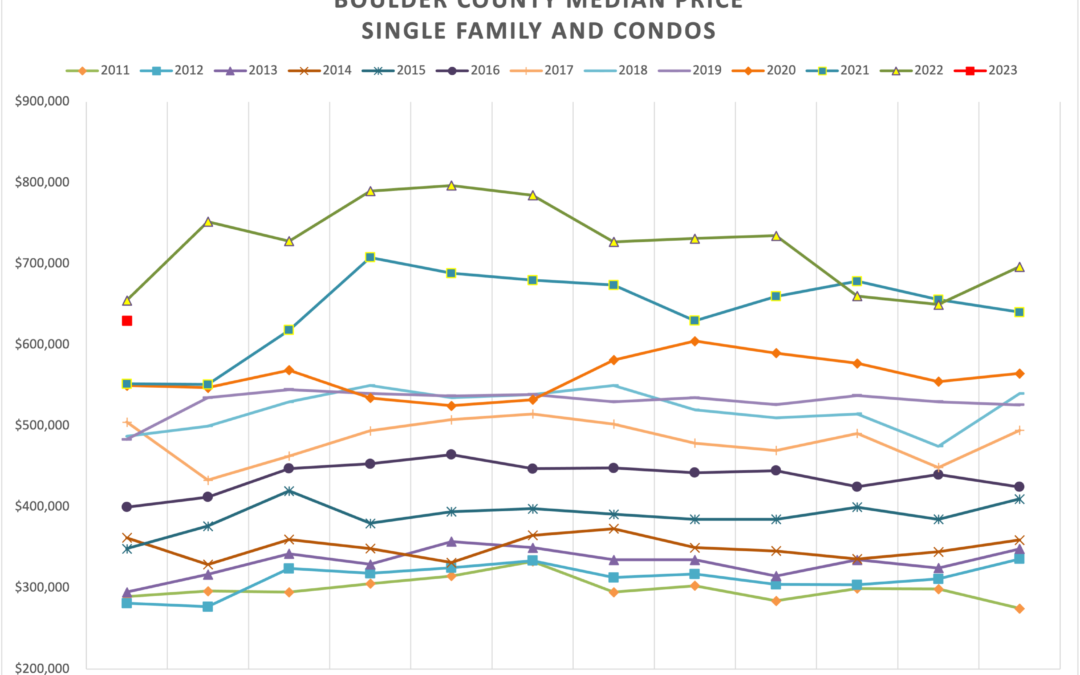
December is one of the slowest months in our local real estate market. Because of potential sellers waiting until after the holidays to list their homes and others deciding to withdraw their homes from the market, inventory normally drops. This month was no exception. Inventory in Boulder County dropped from 960 properties to 690 properties on the market. This is lower than every other year except last year. Sales also dropped by 32% this month compared to last December. This is the seventh straight month that recorded drops of 20% or more compared to the same month the previous year. Despite the super busy spring, sales ended up the year down by nearly 24% compared to last year. Prices are hanging in there. Despite a slower second half of the year, median prices were up 12% during 2022. A video recap is below and at the bottom is a full slideshow with all of the statistics.
After reviewing the latest real estate statistics for Boulder County it’s clear that the market has shifted. But it’s also clear that the slowdown hasn’t been as dramatic as it could be. Sales are down 23% for the year and have been down nearly 40% on a month over month basis over the past two months but inventory isn’t increasing as much as one would think. Interest rates are not only discouraging potential buyers as they call off home searches, they are dissuading sellers from selling as well. Sellers are reluctant to sell because a majority of them would be trading in their current, very low interest rate for a higher rate if they were to sell and then buy a new home. As a result of the relatively low inventory sales have dropped but prices have been resilient so far.
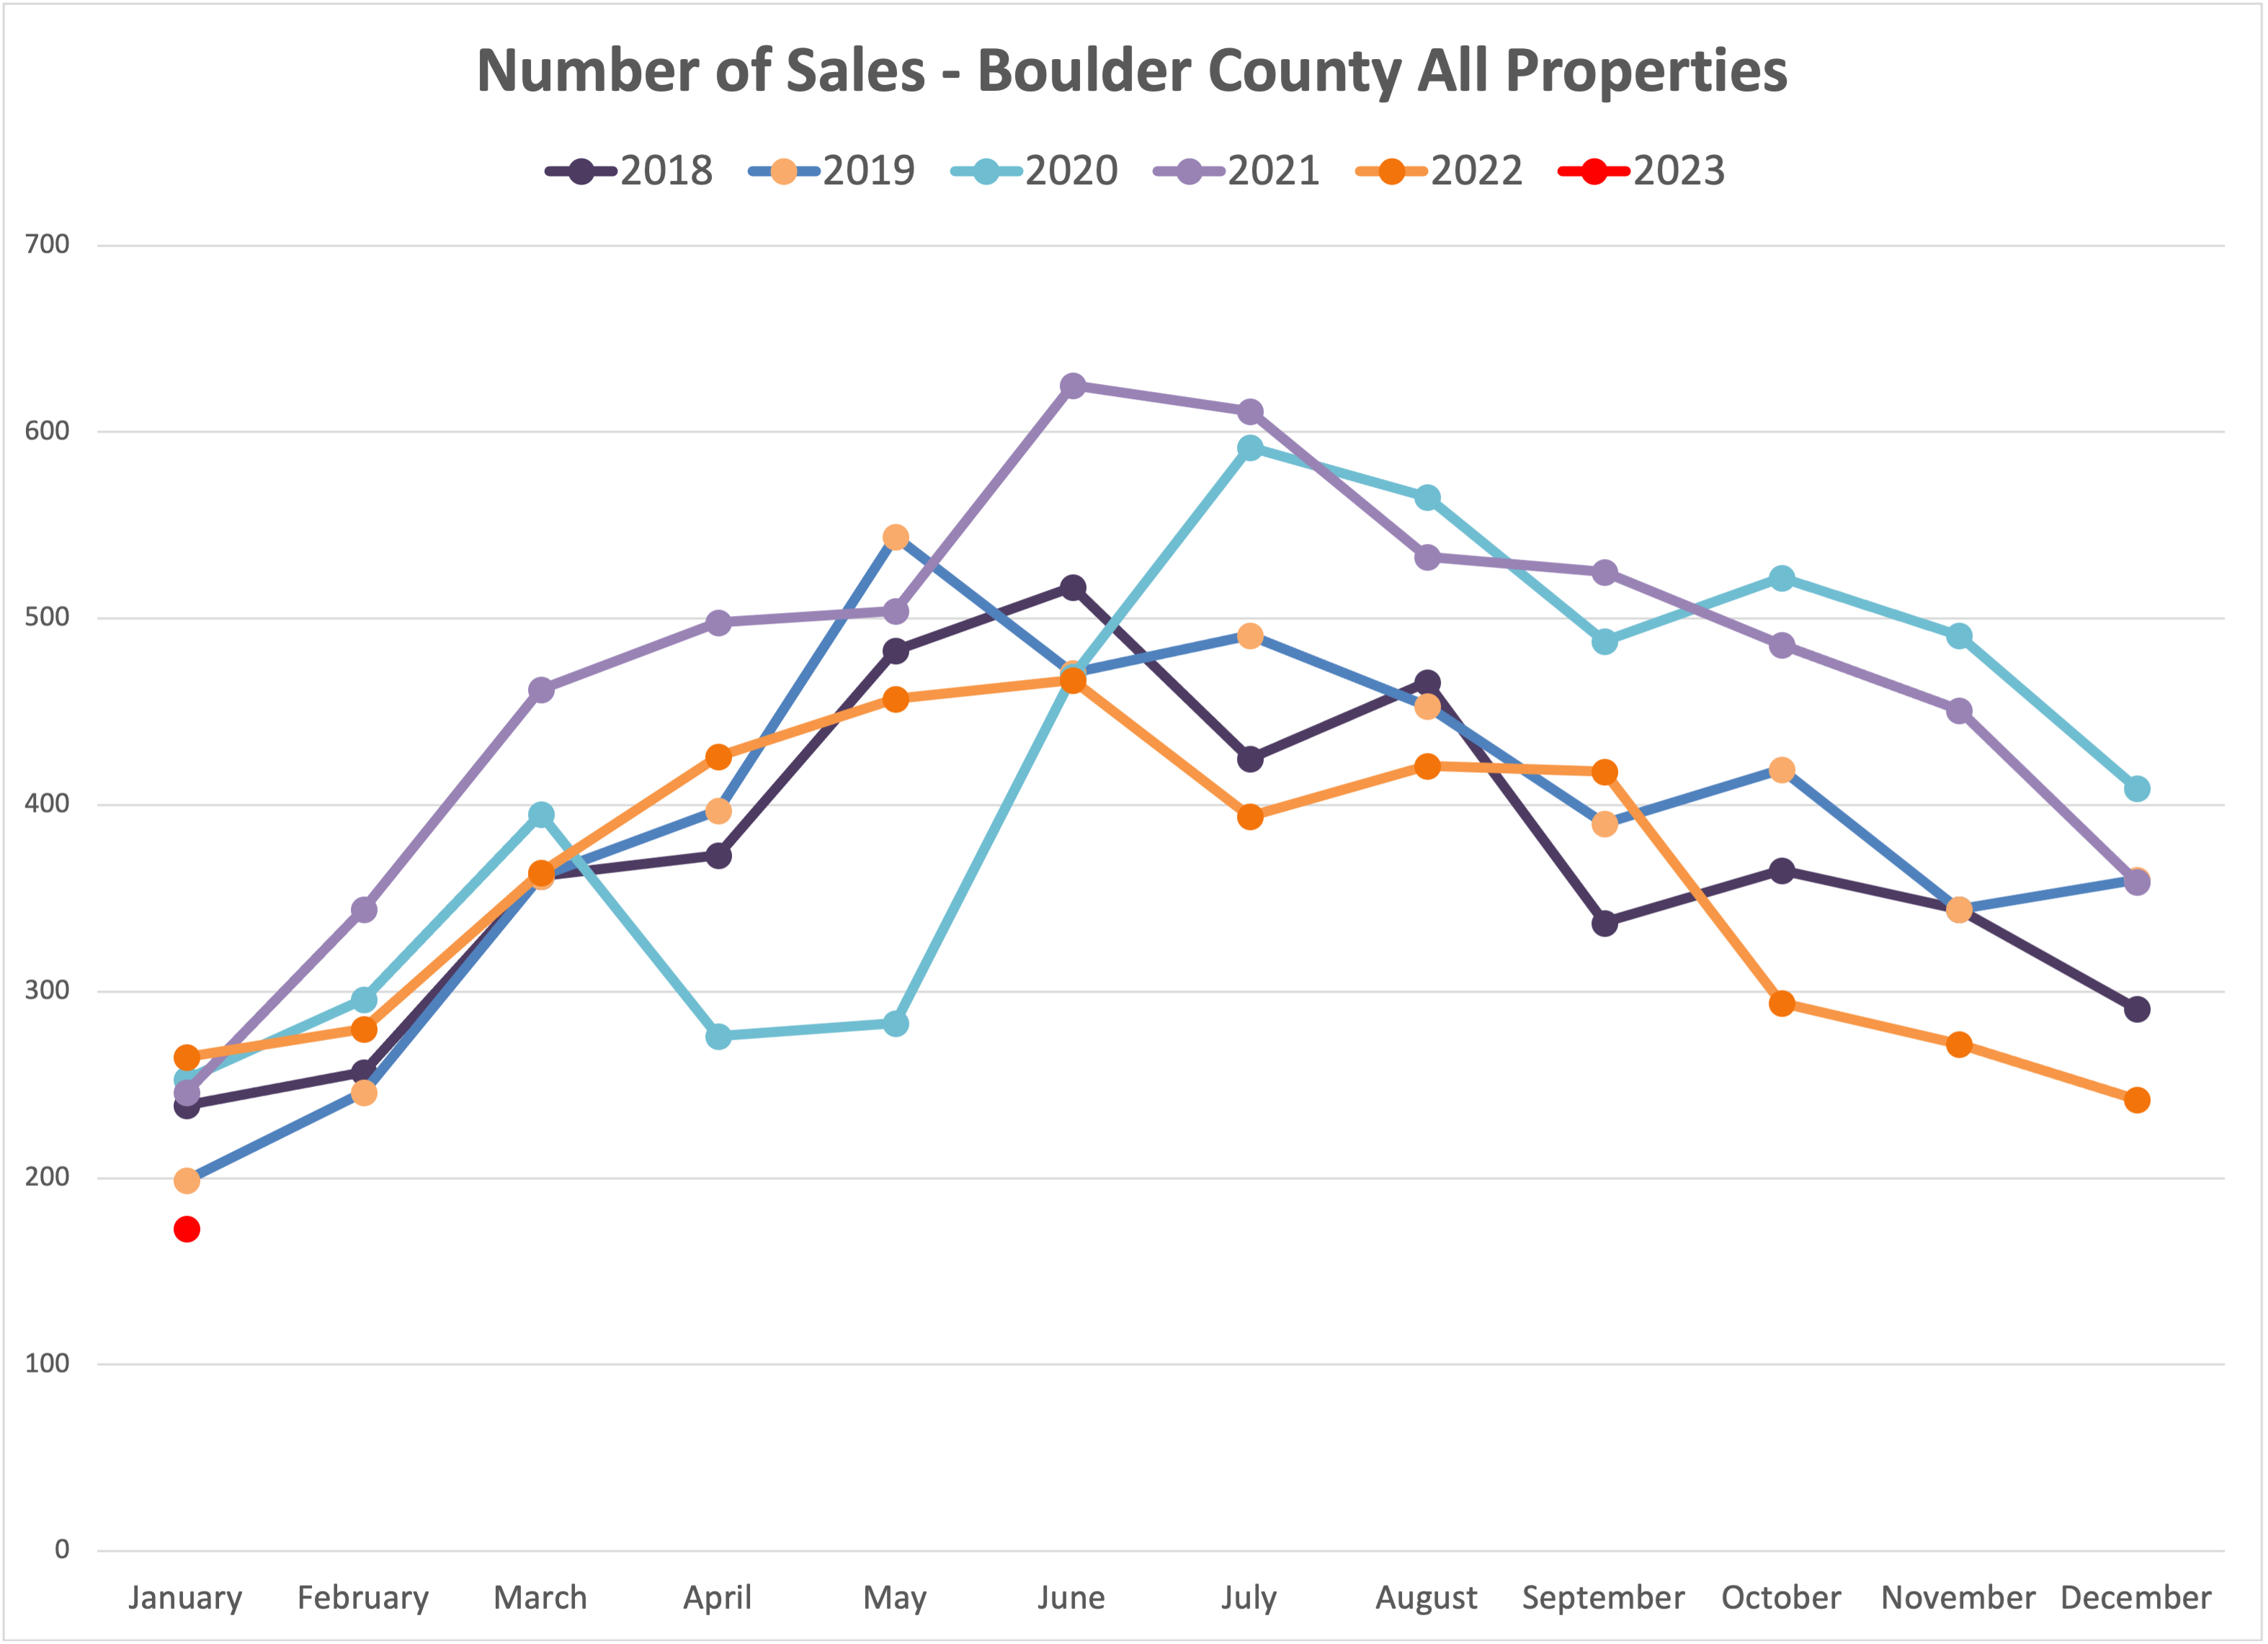
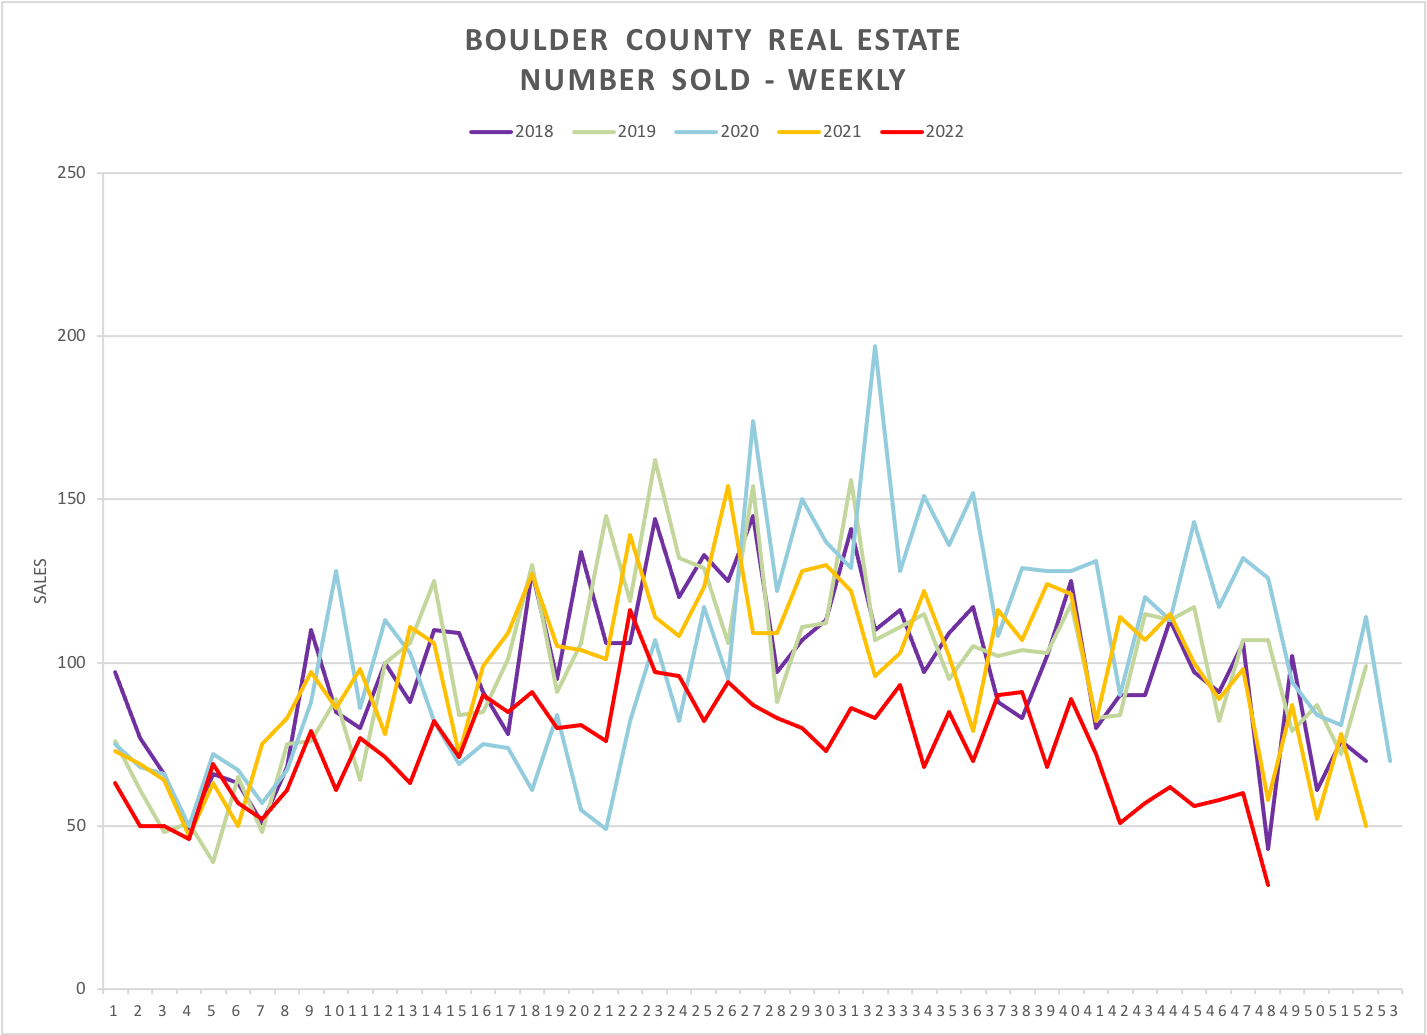
The number of sales in Boulder County is down 23% for the year. Since June sales have been at levels that are the lowest in five years.
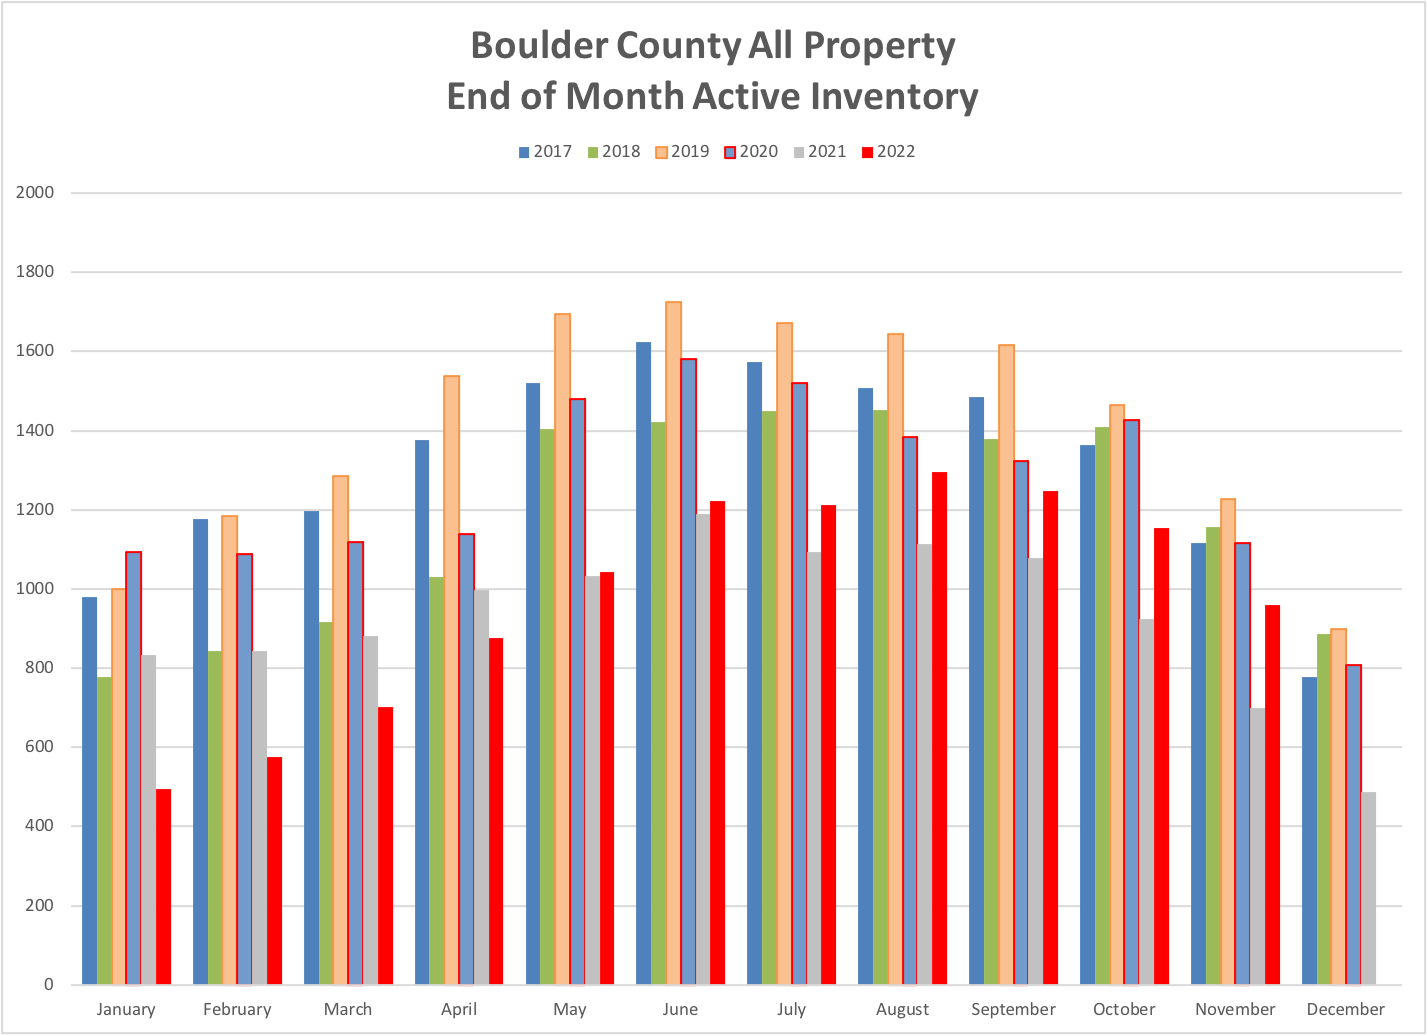
Since June sales have decreased by 30% and the time it takes to get an offer have doubled but inventory is holding a normal seasonal pattern.
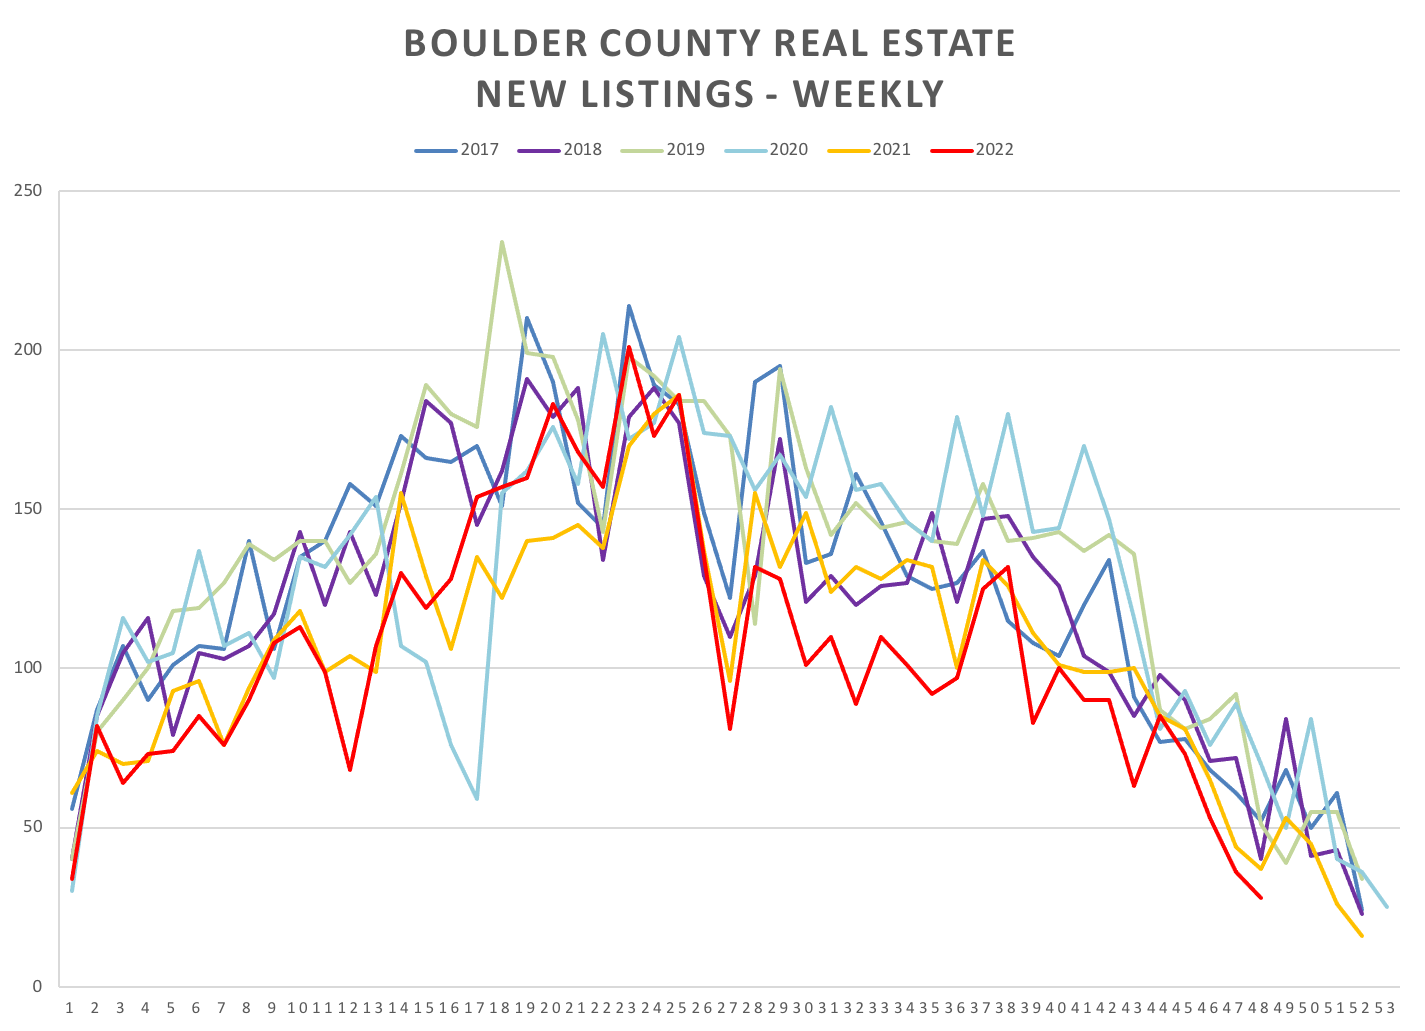
As the full effect of interest rate drops took effect and sales started dropping, the number of new listings coming to the market dropped as well.
The shift in the market has continued this month. Due to a drastic rise in mortgage interest rates, the key indicators in the market have changed. The biggest change I have seen so far is in the number of sales occurring. Sales are down 22% for the year and in October sales dropped from 486 a year ago to 294 (Boulder County single family and attached), a 39.5% decline! Homes are staying on the market longer and negotiations are now favoring the buyers. Very few homes are selling for above the list price. In October, the average sale closed for 3.1% lower than the asking price. In October 62% of the sales closed for a price below list price. Six months ago, just 10% of the sales closed for below the list price.
The major problem for buyers is affordability. Interest rates have doubled over the past year while prices are higher than they were a year ago. This leads buyers to either reduce their price range, make a larger downpayment or pause their search and hope that both interest rates and prices fall enough for them to buy the type of house that they wanted to in the first place.
Real estate prices tend to be sticky, meaning that sellers are reluctant to lower their prices, but it seems that there are a number of factors in play that would point to a softening in prices going forward.
See the slide show below for more detailed statistics.
As opposed to some other investments, like stocks and more recently cryptocurrency, real estate is fairly stable in any short term period. Depending upon the supply and demand of the moment, prices can trend in one direction or the other, but you won’t wake up one morning and see a 15% drop in one day. The Boulder County real estate market has been especially resilient over the years and owning a home in this area has been a great investment in virtually any time frame over the past 30 years. That said, the Federal Reserve Bank has put a target on the overheated real estate market and in a few short months we are already seeing the effects locally.
Bidding wars are no longer common. Buyer’s are struggling to get comfortable with the new interest rates in the 6’s rather than the 3 and 4% range. Some buyers have exited the market entirely and others have had to reduce their price target. Sellers are needing to adjust to new reality of a softer market and I’m seeing larger negotiations upfront including giving credits so that buyers can lower their interest rates.
Sales of residential real estate in Boulder County is down 20% year-to-date and that is widening. Inventory is rising, but not as much as you think as we are seeing fewer new listings hit the market than in past years. Prices have gone flat and on average the sales prices are below the list price by a few percentage points. There are an increasing number of price reductions as homes sit on the market longer. New home builders are seeing buyers cancel because of the payment increases and they are staring to offer incentives and price reductions in order to sell their inventory. Overall, we are seeing a fairly rapid shift towards a balanced market.
Year-to-date sales are down 19.7%. During September, just 24% of the sales closed at a price above the list price, this is down from 70% in May and 76% in April. During September, the average sale closed for 1.11% below the list price. The average days-to-offer has increased from 13 days in April to 29 days in September. Historically, these are all solid numbers, but they do note the market shift since spring.
To hear more about the high points watch the video. To see the graphs and compare the details month-to-month and year-to-year take a look at the slideshow below.