
by Neil Kearney | Sep 22, 2019 | Boulder County Housing Trends, Statistics |
Much has been said about a slowing market. I think a better characterization would be a more competitive market. For the year sales are up 1.8% over last year but there are definitely differences in how the market feels this year compared to the last few years. Rising inventory gives the buyers a little more power. When there are just a few homes on the market the decision becomes binary; “should be buy it or not”. With more to choose from it’s easier for a buyer to to see 10 listings eliminate 7 from the running and then choose among the top three. Sellers need to realize that if their property isn’t competitive on price and condition it is realistic that their house won’t make the cut every time.
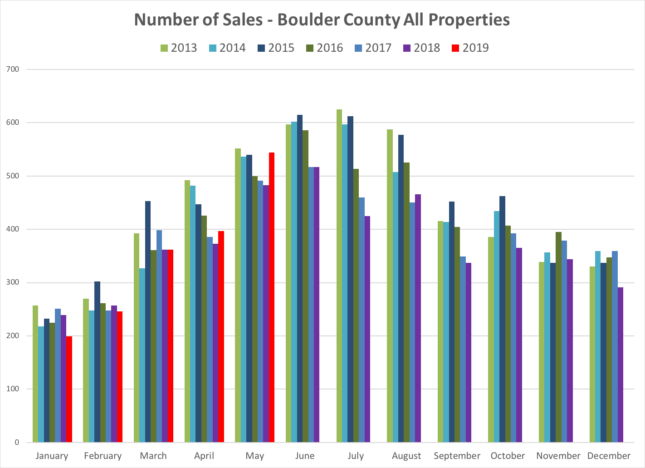
- Sales in August decreased by 2.8% compared to last year.
- YTD sales are up by 1.8%
- Price reductions continue to be very high.
- Inventory is at the the high point for any August since 2014.
Take a look at the slideshow below for more detail.

by Neil Kearney | Aug 12, 2019 | Boulder County Housing Trends, Statistics
Late summer is a slow time of year. Kids are just starting school and therefore families who wanted to move before school started are all in place. Often we see a surge in the market after Labor Day. Since we are seeing volatility in the sales numbers, it’s hard to put too much weight into any individual month. We are continuing to see houses stay on the market longer and fewer active buyers looking at homes. This mirrors a national trend.
Sales during July were up 15% over the same month last year. This brings the year-to-date sales total to 2% above last year. Inventory is still higher than at any time since 2014. We are seeing a large number of price reductions. This goes hand-in-hand with longer days-on-the-market.
Please let me know if you have any questions.
Enjoy-the-report. 🙂

by Neil Kearney | Jul 11, 2019 | Boulder County Housing Trends, Statistics
The strong sales in May were not backed up by a strong June. My personal statistical records upon which this report is based, goes back to 2004 and June’s sales were the lowest of the group. On the street, I’m seeing large price reductions on high priced homes and other homes are sitting on the market longer than in the past. There are currently 23 homes on the market in Boulder County with a list price of at least $5 million. Just one of those is under contract and there have been two sales so far this year in that range. It’s not uncommon for the market to start slowing down this time of year. See the annotated slideshow below for more details.

by Neil Kearney | Jun 12, 2019 | Boulder County Housing Trends, Statistics
The sales in May surprised me! It was a very strong month in what seems to be a changing market. On the street, I’m seeing fewer showings, more price reductions, longer time on the market and more options for buyers. On the other hand, we are finally seeing enough active listings out there to satisfy the buyers who have been looking for awhile. Some price ranges and areas and moving more quickly that others. Sellers need to make sure their expectations are in line with the market so that their listing doesn’t miss the mark and sit on the market. Here are a few key graphs, but for the whole picture click through the slideshow.
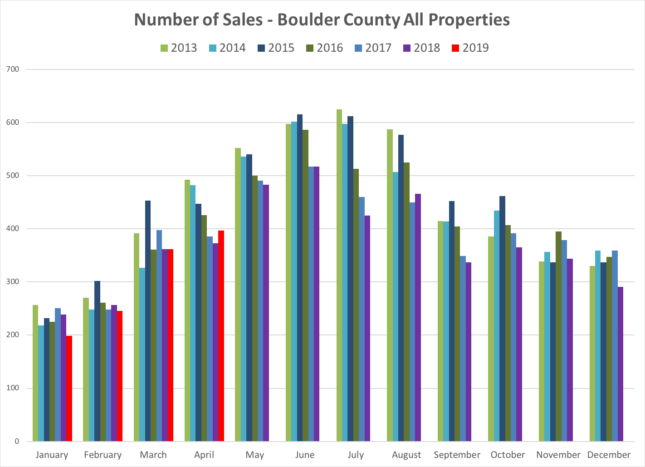
The number of sales in May increased by a robust 12.6% compared to the same month last year. As a result, YTD sales are now up 2%.
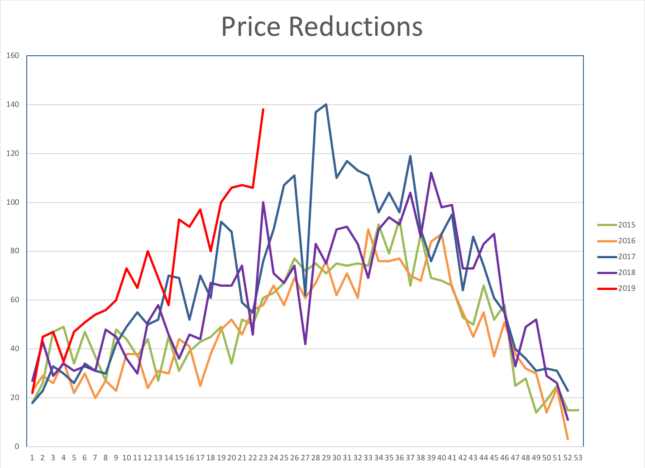
Even though sales were up in May not all houses were selling. When a property doesn’t sell, for whatever reason, a price reduction is often the best way to overcome objections and get it sold.

by Neil Kearney | May 6, 2019 | Boulder County Housing Trends, Statistics
This is an important time of year for the Boulder real estate market. March through June are typically the most active months in our area. March as a decent month but not strong enough to give me a clear picture for the spring. The picture is becoming a bit more clear and April was a good month for real estate in Boulder County. Sales were up 6.6% compared to last year. The activity in the market was steady and there was a surge of new listings at the end of the month. It will be interesting if there are enough buyers to absorb those listings before the market starts to slow again during the summer.
The first chart below shows the number of closed sales on a monthly basis in Boulder County. April was the first month since last August where current year sales exceeded last years sales.
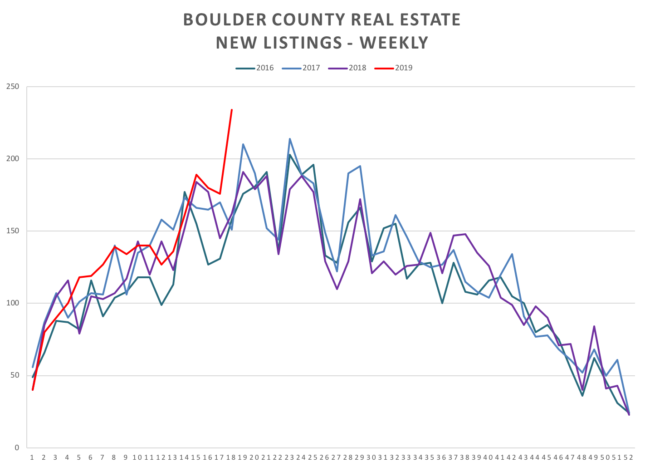
The first chart below shows a large influx of new listings in late April. The second chart shows the total active inventory compared to past months.
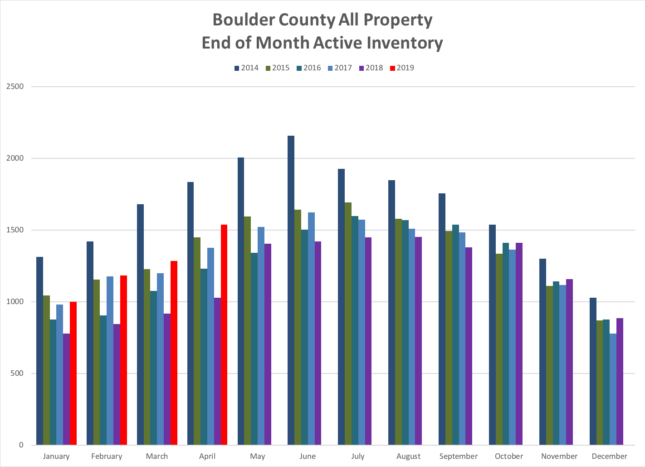
For the complete picture scroll through the slideshow below.

