The market is showing some good resilience and strength as we head into the 4th quarter. I started tracking sales on a monthly basis in 2004 and sales this September were higher than in any other September during that 17 year stretch. Inventory is holding steady at a very low level. In September 48% of the sales sold for over the asking price. The average premium paid for those that went for over the list price was 4.89%. Compare this to May when the average premium paid was 9.74%. The market is still strong but the strength isn’t quite so deep. Some houses are still garnering a lot of interest and are selling right away for well over asking price and others are sitting on the market for awhile. The average sale in Boulder County last month sold for 1.3% over the asking price.
I’m not ready to say that the market has made a turn, but it certainly seems clear that the upward trajectory has slowed over the last few months. Both inventory and interest rates remain low. When that is coupled with strong demand the result is that houses are still selling. In august 49% of closings were for a price above full price. Taken alone that still signals a very strong seller’s market. But when compared to May when 86% of sales were for above list price it isn’t quite as impressive. On average properties sold for 2.9% above list, in May it was 6%. Still a really strong market, but not quite so crazy.
Here is a summary for the month of August in Boulder County (this includes both single family and condo/townhome listings)
Number of sales 533 (down from 565 a year ago)
Median price $630,000 (up from $605,000 a year ago)
The average sale closed for 2.9% above the asking price. (last month it was 4% and it was 6% in May)
End of month inventory of active and under contract homes 1,114 (down 20% from last year)
30% of sales during the month sold for below list price
21% of sales during the month closed exactly at list price
49% of sales during the month sold for above list price
The average premium paid for those sales that closed above asking price was 5.09% (July was 7.5%, June 8.7%, May 9.7%)
There were 10 sales during the month that closed for 15% or more above list price. (36 in July, 72 in June)
I’m hearing reports from all around the country that the unprecedented market conditions we are seeing in our market are not unique. Prices are appreciating quickly. Competition has escalated and it’s quite common to see buyers pay 12-15% over the asking price. Along with that they are waiving the right to object to low appraisals and limiting or waiving inspections altogether. This is happening at a time when we are seeing fewer new listings coming on the market. Buyers are writing offer after offer and as they get beat out, they find new ways to be competitive and bid higher and bolder the next time around. It’s a frustrating cycle for buyers and a windfall for sellers.
For many buyers and buyer’s agents it’s like beginning anew each week. Scour the new listings, quickly set an appointment, decide which house in which to make an offer and then answer the big question, how high do we need to go on this one? More often than not the listing agent calls, or worse yet, sends a mass email informing of a better offer. Better luck next time! So the search starts anew, maybe with lower expectations and a willingness to go even higher next week.
Scroll through the slide deck showing the latest statistics for Boulder County. The quick change in prices is easy to see.
Just like a warm October afternoon, the Boulder Colorado real estate market is still hot! Inventory is at the lowest levels that I have seen in my 30 years in the market but despite that, activity remains strong. Boulder is a destination city and we are gaining residents coming from other parts of the country. The pandemic, the rise in telecommuting and the fires have pushed many buyers to look at the Boulder market.
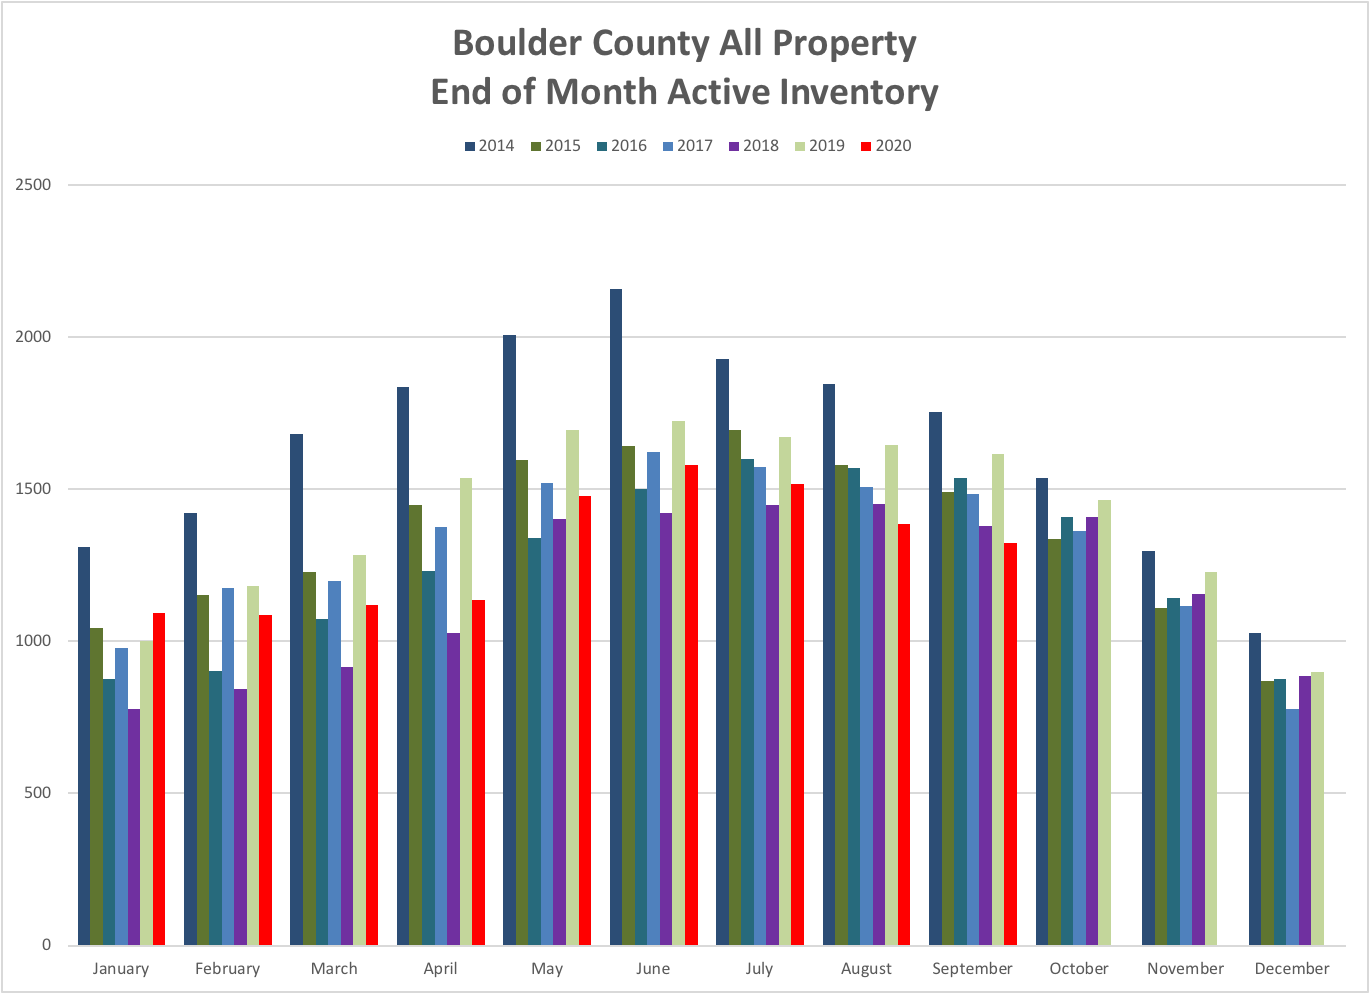
This chart shows the end pf month inventory in Boulder County and includes both single family homes and attached dwellings. For the end of September we are at the lowest level of a low inventory time.
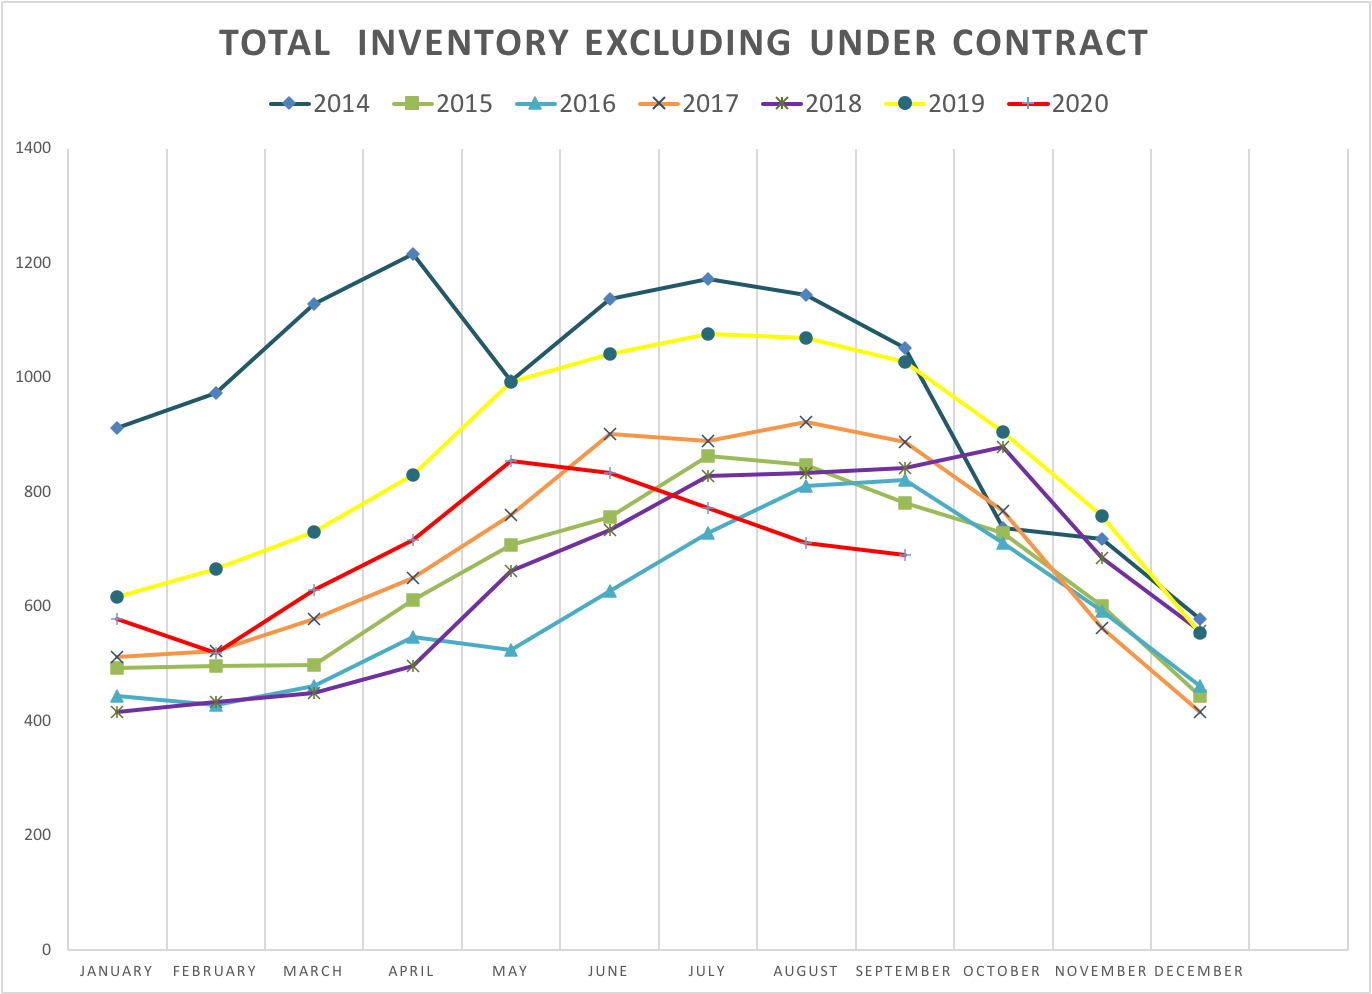
This chart shows the inventory of properties without those that are already under contract. That reduces the number by about 50%, but the overall trend is about the same.
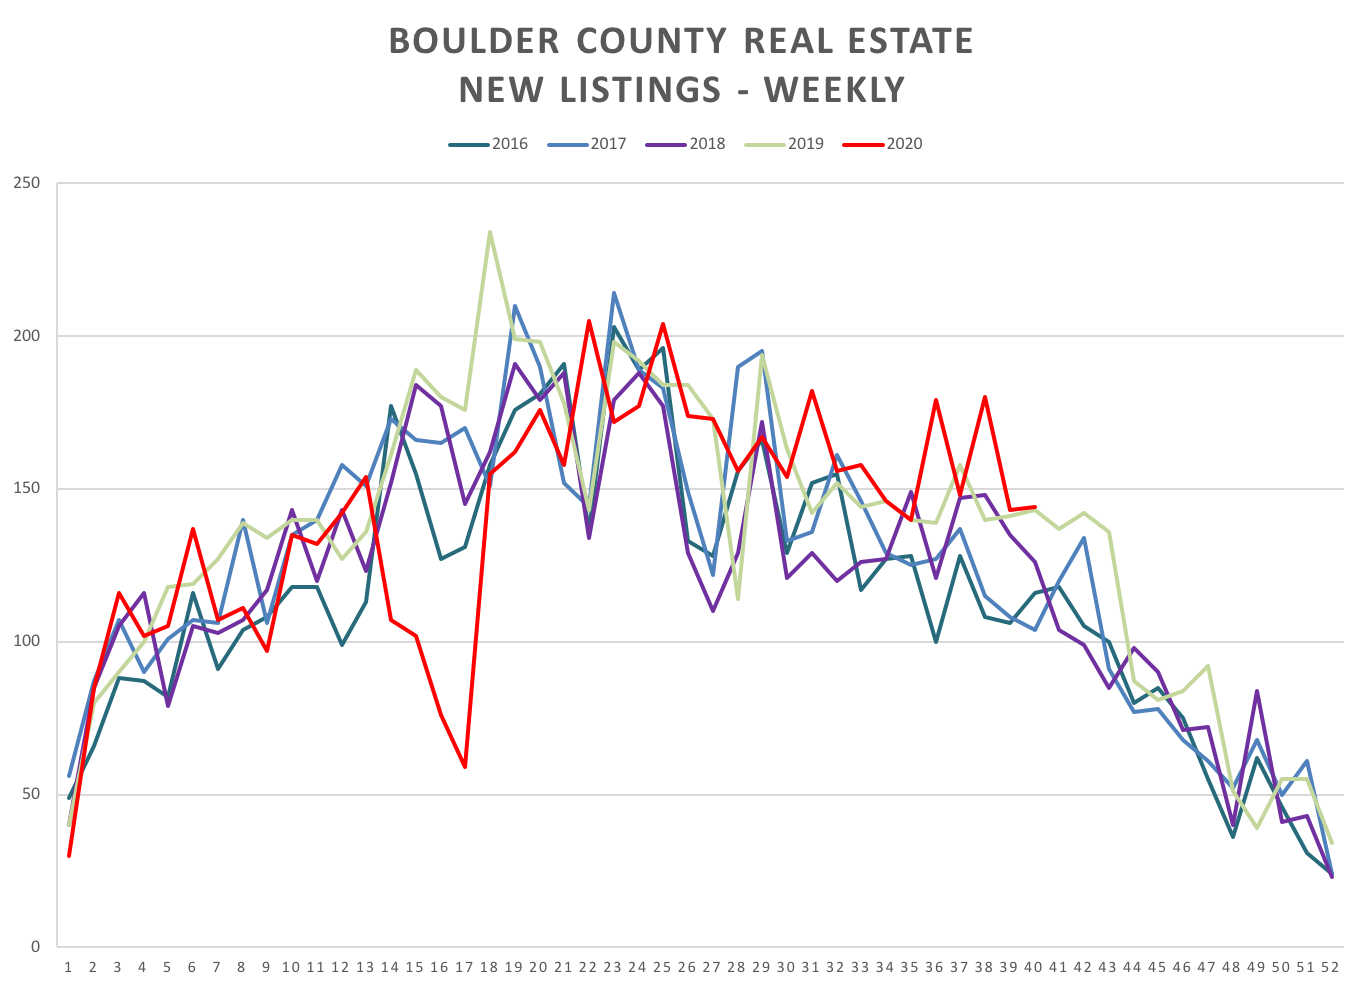
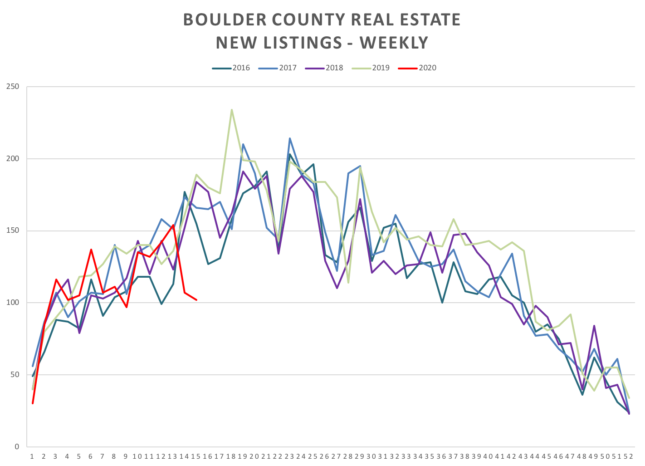
New listings, especially recently have remained above the average for this time of year. Despite the new supply, it’s not keeping up with demand.
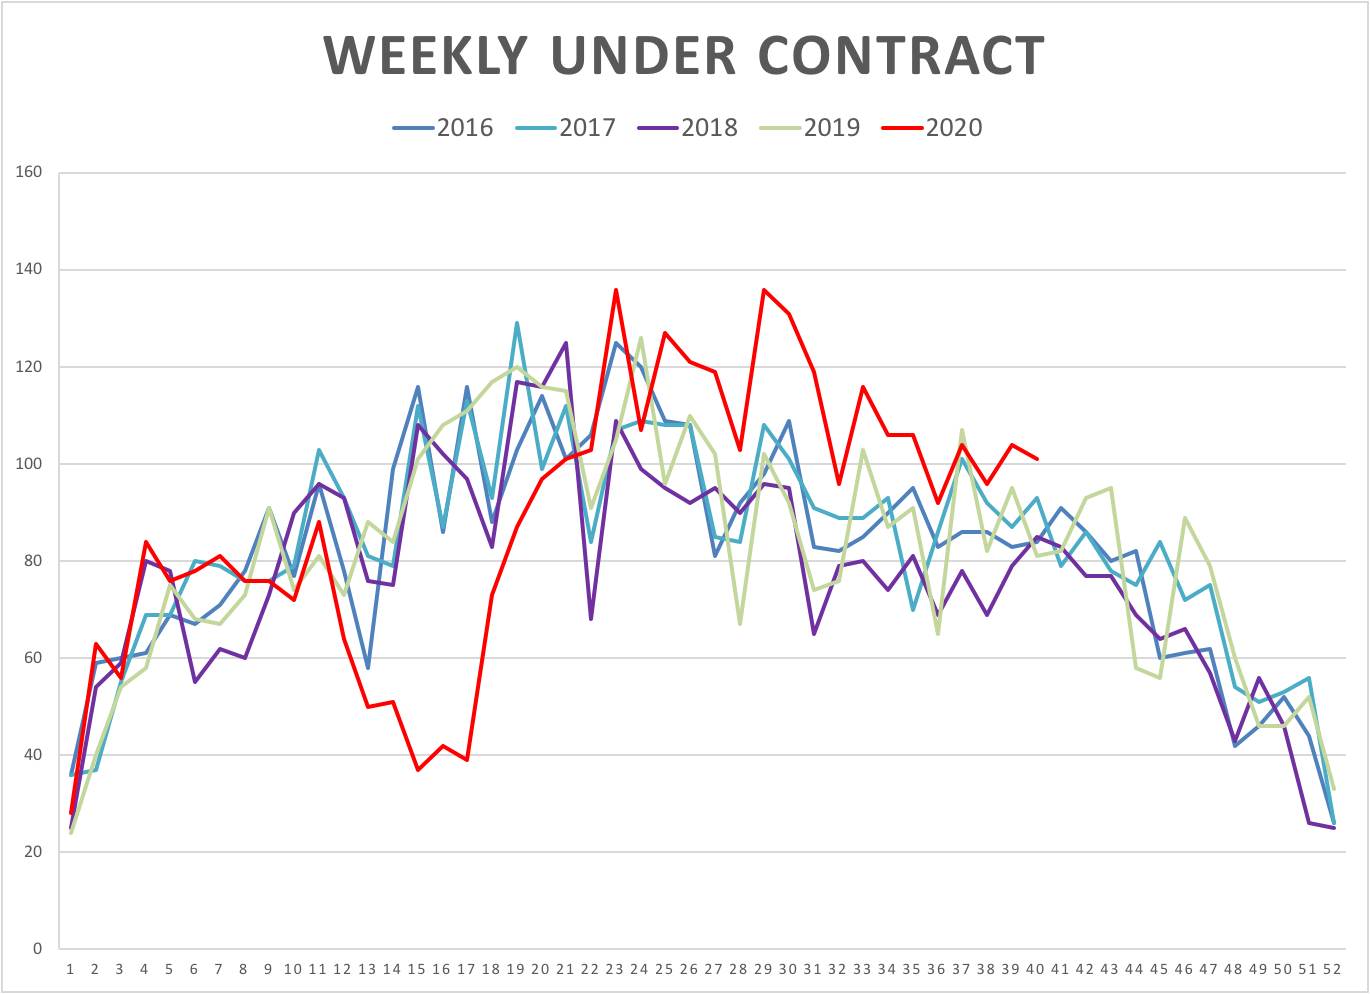
This chart shows the number of homes that have gone under contract on a weekly basis over the last 5+ years. Since June 1st we are exceeding all other recent years. Sales have followed and I expect that this month we will exceed the pace of last year despite a two month respite.
What I’m seeing in the Boulder real estate market this week is a continued slowing in activity. Few properties went under contract than any week in recent memory. Showings continued to decline as well. The Attorney General and the Colorado Real Estate Division have interpreted that the activities of showing property and open houses to fall outside of the essential services.
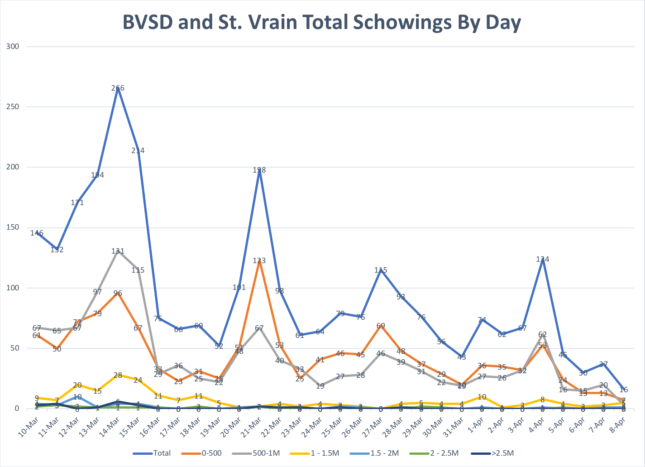
Total showings in the Boulder / Longmont by day since March 10, 2020.
Total showings in the Boulder / Longmont market by week.
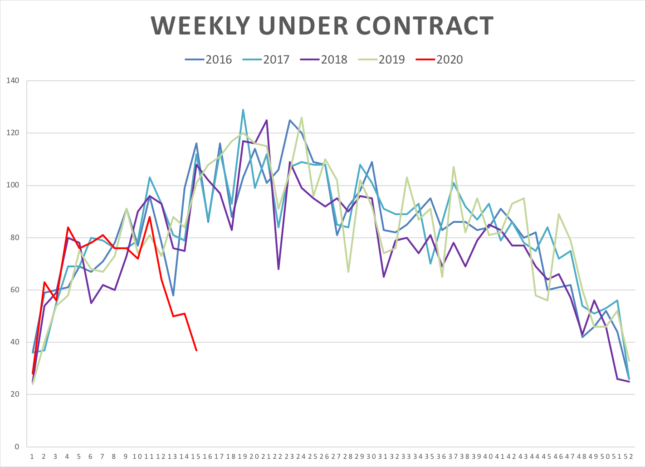
This graph shows the number of homes that have gone under contract on a weekly basis over the past five years. The red line shows the dramatic effect the mandatory “stay at home” orders have had on our market.
We have seen a decrease of new listings to the market but not as much of a decrease as I would have thought given the restrictions on showings.