by Neil Kearney | Jul 7, 2017 | Boulder Real Estate, Visiting Boulder
The conventional place to watch the fireworks in Boulder is from Folsom Stadium. But this year I watched them from the roof of my listing at 405 Hapgood. 405 Hapgood is located on the lower slopes of Flagstaff Mountain and has 180 degree views of Boulder. The house is a great candidate for a remodel or a scrape and rebuild but what a place to host a fireworks party from your rooftop deck! Here is a video that shows the finale from the 2017 Boulder Fireworks Show.

by Neil Kearney | Feb 21, 2017 | Boulder Real Estate, Visiting Boulder
Boulder Neighborhood Guide
 I realized a few years ago that people coming from out of town were having a hard time characterizing the different neighborhoods within Boulder. In response I created the Boulder Neighborhood Guide. In this report I have split Boulder into eleven different areas and present the lifestyle highlights, schools, shopping districts, local recreation and real estate statistics for each area. If you’re interested in learning more about the different neighborhoods within the City of Boulder this is your guide.
Click this link to view and download the report. Boulder Neighborhood Guide 2017
It is recognized that Boulder is a great place to live but the neighborhoods in Boulder are a bit hard to peg. Boulder was developed over time in a piece-meal fashion. The result is that many of the neighborhoods are only a few hundred homes in size. It is common to have two adjacent neighborhoods developed at different times and with completely different price ranges. While this report is not comprehensive, it will give the reader valuable information from which to start understanding the real estate market in Boulder. I will highlight the major neighborhoods in each area.
If you are visiting Boulder you may be interested in where to stay, where to eat, things to do and how to get around. You may also be interested in walking some of Boulder’s neighborhoods. I have created a few self-directed walking tours in Boulder that may be fun if you are visiting town. To access all of that information go my “Visiting Boulder Page“

by Neil Kearney | Aug 30, 2016 | Boulder Real Estate

Vancouver British Columbia
How Involved Should Government Be In Real Estate Transactions?
What just happened in Vancouver
In mid July the British Colombia provincial government convened a special session and passed a 15% transfer tax for real estate transactions in the greater Vancouver area involving foreign buyers. The tax went into effect on August 2nd. The average price of a home in Vancouver is over $1 million so the tax inserted mid stream into the transaction was in most cases over $100,000. There was no grandfather clause and many transactions that were in process didn’t close. The ripple effect has been severe and sudden.
Let’s back up and discuss why the government felt the need to implement this new “out of the blue” tax in such a short time frame. Over the past year real estate prices have increased by over 30%. Much of this appreciation is due to foreign buyers paying cash for real estate as a safe harbor for money instead of their national banks. Most of the foreign buyers in the Vancouver area are Chinese. I talked with a local and he said that he lives in a nice neighborhood and there are quite a few homes that are owned by Chinese citizens and are sitting vacant. The yards are being maintained but nobody is moving in. The local government officials were seeing their citizens being priced out of the market and homes sitting vacant. In their mind something had to be done. And they did it.

Vancouver B.C. Skyline
Since the new transfer tax went into effect on August 2nd, the market in the Vancouver area has come to an abrupt halt. Many transactions that were in process were cancelled and many buyers and sellers, both foreign and local, have taken a wait and see approach. It has been reported that many Chinese buyers have moved on to other Canadian cities such as Toronto. For better or worse the strategy seems to have worked.
What does this have to do with Boulder?
So what does this have to do with Boulder? There is no transfer tax in the City and County of Boulder but there are a number of statutes and fees that have a similar effect. Connecting real estate to government programs can be an enticing and slippery slope. Here are a few of the programs that affect real estate and are already in place in Boulder.
- Permit Fees – Getting a building permit in the Boulder area (both City and County) takes time, persistence and a deep pocket book. The goal of the local government seems noble – to require that new building or major remodeling be done in a safe, energy efficient manner that is consistent with the area in which the house sits. However, the process has become onerous to the extent that it’s difficult for a homeowner to navigate the process without professional help. The high fees are really taxes that fund programs that the local government has deemed is best for all but should only be paid for by those who want to exercise their right to improve their property.
- Inclusionary Zoning – From the City of Boulder website “Inclusionary Housing (IH) requires that new residential development contribute at least 20% of the total units as permanently affordable housing. Options for meeting this requirement include providing the permanently affordable units on-site, dedicating off-site newly constructed or existing units as permanently affordable, dedicating vacant land for affordable unit development or making a cash contribution to the Affordable Housing Fund, in lieu providing affordable units (Cash-in-lieu). Regardless of size, all annexed parcels with residential unit development potential are subject to the requirements of IH.” So, while I agree that we need to promote affordable housing in our community, this regulation forces developers to make their profit on 80% of their project. Making the market rate housing that they sell more expensive.
- Green Points – From the City of Boulder website – “The Green Building and Green Points Program encourages the use of

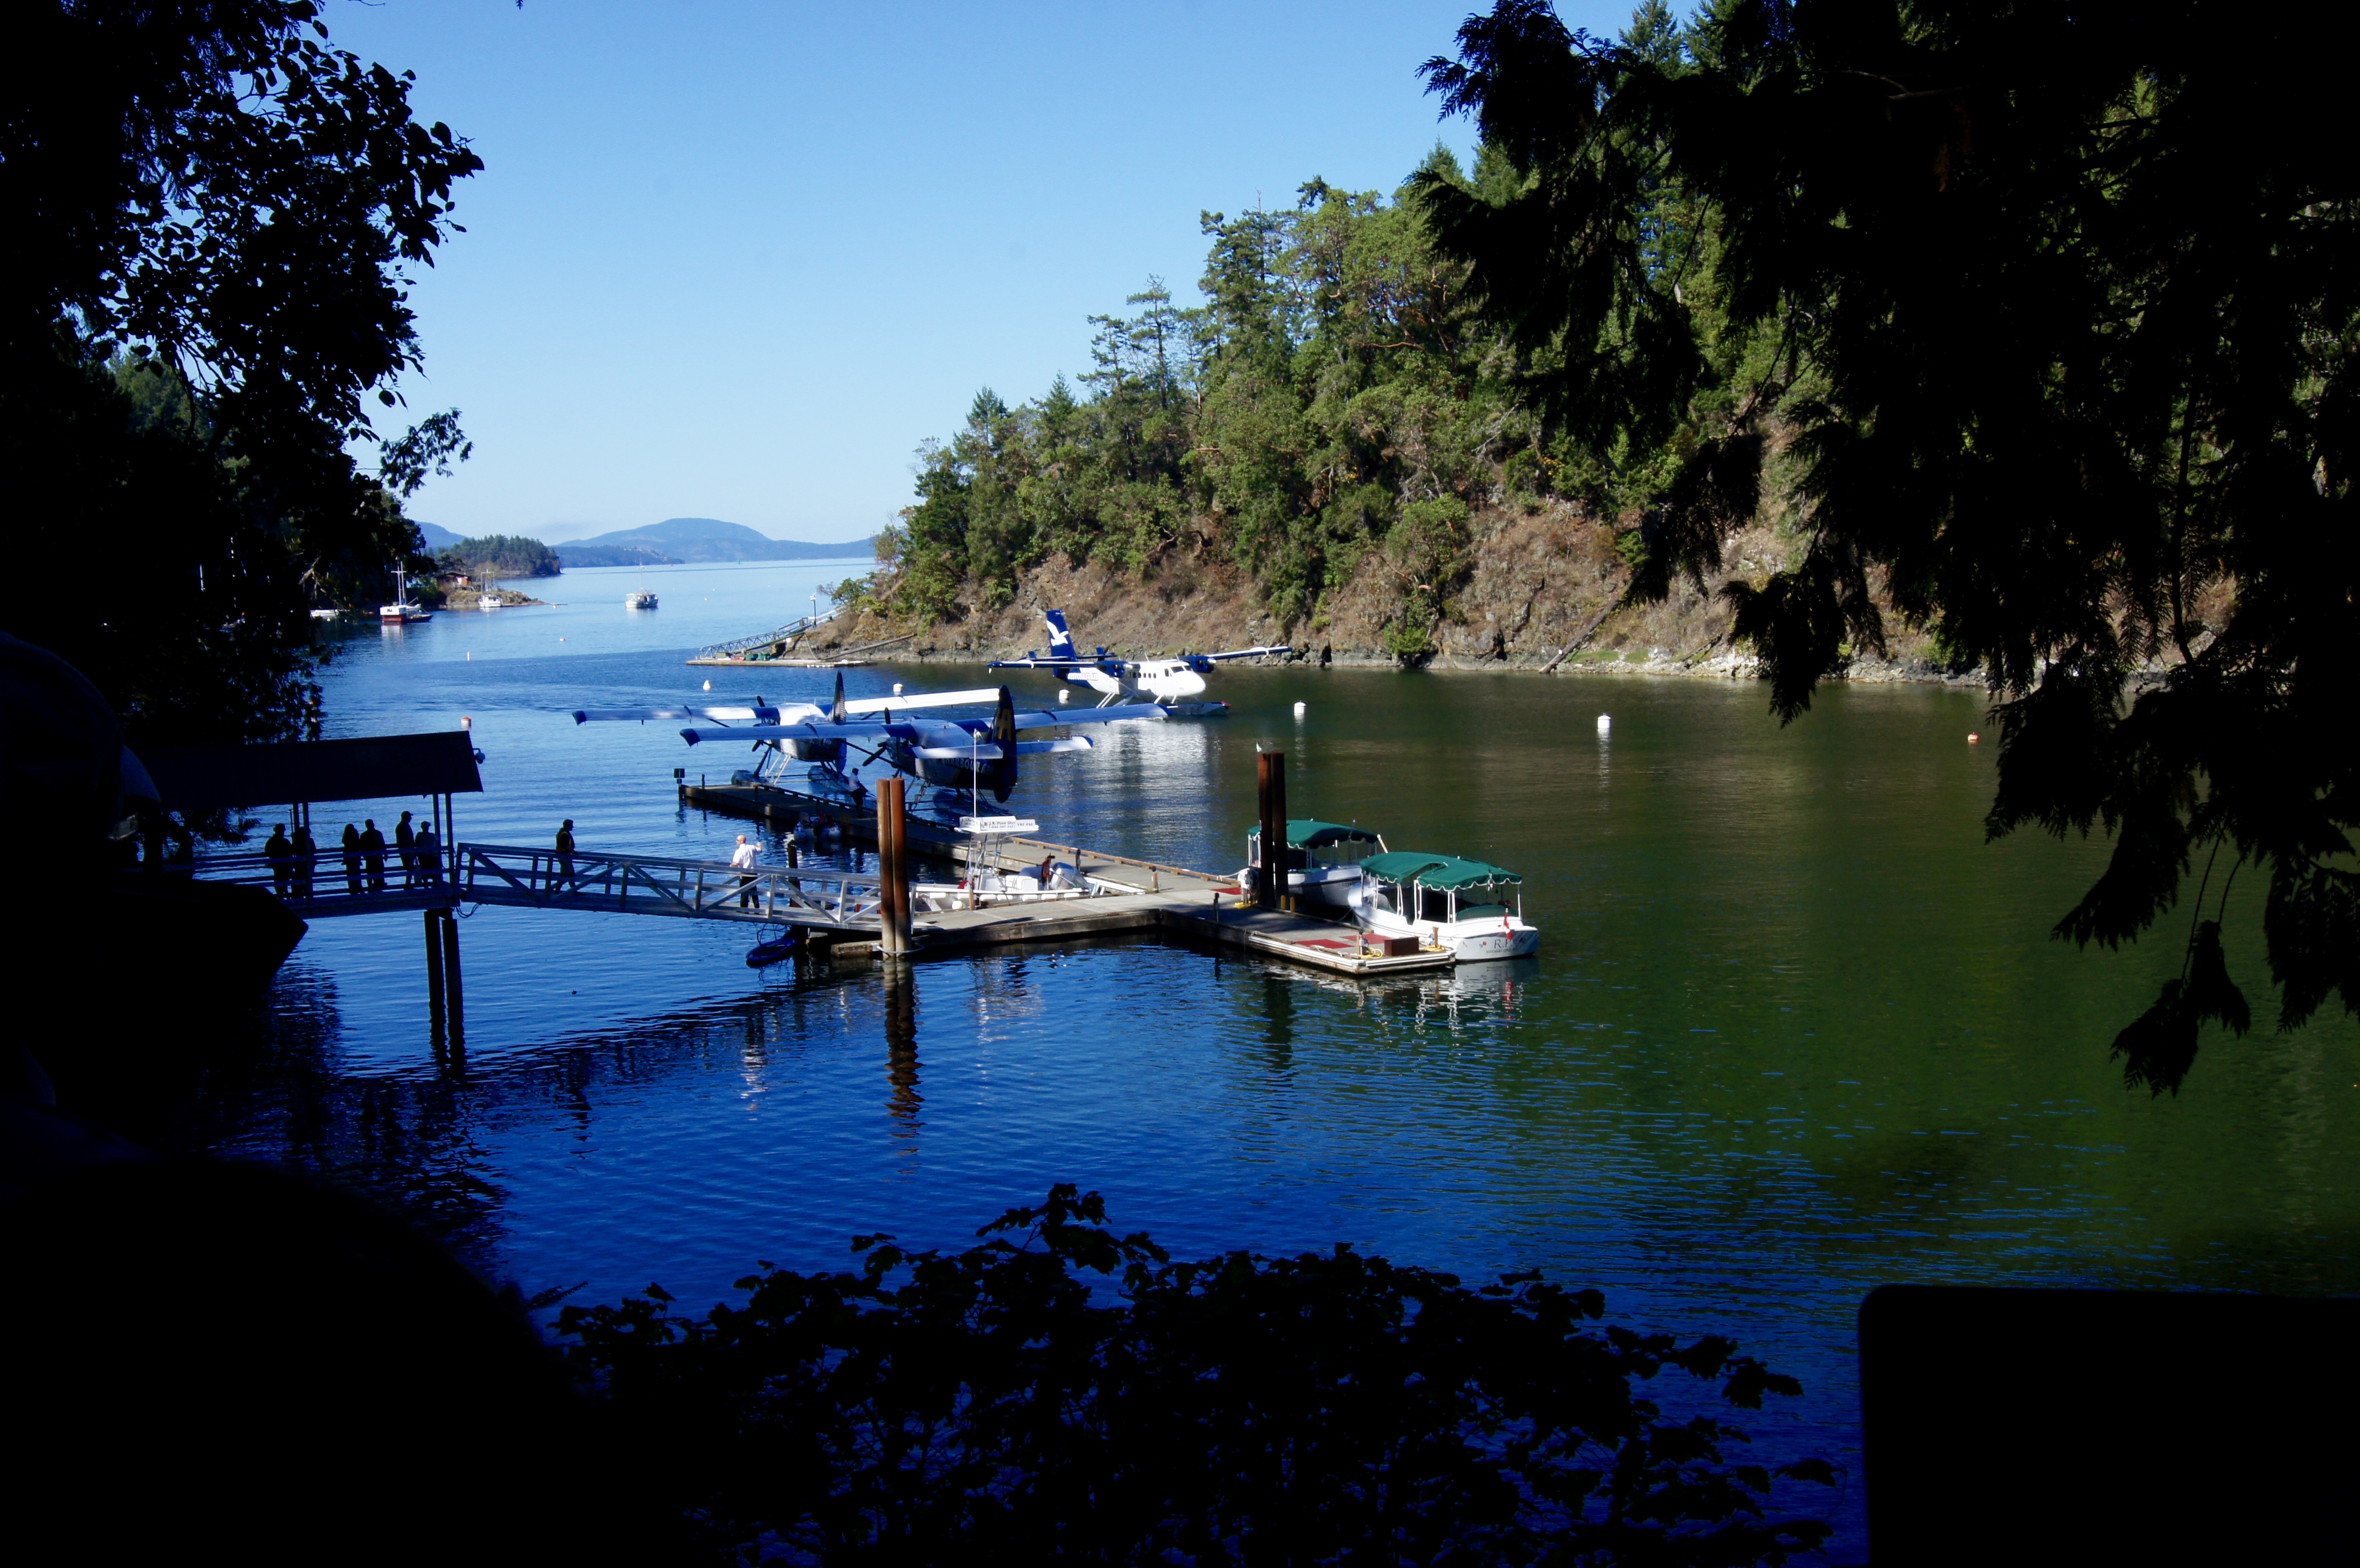
British Columbia Float Plane Dock
sustainable remodeling and building methods and technologies to conserve energy, water and other natural resources. The Green Points Program applies to all new residential construction, and additions and remodels larger than 500 square feet. The purpose of the Green Points Program is to:
- help homeowners find the products and designs for building “green;”
- encourage Boulder homeowners to include cost-effective and sustainable remodeling and building methods that conserve fossil fuels, water and other natural resources;
- promote the recycling of construction materials and reduce solid waste; and
- promote better indoor air quality.”
In order to comply with the Green Points program homeowners and builders end up adding features to their homes that they didn’t necessarily want. More than once I have heard of people adding an electric car charging station to their home when they don’t have an electric car – just because they needed more “Green Points”.
- Smart Regs – Half of the housing stock in Boulder is made up of rentals. These rentals tend to not be improved upon as much as single family homes and tend to be held for longer periods of time by investors. Therefore, the measures included in the first three bullet points rarely came into play. So, a set of prescribed, required upgrades were designated for all rental properties in the city with a due date of December 31, 2018. Again from The City’s website “The SmartRegs ordinances update the City of Boulder Housing Code, Rental Licensing Code, and provide new baseline energy efficiency requirements for existing rental housing in Boulder. Improving energy efficiency in existing rental housing enhances tenant comfort and supports the community’s energy goals and climate commitment.”
- Septic Smart – This one is fairly straight forward. The county wants to maintain the quality of the water throughout the county and many of the septic systems are very old. So in order to mandate inspections they required that septic systems pass inspections and pay a small fee prior to property transfer. Not a big deal but another precedent of looking to real estate transactions to solve other problems.

Vancouver from a Kayak
The City and County governments have many plans on how to make our area a model community and it will clearly take money in order to make many of these plans come to reality. I’m afraid that Boulder may move past voter approved sales taxes for open space, and permit and use fees for builders to a more wide spread and lucrative real estate transfer tax. Colorado mountain communities such as Aspen and Vail charge a transfer tax and now it happened in Vancouver in just two weeks without a popular vote – Special session. During the summer when the government officials were supposed to be on vacation. Food for thought…
Note: I took the included photos on a trip to Vancouver last year. It was gorgeous! To enlarge the photo just click on the photo and then hit the “back” button on your browser to come back to the story.
by Neil Kearney | Jul 5, 2016 | Boulder County Housing Trends, Boulder Real Estate
What a difference a few months make. Back in April every new listing was inundated with buyers. Open houses were flash mobs and multiple offers were the norm. Since Memorial Day it seems to be a different market and I’m trying to figure out if the fundamentals have changed or if everyone is just away on vacation.
First of all, this is not an unusual trend. The common perception is that summer is “the” time for real estate sales. That might be true in other places, but in Boulder County spring is king. Every year the market slows down for the summer. Most years it’s in June, last year it was in late July and this year it appears (in hindsight) that it was late May.
Let’s be clear, the market conditions in Boulder County are still good, transactions are still happening, buyers are still out looking, new listings are coming on the market and deals are closings are still happening but it seems that the pressure in the market has waned. Especially in the high end of each towns market.
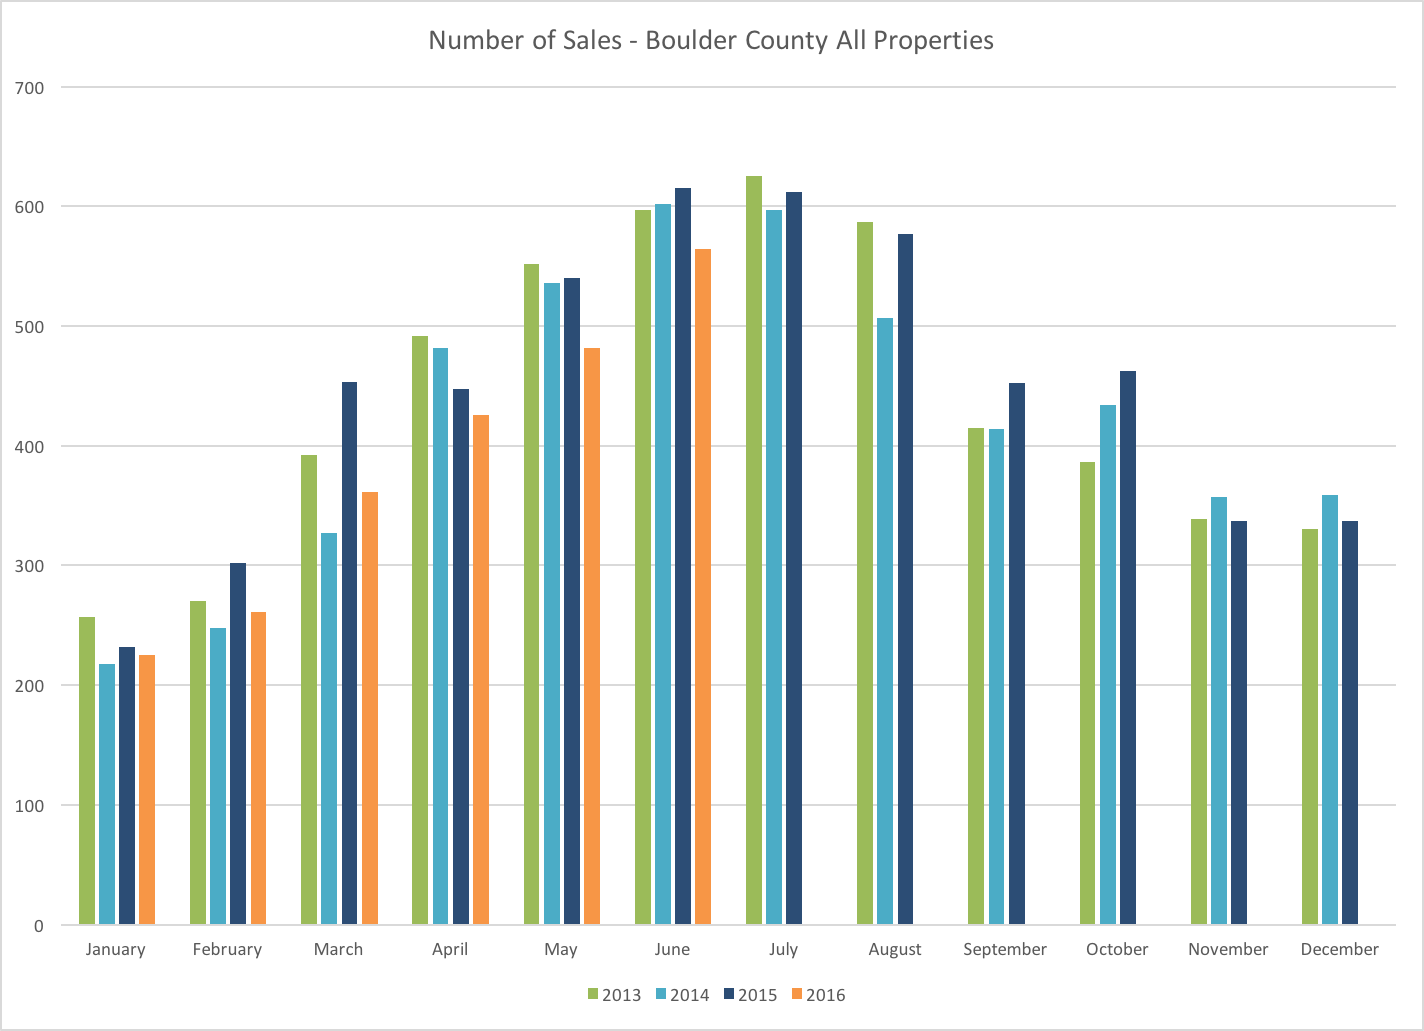
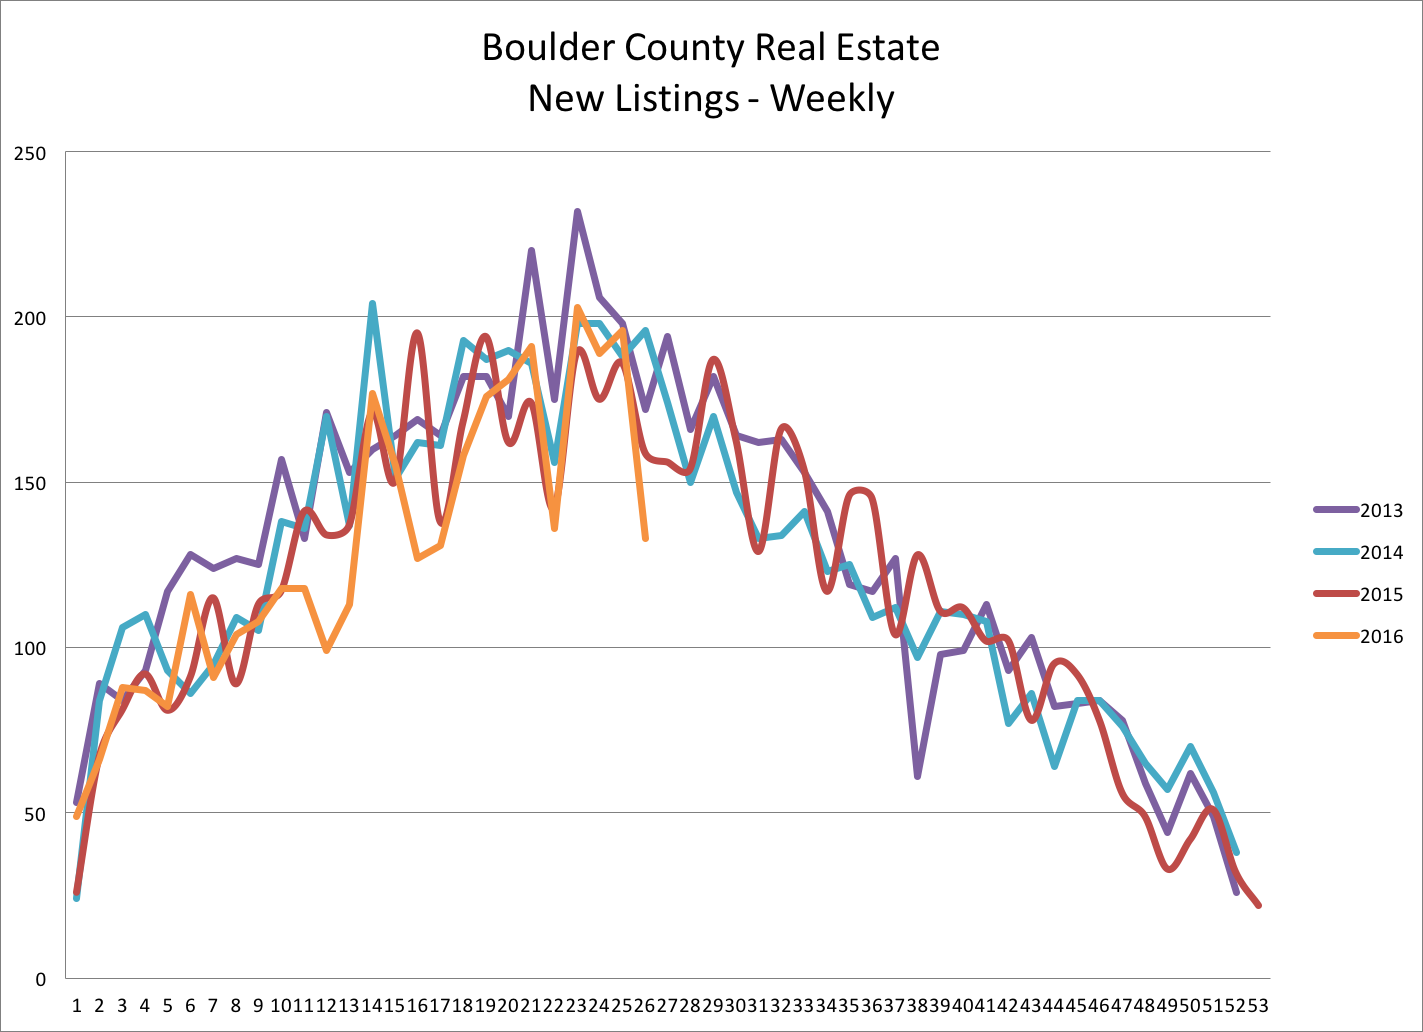
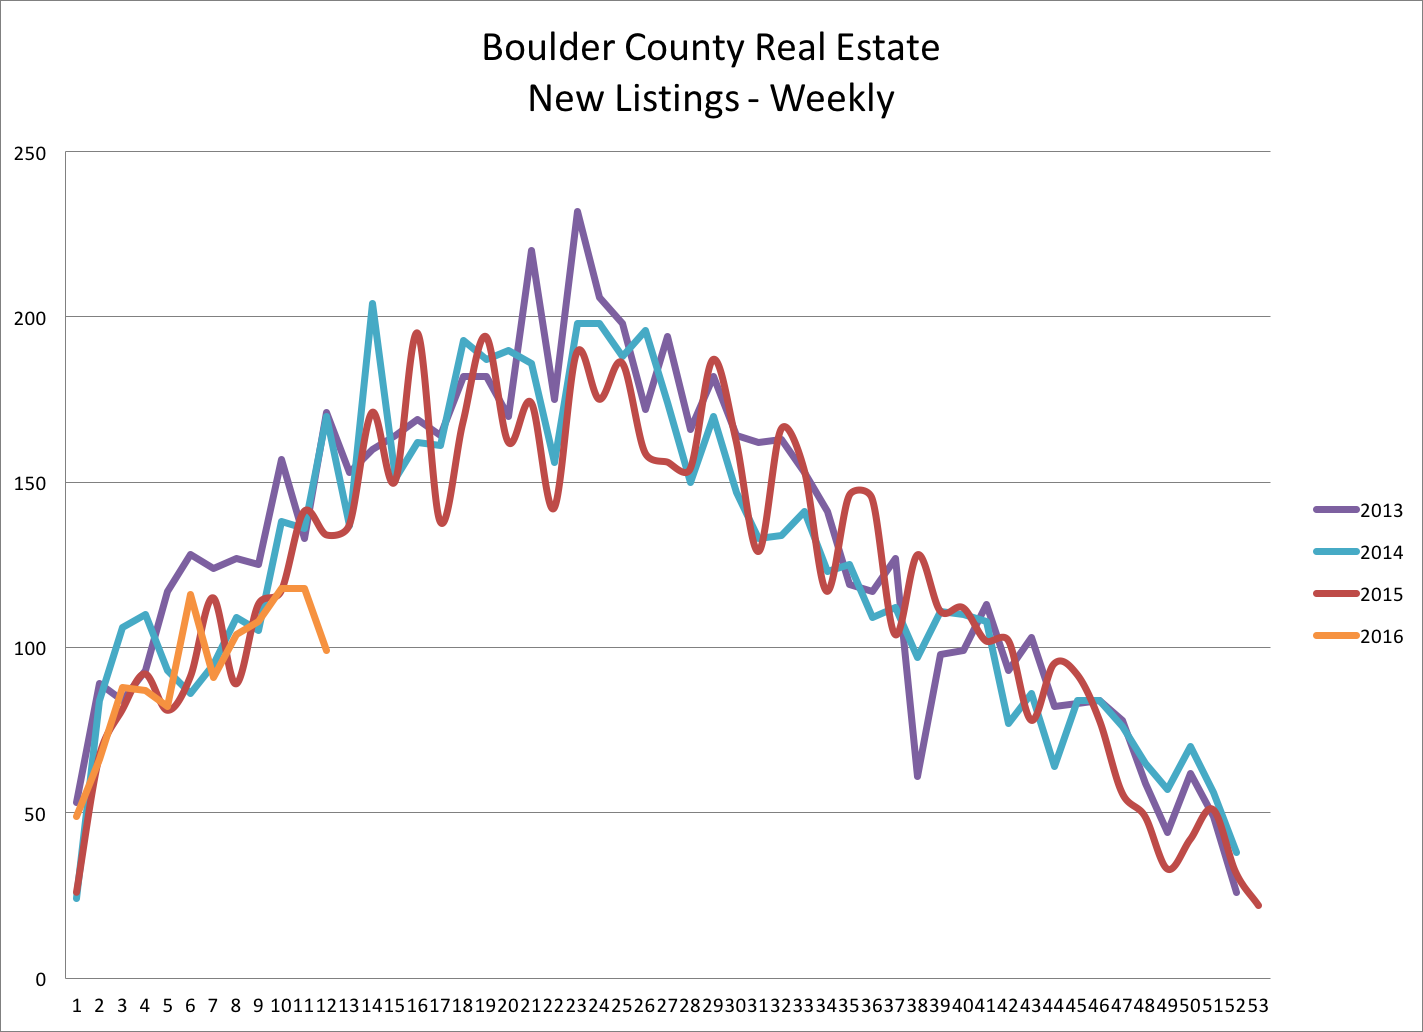
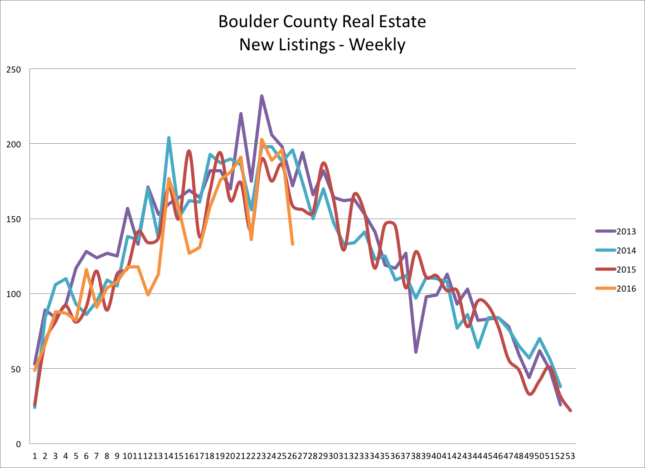
In this article I will present a number of different measures that measure market activity. Cutting to the chase it isn’t clear cut. Let’s begin by looking at sales. This first chart shows the number of closed transactions in Boulder County each month over the past five years. The orange line shows sales in 2016 and it’s clear that we are not keeping up with last year’s torrid pace. Through the first half of the year sales are down 10% from 2015. Inventory is low compared to past years and this has definitely been a cause for the lower activity. When buyers don’t have many houses to see the chances that they find one to buy goes down. This next chart shows the flow of new listings to the Boulder County market (all price ranges and types) on a weekly basis. It appears that new listings peaked back at the end of May and if we follow the trend will be decreasing for the rest of the year.
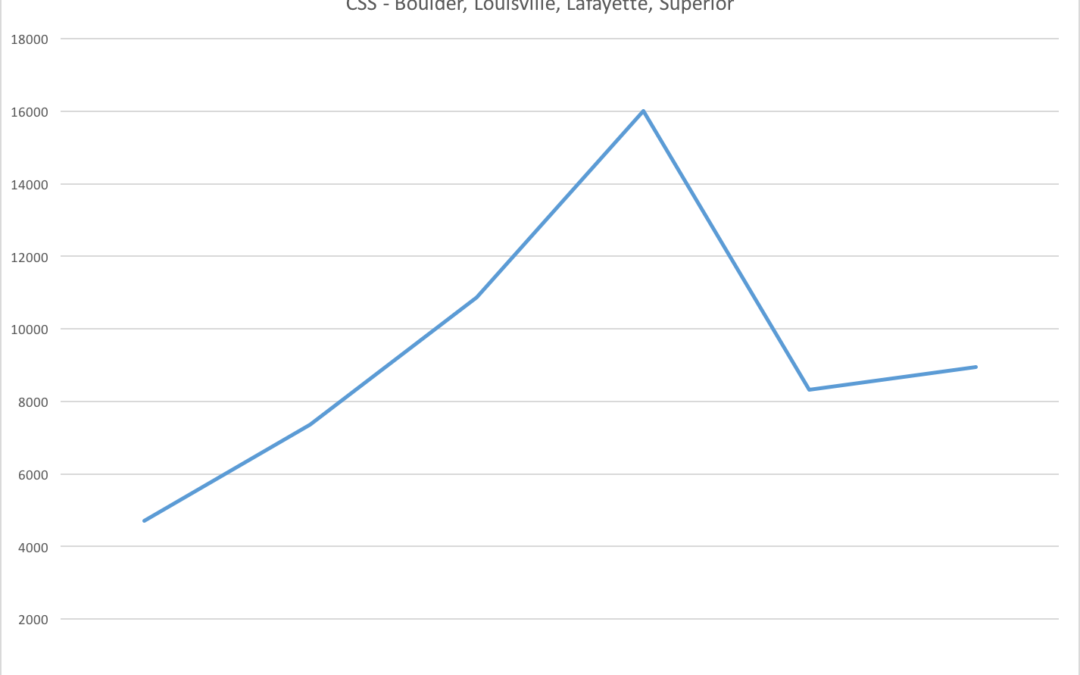
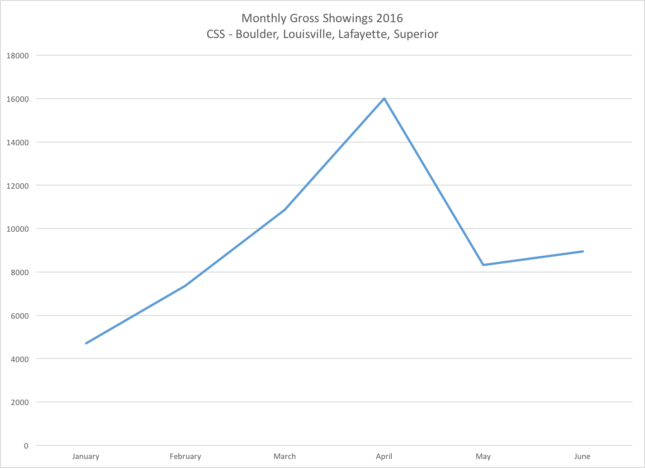
Unfortunately, showings started falling just as more new listings were coming to the market. More listings and fewer showings means that buyers didn’t have the sense of frenzy as they did back in April. The graph below shows the gross showings by month in Boulder Louisville and Lafayette as set by Centralized Showing Service. They don’t handle every showing in town but they have a very significant number and the sample is large enough to call it representative.
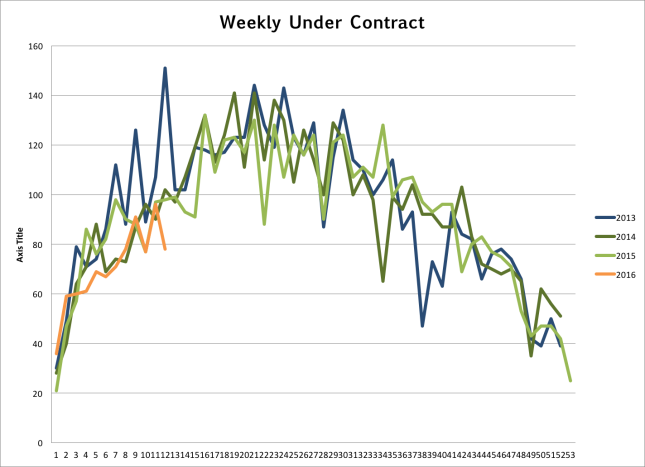
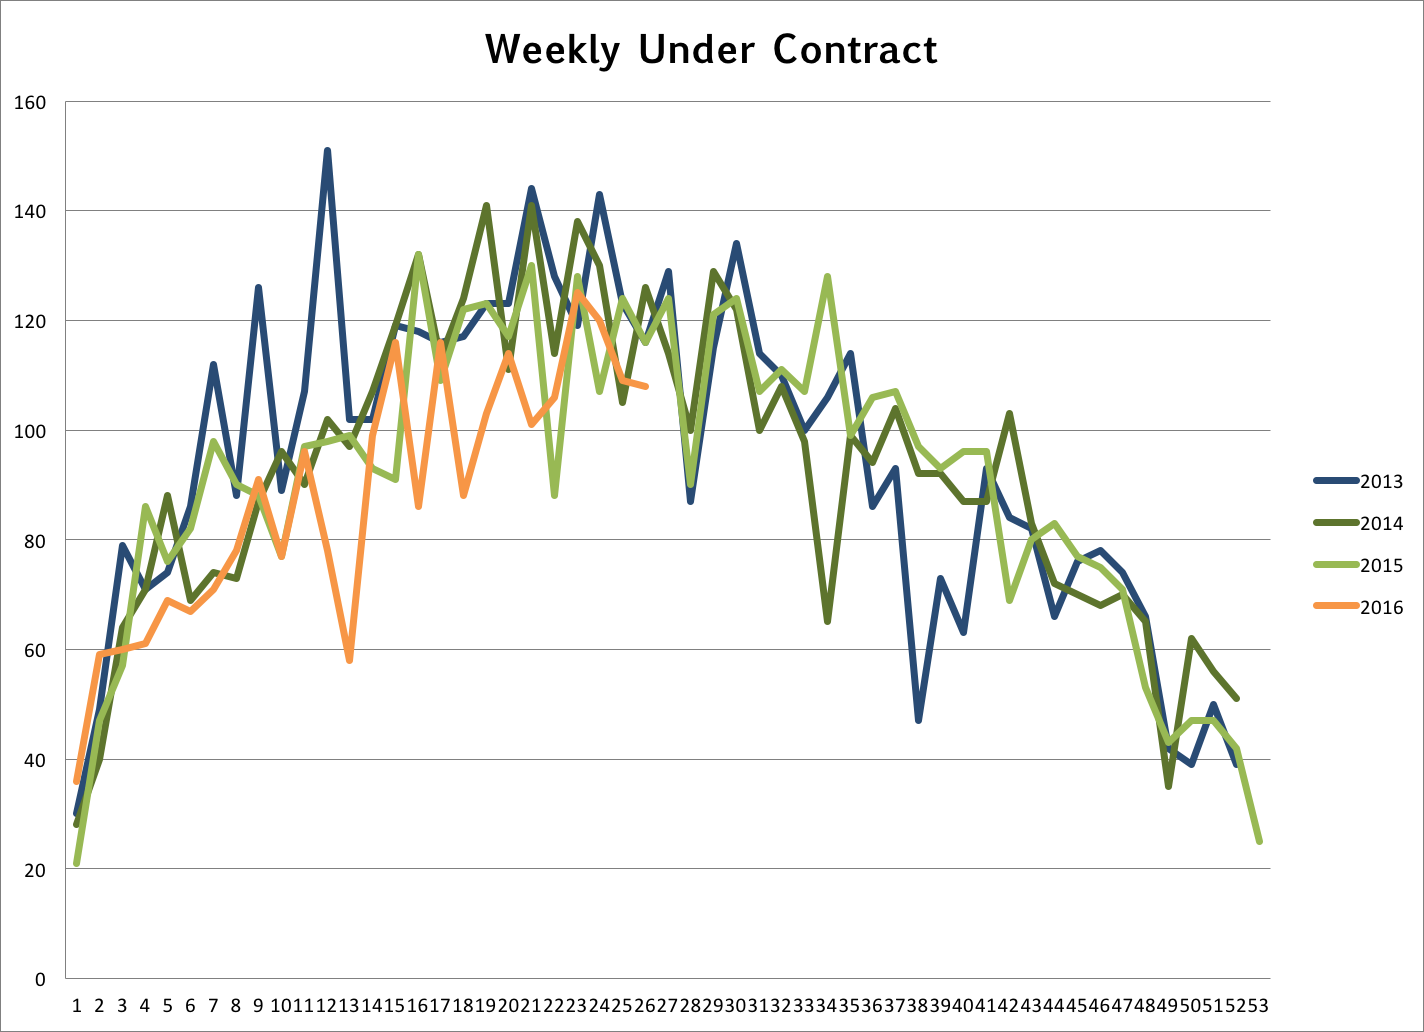
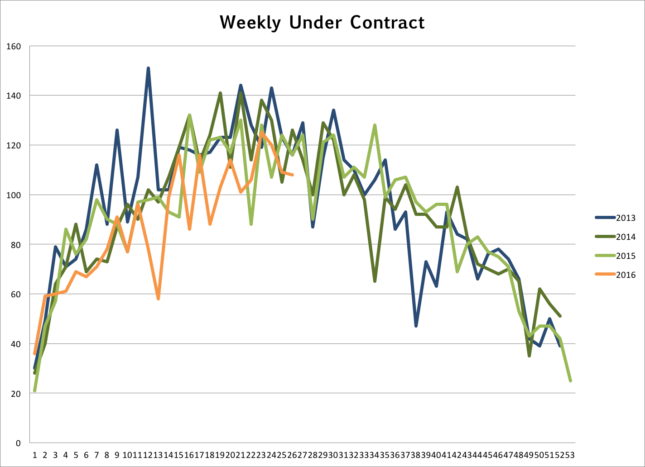
 So far everything makes sense. This is where it gets a bit fuzzy. I track the number houses that go under contract each week in Boulder County. From the graph below it appears that sales are still brisk. This shows equal or more contracts even while there were fewer showings. Obviously there are still buyers out there and finally with less competition they can jump on a property and get their offer accepted. It’s been all too common these past few years for buyers to look around a quite a few houses, find the right one, get beat out in a multiple offer situation and then be forced to start anew. Wash, rinse, repeat! This cycle pumps up showings. In the old days, a new listing comes on the market, buyer sees the listing, buyer likes the listing and then buyer buys the listing. Maybe we are getting back to that. Refreshing!
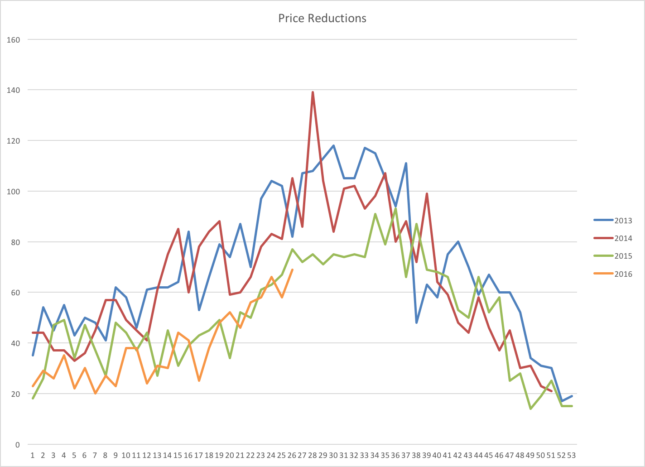
Before I started checking any of these statistics I felt the market slowing. Fewer listings for my buyers to see, not so many people at open houses and houses staying on the market a bit longer (what’s longer than immediately?). In an extreme sellers market sellers sometimes get greedy and when they don’t get their price in the first week to ten days they come back to reality a bit. So it would make sense that there would be more price reductions. Looking at the graph below we can see that the answer to that query is technically yes, but it doesn’t support the hypothesis that the market has changed.
 Given the information below it seems that the market has slowed but it seems more like a vacation than something more permanent. If you need to sell your house this summer you may need to lower the price. If we are patient, we will most likely feel the pressure rise when the buyers are back in town.
by Neil Kearney | May 26, 2016 | Boulder Real Estate, Colorado Lifestyle, Visiting Boulder |
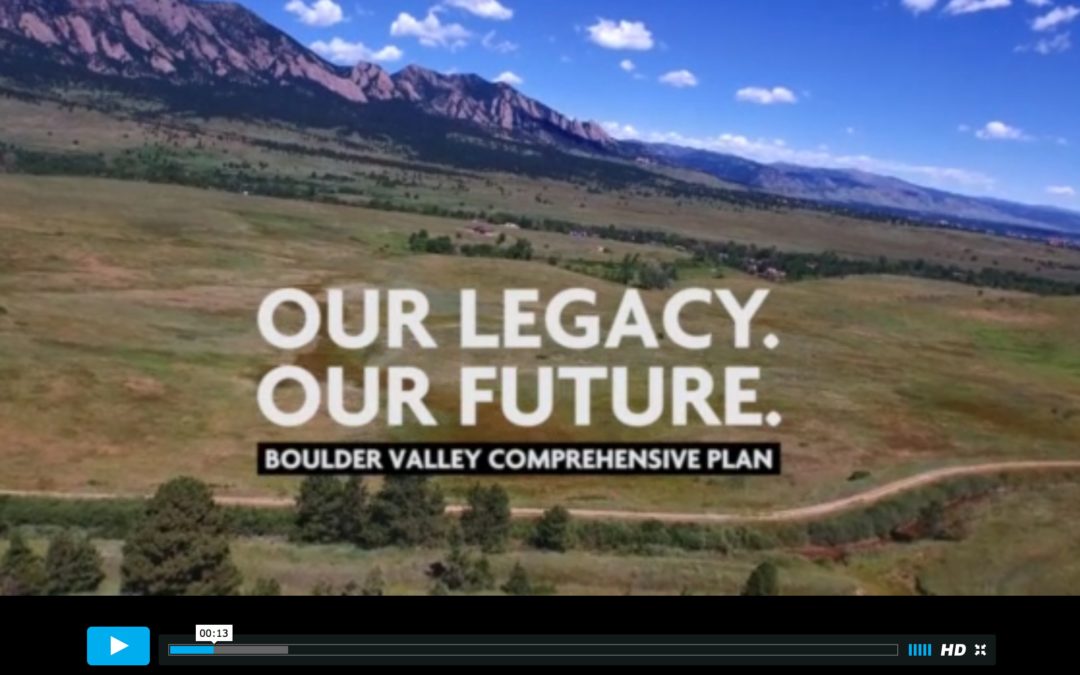
I stumbled across this video produced by The City of Boulder about the Boulder Comprehensive Plan. The video is not only well produced and beautiful, it gives some historical insight as to the creation and maintenance of the open space that surrounds our fair city. When I am showing around someone from out of town for the first time I always tell them about the foresight of our city forefathers (just over 40 years ago) who started preserving what was unique and great about our area. Can you imagine if market forces were allowed to prevail and there was a sea of houses and strip malls in an unending swath from the foothills to the city limits? If you appreciate the lifestyle in Boulder it’s well worth a watch.
by Neil Kearney | Mar 30, 2016 | Boulder County Housing Trends, Boulder Real Estate, Statistics
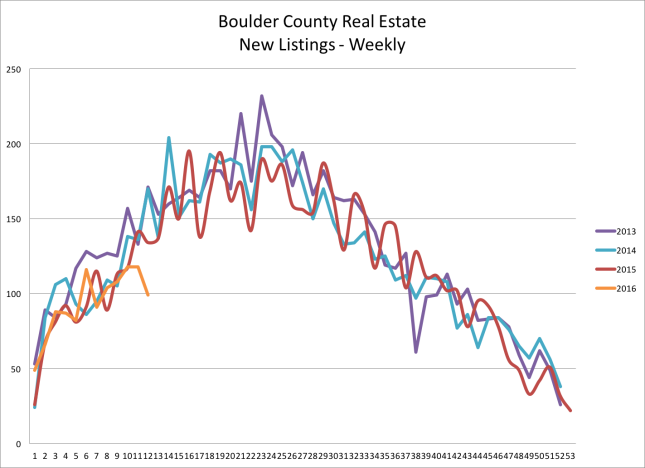
There seem to be plenty of buyers out there looking for houses in Boulder County. But the number of new listings is losing steam and the number of sales is following. Through the end of February sales are down 9% compared to 2015. During February sales were down 13.5% from a year ago. The first chart below shows the number of new listings coming on the market on a weekly basis over the past four years. The activity this year is represented in orange.
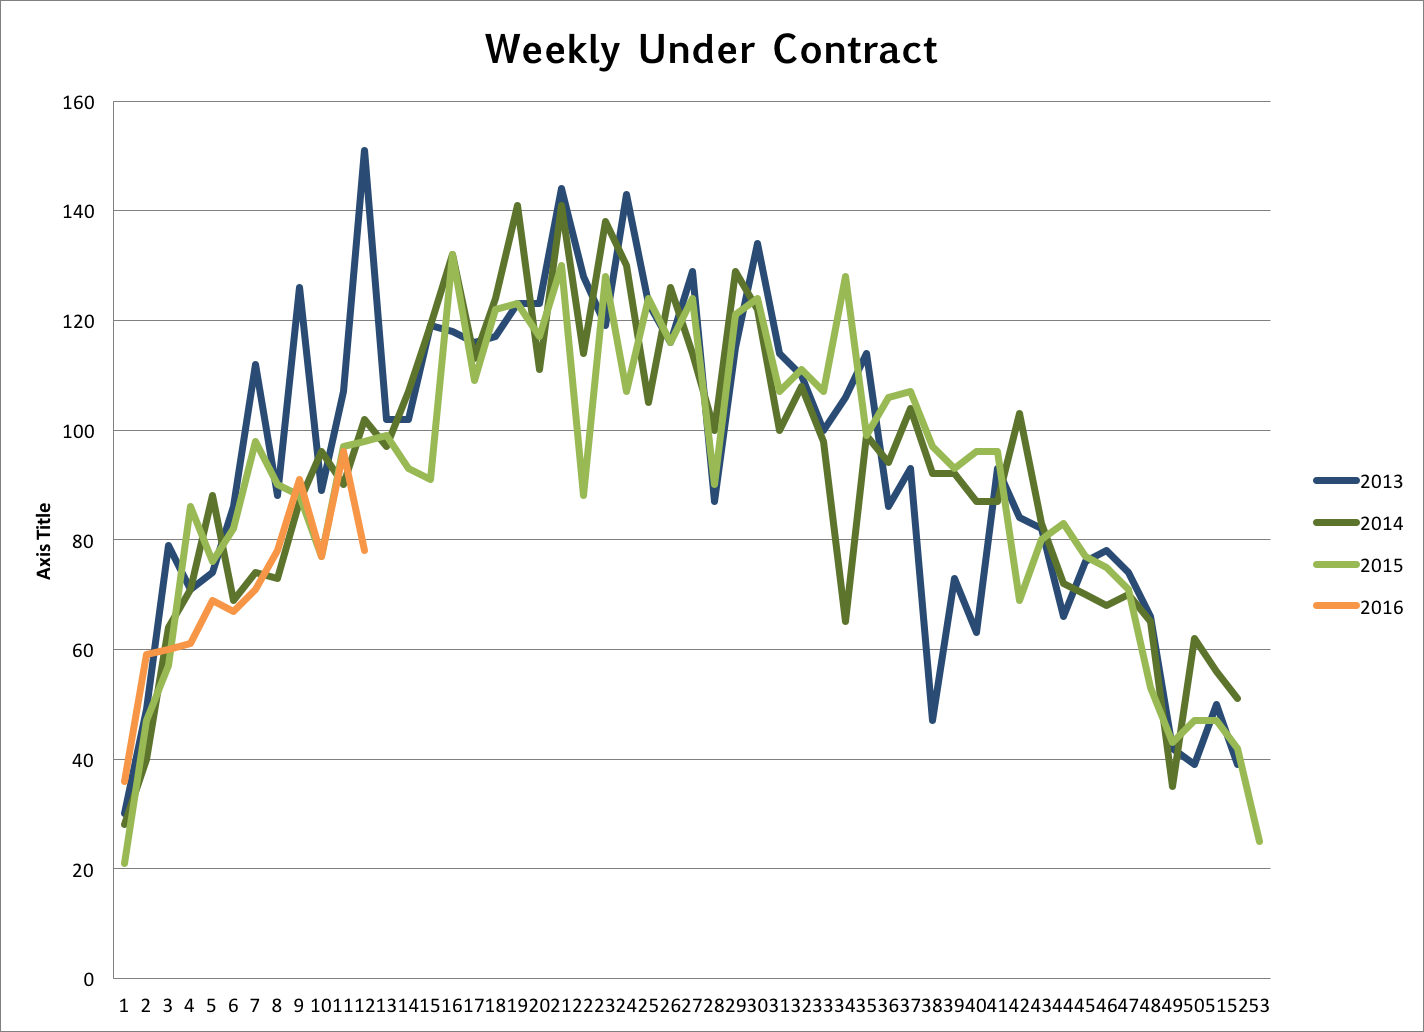
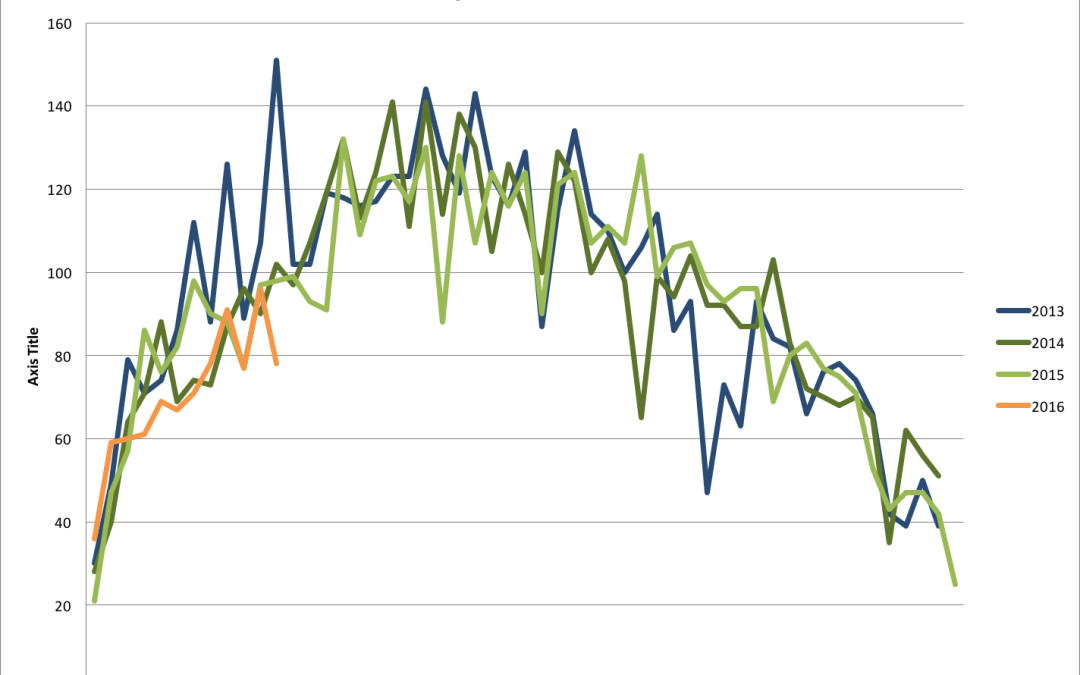
 A forward indicator to future sales is the number of properties that go under contract. The usual gestation period between a house going under contract and getting to the closing table is between 30 and 45 days. The chart below shows the flow of properties going under contract on a weekly basis. The last few weeks have been trailing the average we expect to see this time of year. This leads me to believe that March and April’s sales will not be making up ground on last years closing. The slideshow below shows more statistics that give a broader picture about what is going on in the Boulder County real estate market.