by Neil Kearney | Feb 27, 2019 | Boulder Real Estate, Visiting Boulder
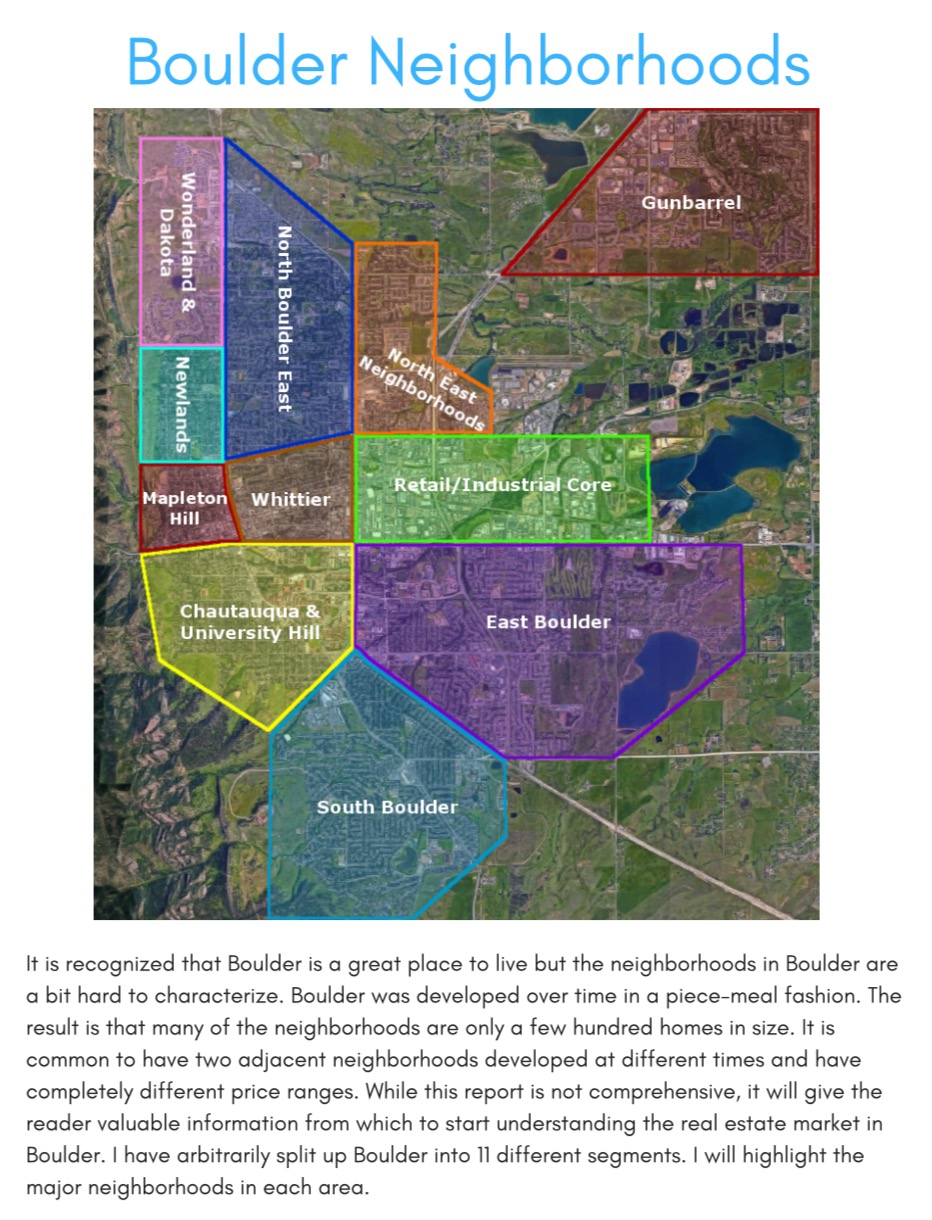
 I realized a few years ago that people coming from out of town were having a hard time making sense of the different neighborhoods within Boulder. In response, I created The Boulder Neighborhood Guide. In this report I have split Boulder into eleven different areas and present the lifestyle highlights, schools, shopping districts, local recreation, basic real estate statistics and a sample of sales from the previous year for each area. If you’re interested in learning more about the different neighborhoods within the City of Boulder this may be helpful.
I have just finished updating The Boulder Neighborhood Guide for 2019 and invite you to view or download it. Here is a PDF copy Boulder Neighborhood Guide 2019
If you are visiting Boulder you may be interested in where to stay, where to eat, things to do and how to get around. You may also be interested in walking some of Boulder’s neighborhoods. I have created a few self-directed walking tours in Boulder that may be fun if you are visiting town. To access all of that information go my “Visiting Boulder Page”
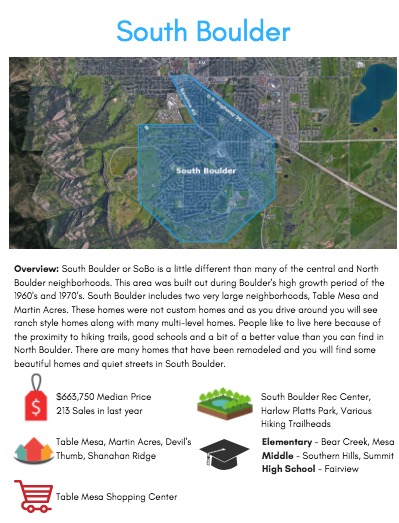
Here are a few example pages from the report:
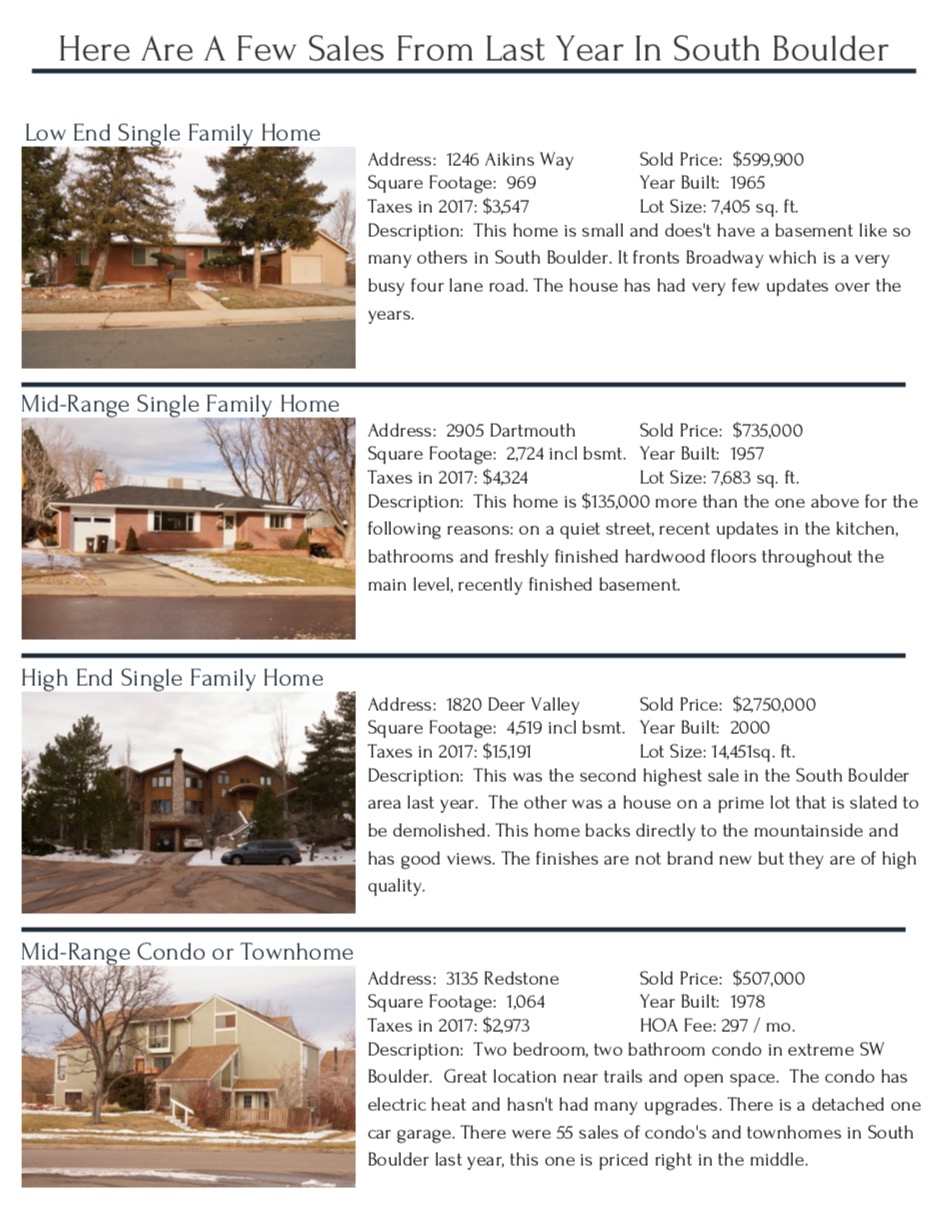
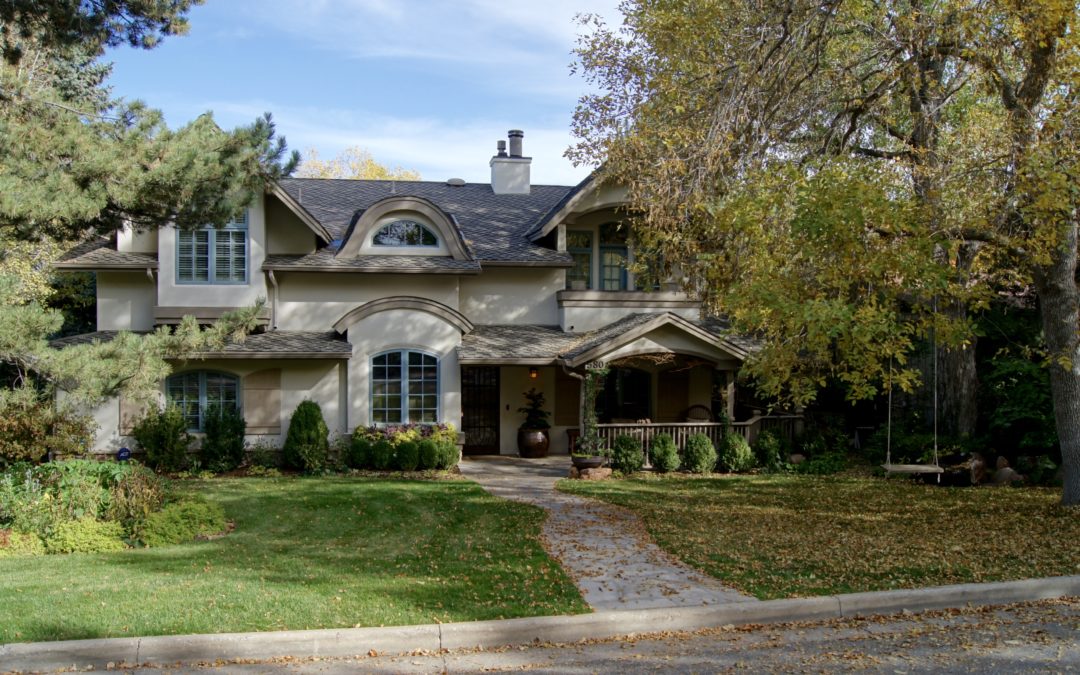
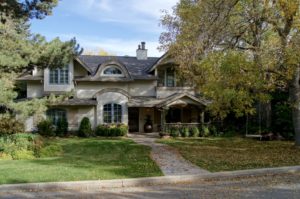
A note about the photography of the listings. In presenting a consistent sample I chose homes in an area that were: at or near the low end of the price range, one at the median price of single family homes and one at the very top of that areas price ranges. For condos and townhomes, I choose one at the median price. I didn’t choose my listings. I also respect the copyright of those photos that are taken by others and found on the MLS and other websites. So I drove around this winter and took photos. Definitely not the typical real estate glamour shot.

by Neil Kearney | Oct 10, 2018 | Boulder Real Estate, For Buyers, For Sellers
I love what I do because I get to interact in a meaningful way with some fantastic people! Here are a few testimonials that have come in from clients that I have had the privilege to work with over the past few months.
“Neil’s wealth of knowledge, combined with his relaxed, no-pressure manner, make for a more-than-winning combination. He is completely familiar not only with the benefits and drawbacks of different geographical areas, but he also knows about houses from the inside out! He can explain electrical and plumbing issues; materials; grades and everything else. Neil is a keen observer, often pointing out things we missed. He went above and beyond by creating a special spreadsheet for us when we were stuck on a pricing issue. You never have to wait for a response from Neil either, so important during any real estate experience. Buying or selling a house can be a trying time, but we loved working with Neil, and highly recommend his services.” Suzanne Dingwell
“Our family is so grateful to have had Neil help us sell our home. He went above and beyond what one would expect from a real estate agent. His professional approach in nailing everything down from market trends in our area to providing helpful suggestions to set up our home for sale was one of a kind. Neil was always available to answer questions, ease our minds and even lending a hand with sale preparation tasks. He always welcomed our input and and made things very clear and understandable. We can truly say that Neil became like family. Again, his professionalism and amazing knowledge of real estate markets topped off with his genuinely kind and caring approach cannot be beat. We could not have made it through any of this process without Neil. Our family will only recommend his agency and will never consider anyone else in the future when the time comes around for us to buy or sell any property. Neil is not only a wonderful person, but also the best agent in Boulder and the surrounding area. THANK YOU NEIL!!” The Kosenski Family
“We would highly recommend Neil Kearney and would not hesitate to use him again. We have worked with Kearney Realty for over 20 years and received incredible service in four real estate transactions over the years. Neil recently worked with us for several months and was very patient until we found our perfect home. He was very knowledgeable and a strong advocate when we were ready to buy, and he was not afraid to point out potential problems or assets with homes when we were looking.” Bill and Connie Barclay
“I can not recommend Neil highly enough! I have dealt with many agents over the years, and working with Neil was an A+ experience. He answered all my dumb questions, and he answered immediately, at all times of day or night. He took care of innumerable details, and went above & beyond, even weeding the property to make it show better! I would not hesitate to recommend him 100%, and I would definitely employ him again. Especially if you have had a bad prior experience with a real estate agent—give Neil a try. His integrity is unimpeachable.” Marsha Conway
Click here to read more testimonials
by Neil Kearney | Mar 12, 2018 | Boulder County Housing Trends, Boulder Real Estate
Boulder Neighborhood Guide
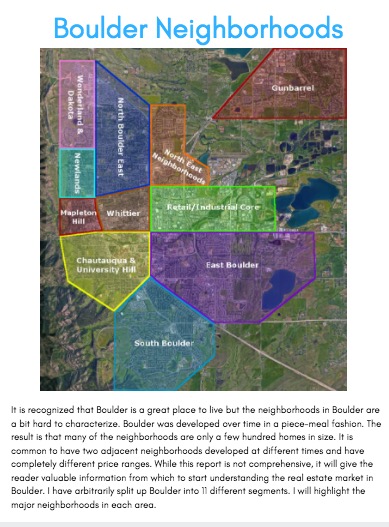
 I realized a few years ago that people coming from out of town were having a hard time characterizing the different neighborhoods within Boulder. In response I created The Boulder Neighborhood Guide. In this report I have split Boulder into eleven different areas and present the lifestyle highlights, schools, shopping districts, local recreation and basic real estate statistics for each area. If you’re interested in learning more about the different neighborhoods within the City of Boulder this may be helpful.
I have just finished updating The Boulder Neighborhood Guide for 2018 and invite you to view or download it. Here is a PDF copy Boulder Neighborhood Guide 2018
If you are visiting Boulder you may be interested in where to stay, where to eat, things to do and how to get around. You may also be interested in walking some of Boulder’s neighborhoods. I have created a few self-directed walking tours in Boulder that may be fun if you are visiting town. To access all of that information go my “Visiting Boulder Page”
by Neil Kearney | Feb 25, 2018 | Boulder Real Estate
Boulder County Luxury Report
Sales
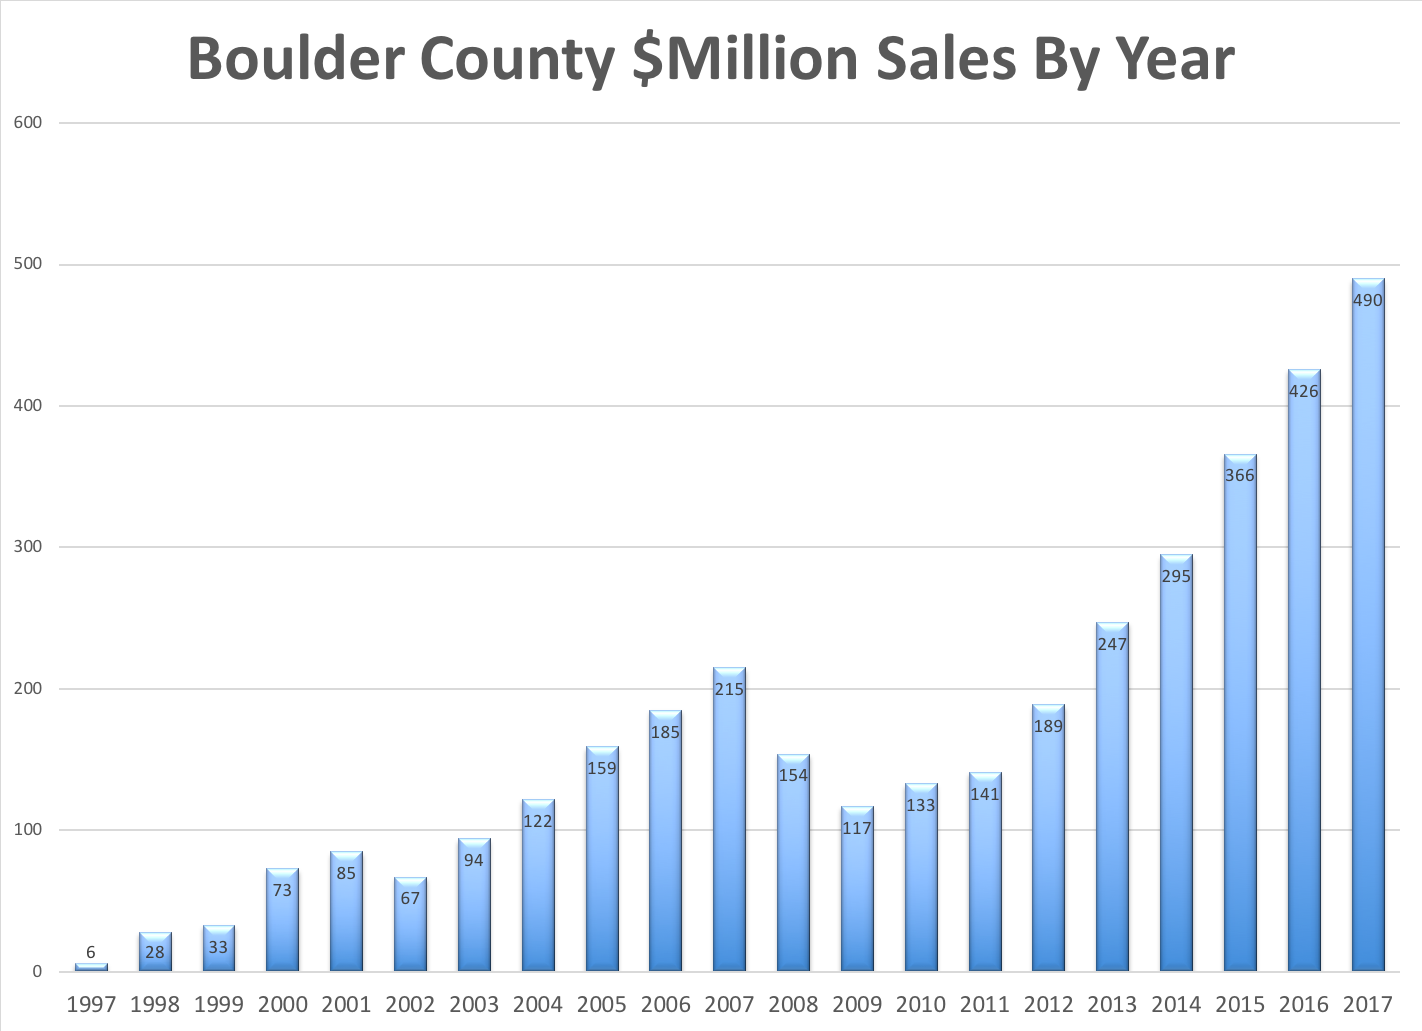
 2017 was a record year for luxury real estate in Boulder County. During the year a record 490 properties sold for over $1 million. Eclipsing by 15% last years total of 426. As you can see by the chart below, the growth of the luxury market segment in this area has more than doubled since the pre-recession high in 2007. The main factors causing this impressive growth are price appreciation and capital improvement. Overall, the average home in Boulder County has appreciated approximately 60% over the past five years. This has naturally brought homes that were not previously considered “luxury” into the $1 million plus range. We have also seen an overall improvement in the housing stock over the past decade. Expensive homes have been built on vacant lots and a significant number of homes have been extensively updated and expanded turning “stock” homes into showcase homes. If you have had any work done recently to your home, you know that contractors are not easy to find and prices for renovations have gone up significantly. Another factor in the quick rise in prices are the required “green” features and high permit fees which add to the cost of construction.
The top priced sale for the year in the MLS was $6,700,000 and the median price for all sales over $1,000,000 was $1,370,000.
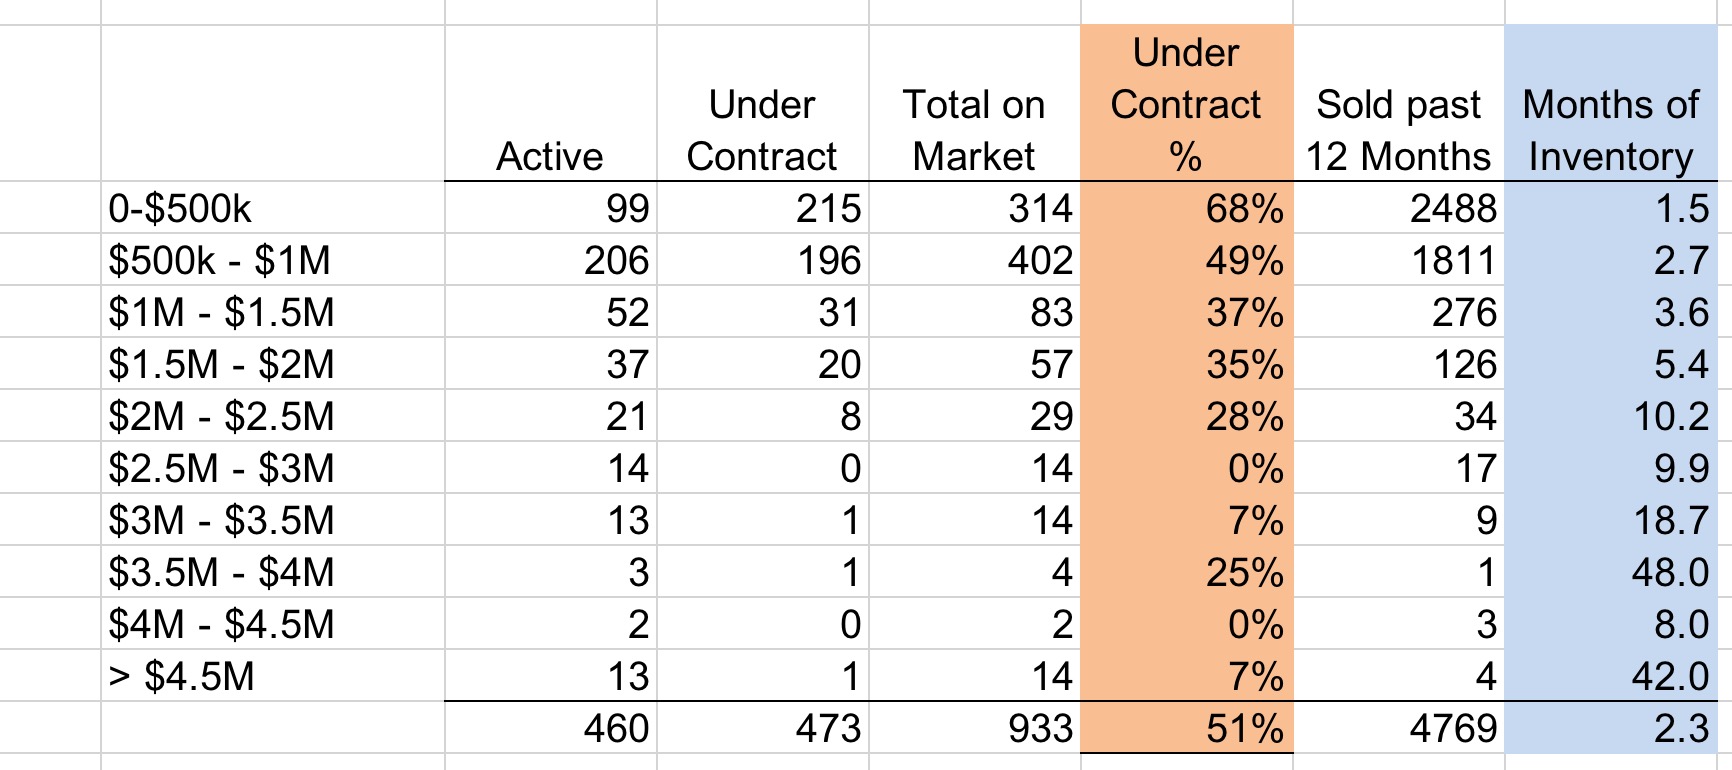
Analysis of Current Inventory
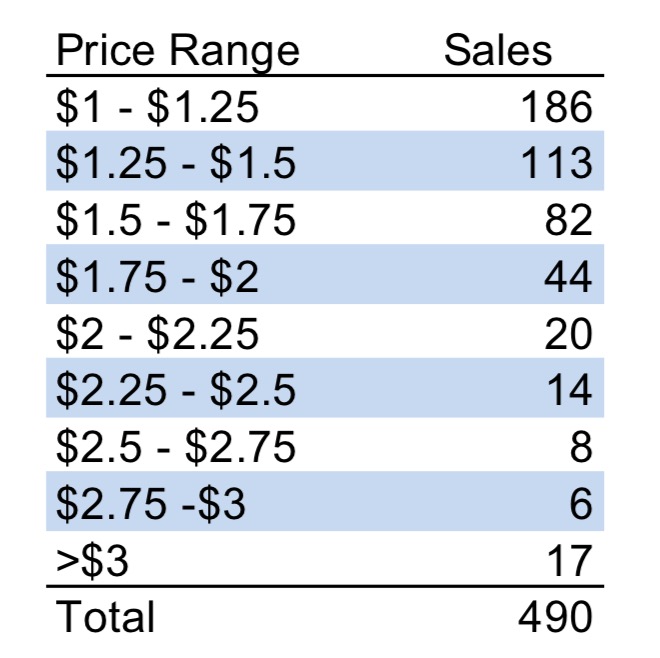
The table below shows the current listings in Boulder County by price range (as of February 24, 2018). Let’s first talk about the orange column which shows the percentage of homes that are currently under contract. Not surprisingly the price ranges below $1 million are very tight. But more surprisingly is the good activity in the luxury market. Below $2 million 36% of active listings are already under contract. Between $2 and $2.5 million it just drops to 28% but above $2.5 million the activity drops significantly with just 6% of those listings having already found a buyer.
The blue column shows “months of inventory” which is sometimes called absorption rate. This shows the relation of total homes on the market by price range to the number that have sold over the past year. Basically it measures the flow through the market and tells us how much inventory is backlogged. A low number means a fast moving market and a high number means a slower moving market. According to NAR a balanced market is 6 months of inventory. According to these numbers it is a sellers market to some degree up to $2,000,000. The lower the price range the stronger the sellers market. Over $2,000,000 it becomes an increasingly strong buyers market at least in terms of inventory.
On the right below is a breakdown of sales in 2017 by price range (in $ millions).
Negotiation and Price Compression
1) Why doesn’t the luxury market in Boulder seem to be going up as fast as other segments in the market? According to FHFA.gov the average home in Boulder County has increased in value by over 60% over the past five years. However, most of the luxury market hasn’t appreciated nearly that much some owners even wonder if they can recoup their construction costs. Why? There are a number of factors involved but the main factor is supply and demand. Even as the number of luxury sales has increased, buyers have always had more homes to choose from per buyer than in the lower price ranges. This choice has resulted in more negotiation (more on this below) and fewer multiple offer situations. The overall supply of luxury homes has increased dramatically over the past ten years and many would-be buyers have built rather than buying an existing home. Buyers also have very high standards for homes in the luxury range. A home that was brand new ten years ago can be considered “dated”.
2) In 2017 the average negotiation off of list price for all properties sold in Boulder County was 1.39%. However,, if we break it down by price range we see a discrepancy. Homes that sold for $500,000 or less on average sold for .9% above list price. Homes between $500,000 and $1,000,000 sold for .4% above list price. Homes between $1,000,000 and $2,000,000 sold for 2.75% below list price. And homes that sold for $2,000,000 and greater sold for 4.17% below list price.
3) The above factors have conspired to compress the gap between price ranges. The homes in Boulder that used to be $700,000 are now $1,050,000 and the homes that were previously $1,500,000 are now $1,700,000. On average a buyer can get a relatively better value by buying a home in the higher price range.
Will the New Tax Laws Affect Luxury Real Estate in Boulder County?
It may. The two issues involved are mortgage deductibility for loans over $750,000 and the limit of deductibility of local and state taxes including property taxes to $10,000. Our local tax rates are not as high as other area in the country, and from my experience, local buyers tend to bring a lot of cash to a luxury transaction, but these new factors may cause buyers to consider lower priced properties to avoid these tax limitations.
Current Listings
Here is a list of active listings in Boulder County that are priced above $1 million. This list constantly updates and those marked “backup” are under contract. Click on any listing to see more detailed information.
[optima_express_gallery_slider id=”682907″ rows=”1″ nav=”top” style=”grid” columns=”3″ effect=”slide” auto=”true” maxResults=”200″]
by Neil Kearney | Jan 15, 2018 | Boulder Real Estate, For Buyers, For Sellers, Statistics
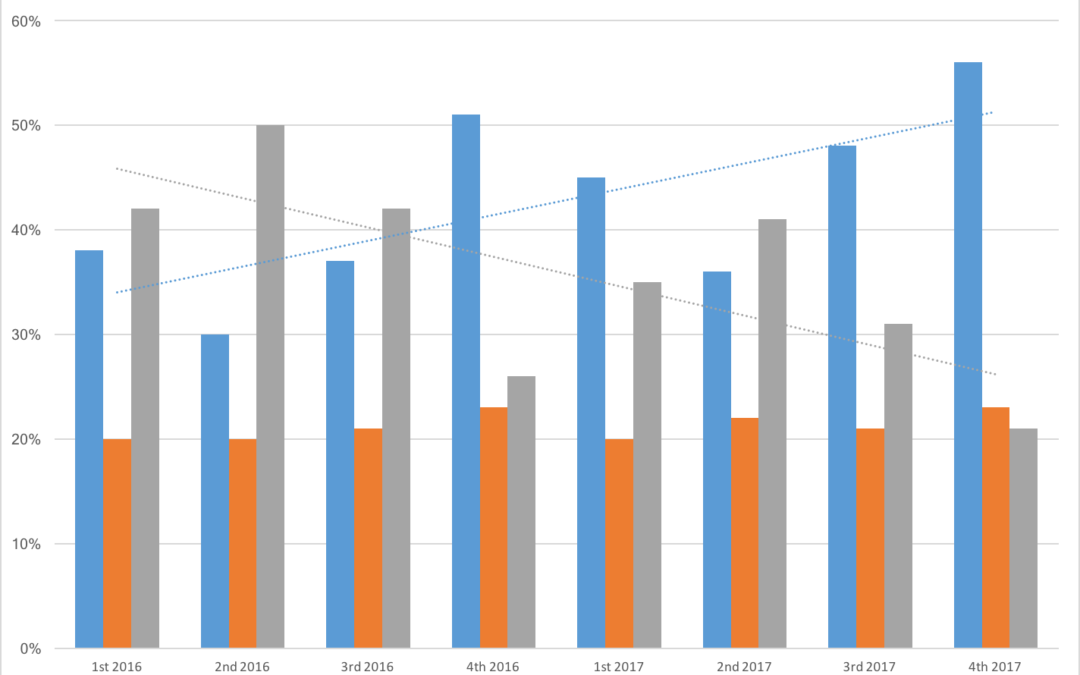
In 2017 in Boulder County, the average negotiation off of list price for all sales was 1.3%. In 2016 it was .36%. However, when you look at it more closely both over time and across price ranges there are some good market insights. The chart below shows the sales in each of the last four quarters separated into three categories; those that sold for below the list price (blue), those that sold for exactly list price (orange), and those that sold for above list price (grey). As an example, let’s look at the second quarter of 2016 which is the second group from the left. During that quarter Boulder County was ranked #1 in the nation for appreciation by FHFA.gov. During the quarter, 30% of the sales went for less than the asking price, 20% went for exactly the list price and 50% of the sales sold for a price in excess of the asking price. This past quarter 56% sold for less than list price, 23% went for exactly asking price and 21% went for above the list price. The overall take away is that buyers have gained some traction in negotiations. There are two trend lines that intersect. The upward trending blue line represents the trend of properties selling below the asking price. The downward trending grey line shows the trend for homes selling at a premium.
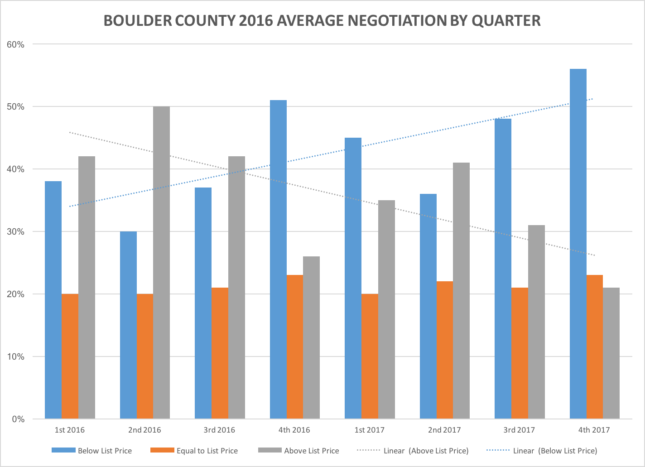
With the information above we can conclude that the overall market is trending away from a strong sellers market. But in real estate broad generalities are not always accurate. When we look at individual price ranges we find that the lower range is still very strong and in the luxury ranges the market has shifted more strongly toward the buyer. During 2017 the average sales price to list price ratio was 98.7%. In other words, on average buyers were able to negotiate 1.3% off of the list price. However, when we break this down by price range we find that during 2017:
- Homes that sold for $500,000 or less sold for .9% above list price.
- Homes that sold between $500,000 and $1,000,000 sold for .4% above list price.
- Homes that sold between $1,000,000 and $2,000,000 sold for 2.75% below list price.
- Homes that sold for prices above $2,000,000 sold for 4.17% below list price.
The bottom line is that if you are buying a house in the entry level of any of the Boulder County communities you won’t have much wiggle room on price. If you are in the market for a home in the luxury range you will have much more room for negotiation. Don’t be fooled by averages.
by Neil Kearney | Dec 5, 2017 | Boulder County Housing Trends, Boulder Real Estate, For Buyers, For Sellers, General Real Estate Advice, Real Estate 101
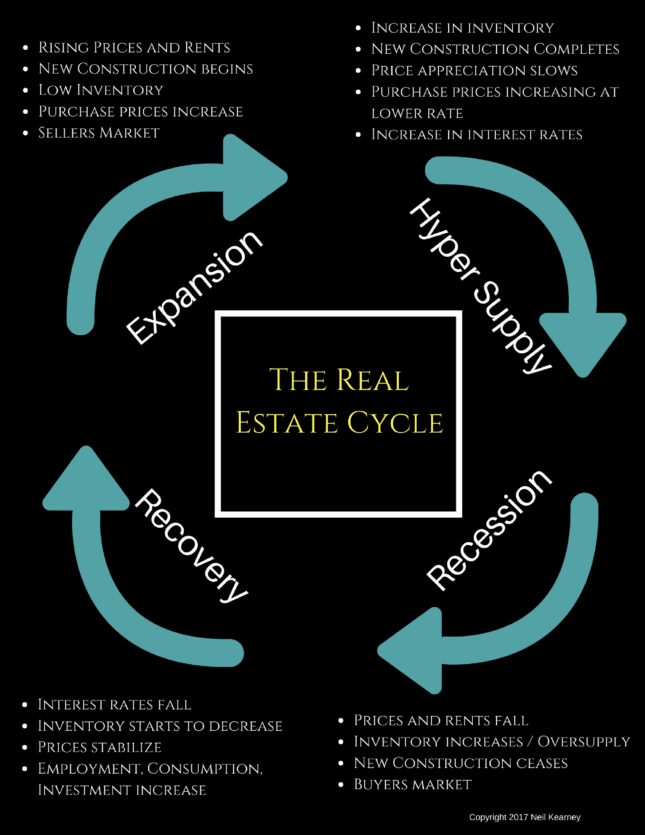
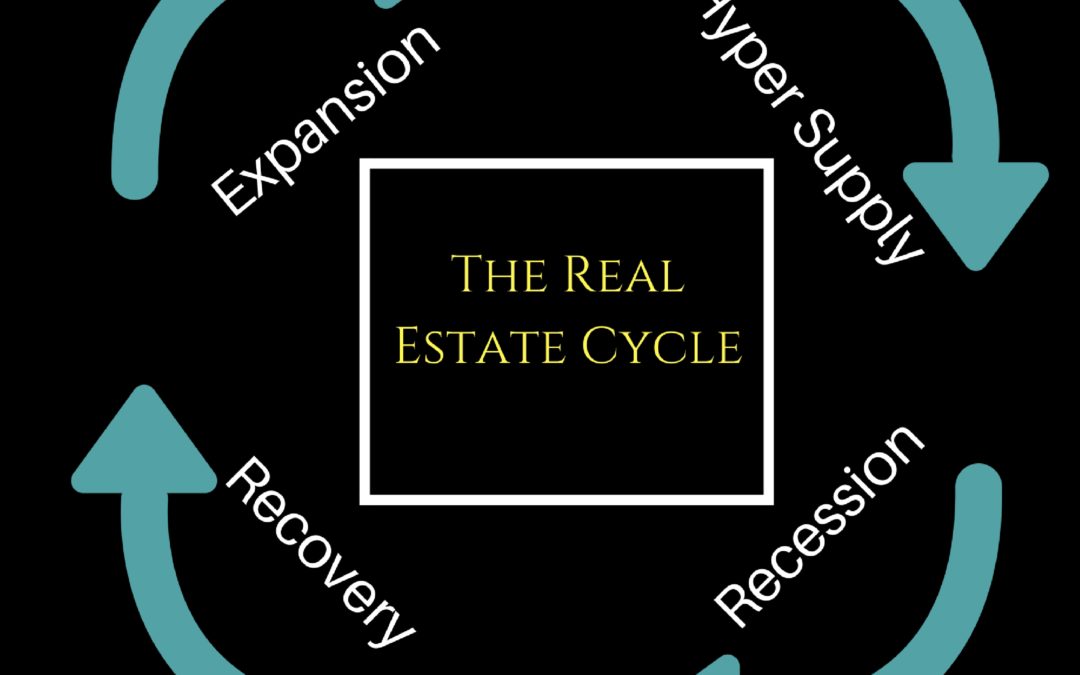
The Real Estate Cycle
Approximately 2500 years ago Heraclitus of Ephesus said “The only thing that is constant is change”. In the moment we sometimes forget that forces larger than we can see are slowly moving culture, markets and people. Everything we see is changing, however the rate of change makes a difference. We notice more readily the melting of an ice cream cone than the erosion of a mountain. It’s normal to only take note of what we can readily see. However, there is wisdom in taking a longer view.
Real estate is cyclical. There are many factors involved, but the peaks and valleys of the real estate demand and value have been shown to have a relatively consistent cycle of approximately 18 years. Economist Homer Hoyt made a detailed study of the Chicago real estate market and the broader United States real estate market and found that it has run its course in a steady 18 year rhythm since 1800. There have been exceptions that have disrupted the normal cycle such as The Great Depression, World War II and the post war boom but on average, the business cycle and the real estate cycle have been very consistent including the 18 year cycle than ended in 2008.
The infographic above shows the four phases of the real estate cycle. Here is more information on each of the stages of the cycle. Most studies present Recovery as the first phase of the cycle, but since the last recession was so memorable I think it makes a good starting point.
Recession
Think back to what was in the news in 2008 – 2011: Foreclosures, unemployment, short sales, mortgage reform, lowering interest rates, 40% drop in real estate sales, stock market losing value, declining home prices (Boulder was one of the few markets to hold most of its value), consumers reducing spending, rental vacancies, lower rents, incentives to buy and lease, etc. etc. The situation was shocking, many of the US real estate markets had just climbed to all time highs, buyers were using easy credit to buy multiple homes thinking that the easy money would continue indefinitely. And it did, until all of a sudden it crashed. Fortunes were lost. Especially for those who couldn’t hold on for the recovery. This was the low point in the economy and the real estate market. The signs to look for when recession is on the horizon are; interest rates are raised to slow an over heated economy, increased inventory of unsold homes, higher rental vacancies, new construction shows with more unsold inventory and higher interest rates (although some developers who are late to the party always get caught), mortgage delinquencies increase which leads to more foreclosures. During the recession it is a buyers market. Those with the wherewithal should purchase real estate at a discount.
Recovery
This is the bounce off the low point. During this phase the inevitable march of population slowly increases the demand for real estate and other goods. Accumulated inventory gets absorbed, vacant rental units get rented, adult children slowly move out of their parents basements, the Fed lowers interest rates to stimulate demand. With favorable interest rates businesses expand. They hire more employees, make capital investment. During this phase, prices stabilize, excess inventory gets purchased and there is virtually no new construction (developers are licking their wounds), in the aftermath of the recession, banks are very careful about lending.
Expansion
Recovery turns to expansion when most of the available inventory has been absorbed by individuals of businesses. Rental occupancy rates are higher than average, new construction finishes are at a low and stalled projects finish out, built up foreclosure inventory is all but gone. Once the expansion is recognized developers scramble to fill the new demand by planning new projects. However, developing property takes 2-3 years from start to finish so this isn’t instantaneous, there is a lag. With very little new construction the demand for re-sale homes is very strong. This results in rising prices and in some markets the supply demand discrepancy results in multiple offer situations that further exacerbate price increases. In times of unusually low inventory during this phase (before the new construction projects which have been in development are complete) prices tend to reflect an anticipation of where the market is headed rather than the current market price. This is a sellers market. As the expansion phase matures buyers and renters have increased choices but continue to find new places to live. Positive pressure on prices slows. The real estate market falls into a phase of balanced activity. As long as the broad economic forces are stable, this phase can last quite some time. People have jobs, they start families, they buy cars, the buy houses, they buy refrigerators. Companies are making profits, they continue to invest in infrastructure.
Hyper Supply
The delineation between market expansion and hyper supply is marked by an increase in unsold inventory and and increase in rental vacancy. The projects which were started late in the expansion phase continue to come available but to an increasingly tepid response. Growth in prices is decelerating. If developers recognize the turn in the market and stop building, the coming recession can be softened considerably. In this phase, housing, rental units and office space become over built. As interest rates rise we are then led into another recession.
Where Are We Now?
First let’s eliminate where we know we are not. We are not in recession, nor are we in recovery. Over the last ten years, the Boulder area real estate market has come through the recession phase and then quickly moved through the recovery phase. I say quickly because we were fortunate not to have a big back log of foreclosure homes that needed to be sold. Since mid 2012 we have been in the expansion phase. Throughout the Denver Metro Area we have seen unprecedented construction of rental apartments. We have seen a steady stream of new residents drawn to our area by a good economy and a great lifestyle. We have seen compounding double-digit real estate appreciation that rivals the top markets in the nation. Early this summer, the temperature of the expansion seemed to have been turned down a few notches and we are now seeing a slowing in price appreciation and a bit less demand. However, our inventory is still very low and the overall economy is still doing well. We seem to be at the beginning of a cycle of increasing interest rates but a 30 year mortgage is still at around 4%. To me it seems like we are still in the expansion phase, but if each phase was a day we would be definitely in the afternoon. Here are the next signs we need to look for which would indicate a shift toward the hyper supply phase: 1) increased vacancy rates on rental properties 2) Meaningful increase in interest rates 3) Increased inventory of resale homes for sale 4) New home builders offering incentives and price reductions.
If we are to believe that the real estate cycle runs in an 18 year cycle, we would expect our next major recession in 2024. If you would like to discuss a personal strategy as it pertains to the real estate cycle I invite you to contact me. Neil Kearney, Kearney Realty Co. Neil@NeilKearney.com 303-818-4055