by Neil Kearney | Jan 25, 2017 | Boulder County Housing Trends, Statistics
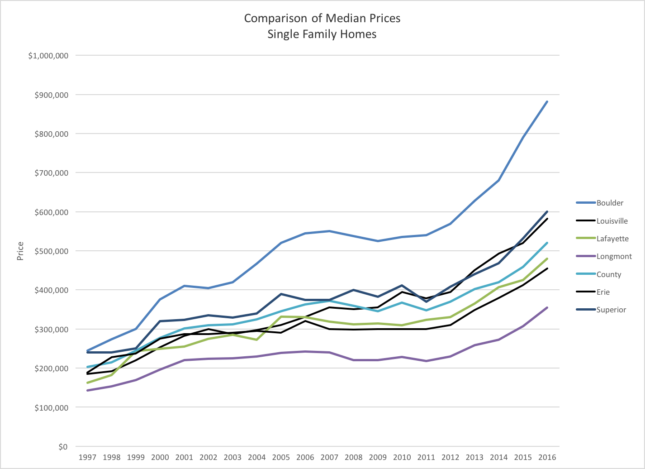
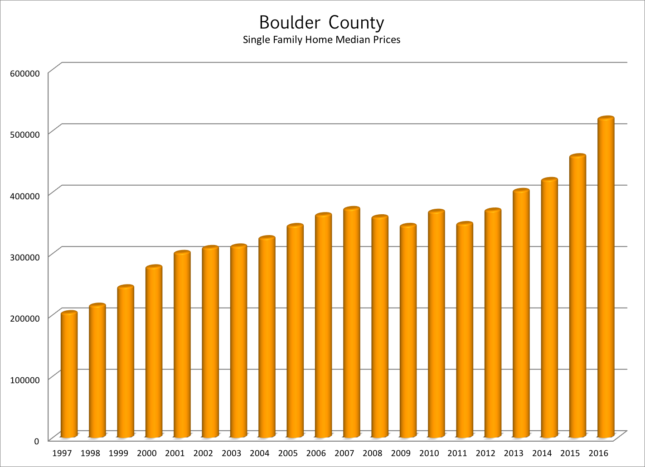
The median price of residential (including single family and attached dwellings) home sales in Boulder County during 2016 was $450,000. This was up roughly 12.5% for the year. But this is far from the whole story regarding home prices in Boulder County. As we break the statistics down into the individual communities throughout the county we start to get a broader sense of what is happening. The first graph below shows the median single family home prices of each of the local communities since 1997. Over the last twenty years Boulder has really outpaced the other communities in the area.
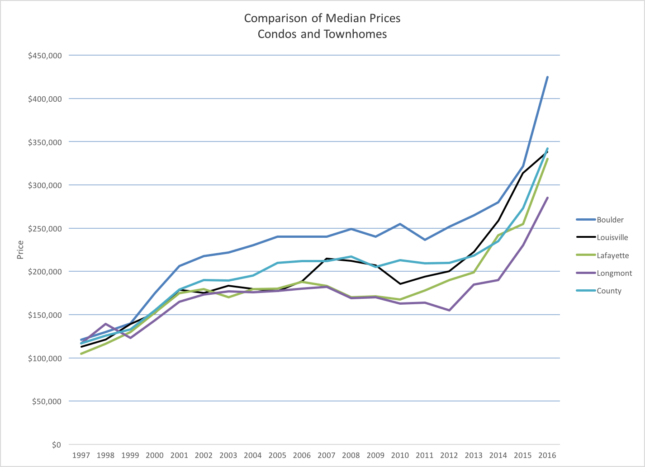
The comparison for attached dwellings (condos and townhomes) is similar but not quite so differentiated.
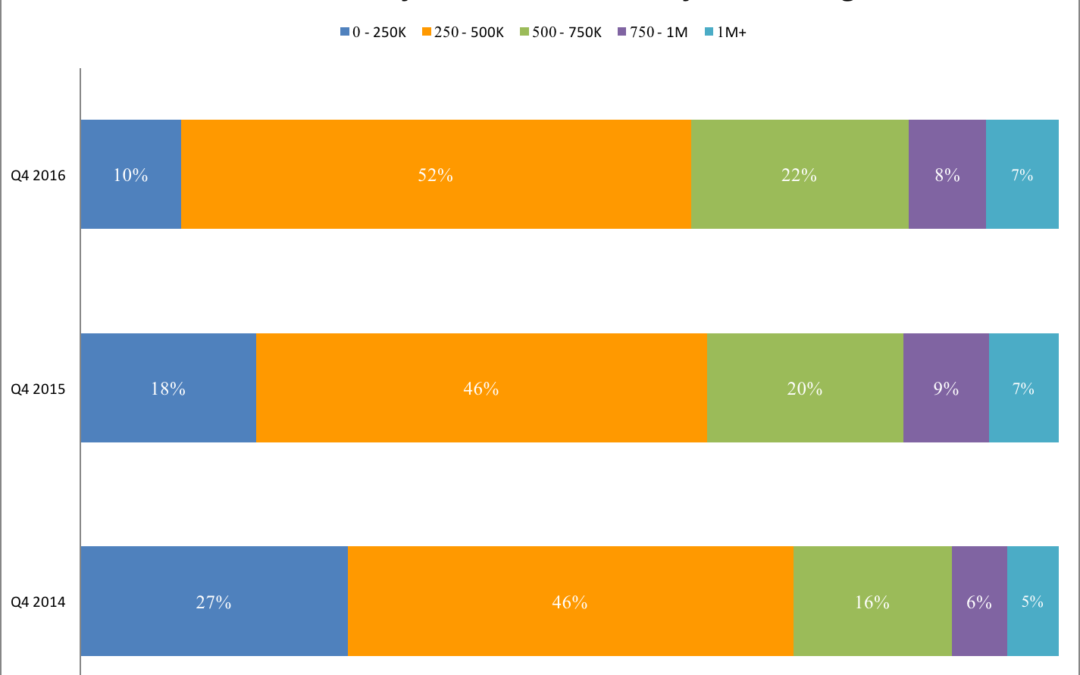
Another way to look at the prices in different communities is to break down by price range where the sales took place in each community. First let’s start with the county as a whole.
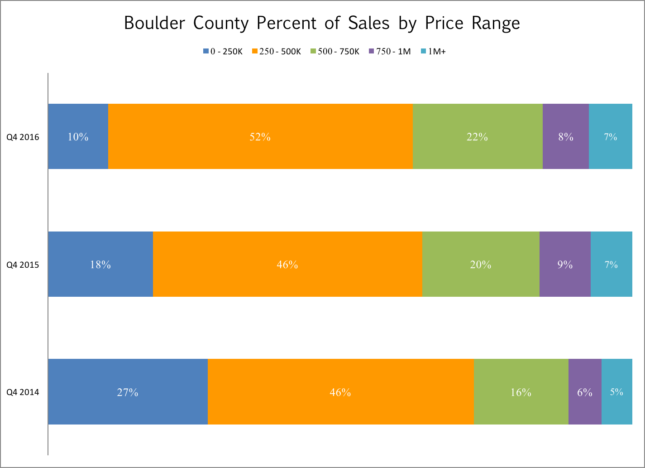
During the most recent quarter 62% of all sales were less than or equal to $500,000. This percentage has been relatively stable over the past three years (comparing just 4th quarters). However, the lower price range ($0 – $250,000) has decreased 17% and those sales have moved to the right.

Boulder is more expensive! This isn’t news. Just 36% of all sales were $500,000 and below. It’s interesting to look at the more equal dispersion of sales across all price ranges. Over the last three years the entry level has shrunk by 2/3 and the high end has increased.
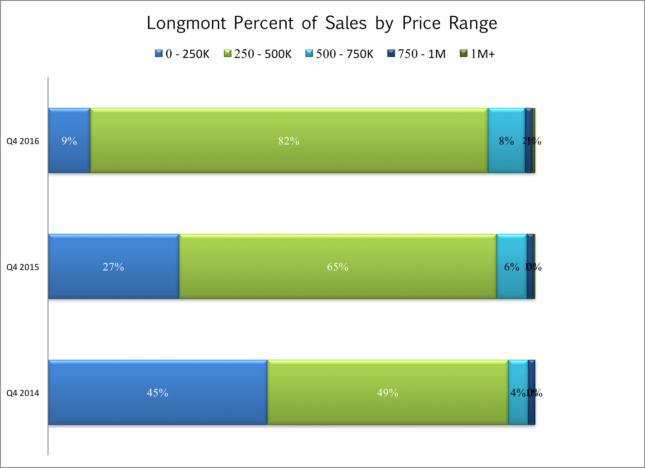 The sales mix in Longmont is completely different that Boulder. 91% of sales are $500,000 or below. 82% of sales are between $250,000 and $500,000 and over the last three years the entry level has shrunk from 45% to just 9%.
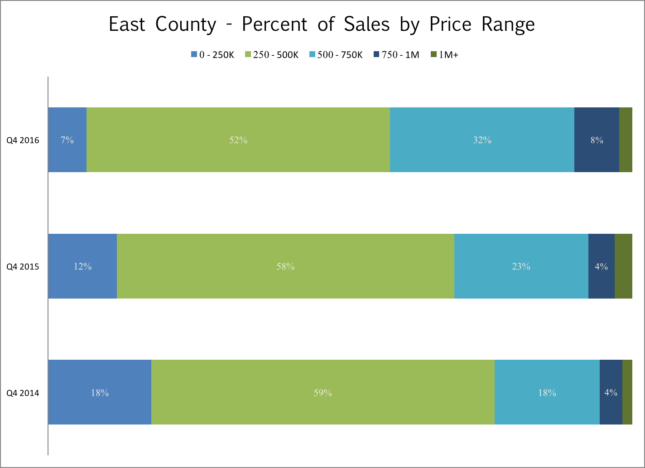
In between Boulder and Longmont are the other communities in East County. The graph below puts Erie, Superior, Lafayette and Louisville together. During the most recent quarter in those communities 59% of sales took place at or below $500,000. The $500,000 to $750,000 price range is really growing and$1 million plus sales are still rare in those communities (doesn’t include unincorporated Boulder County).
Prices are rising but there is still a nice mix of price ranges within a reasonable commute to anywhere in Boulder County. It’s always been a trade-off between price, location and condition. But now the entry point is higher.

by Neil Kearney | Jan 23, 2017 | Boulder County Housing Trends, Statistics
The Boulder real estate market was one of the hottest real estate markets in the nation this past year. During the second quarter FHFA.gov ranked the Boulder market, which includes all of Boulder County, the number one market for annual home appreciation. However, since the super busy spring and early summer months, the market has slowed down a bit.
The combination of strong migration to our area, low interest rates, a strong local economy and low home inventory created the perfect storm in terms of increasing home prices. In general, 2016 was a great time to be a seller and a frustrating time to be a buyer. The remainder of this report will explore in detail the factors that affected the Boulder real estate market over the past year.
Home Price Appreciation
Strong price appreciation has been the direct outcome of the positive household creation and the lack of inventory. Strong demand and limited supply results in increased prices. According to FHFA.gov, home appreciation in Boulder County averaged 10.56% for the one-year period ending September 30th 2015. (See below) This ranked us 14th in the nation. The year end median prices for all residential sales in Boulder County showed an increase of 12% from a year ago and up 43% from the end of 2010.
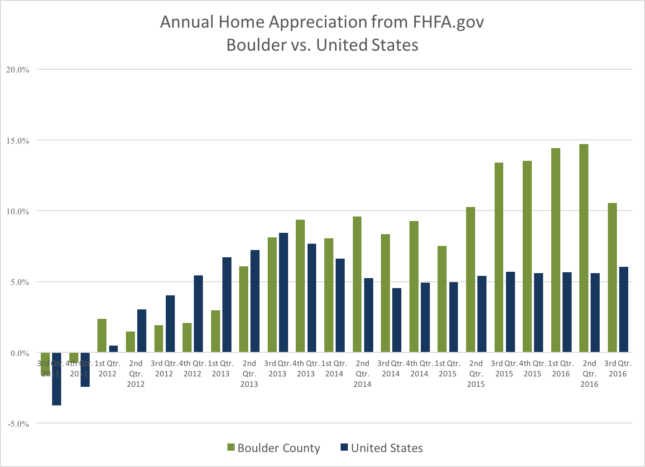
Median prices in Boulder County have increased 156% since 1996. Boulder County has been one of the most stable markets in the country. Here is a graph showing appreciation over time for single family homes in Boulder County.
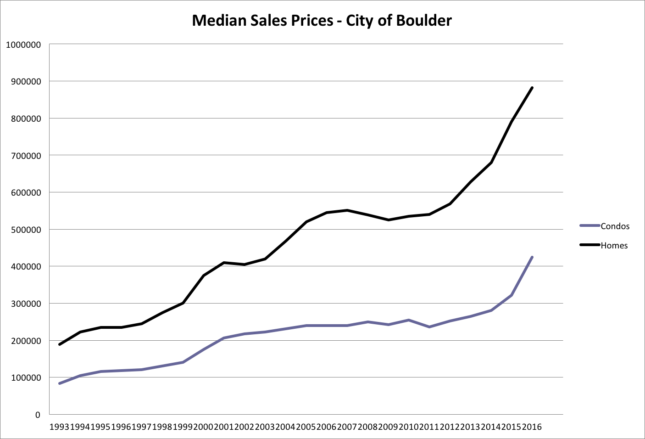
Within the City of Boulder prices of single family homes increased by 11.5% and amazingly condos and townhomes increased in price by 32%. I attribute the big jump in the condo market to the relatively low price point. The median price for 2015 was $321,600 and in 2016 it was $424,900. Still affordable for a place of your own in Boulder compared to a single family home for twice as much.
Demographics
People move to Colorado for the excellent lifestyle, outdoor recreation opportunities, the strong economy, including good employment opportunities and the climate. “Lifestyle” is the new buzzword for people when they are looking for a place to live. Increasingly people are able and willing to pull up roots and move to where they can live a healthy lifestyle. Boulder is definitely on the national radar for this type of person and has been for sometime. For example, on Livability.com, Boulder ranks #5 in the “Best Places To Live” list and #1 for “Best Cities for Entrepreneurs”. Telecommuting, e-business and a proliferation of startups is allowing many people to make their Boulder dreams come true.
Colorado is growing. From July 2015 to July 2016 Colorado’s population grew by roughly 92,000.[1] 30% of this was due to natural increase and 70% was due to net migration. [2] Colorado ranked seventh in the United States in terms of population growth as a percentage at 1.68%.[3] The population gain for Colorado is forecast to be roughly the same for 2016 and then gradually slow. The current population of Colorado is estimated at 5,540,000.[4] And it’s estimated to increase to 7.8 million by 2040.[5] All of those new residents will need housing. Boulder County has gained 97,415 new residents since 1990.
Recently there has been a shortfall in housing units. More households are being formed than housing units built. However, after a building boom of apartment buildings I feel that the pressure of the housing shortage has eased. A personal antidote may illustrate the recent change in the rental market. I recently had a condo that I own come vacant again after just one year. In the fall of 2015 I had many potential renters and was able to choose quickly from among the interested applicants. This year I offered the condo for the same price and over a three-week time frame showed the condo to just two potential renters. I did end up renting the condo for the same rent amount but in order to do so I needed to accept a tenant who I may not have if there were multiple applicants. I’m seeing more for rent signs lingering.
I have a couple of other thoughts regarding migration and population growth as it pertains to Boulder County. As prices rise, Boulder is more and more becoming a destination for the already rich. Will this trend change our town? Will the regular working person be attracted to Boulder when the prices are too high? Are we already there?
During the election three states passed recreational marijuana laws and three others passed medical marijuana laws. It has been highly under reported but the legalization of pot in Colorado has been a boon to tourism, commercial real estate and residential real estate. As we see legalization in other states Colorado will lose its uniqueness. This may precipitate an economic slow down.
Low Inventory
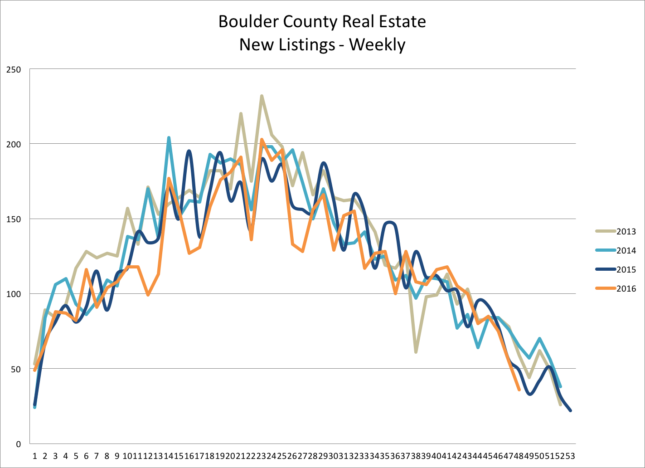
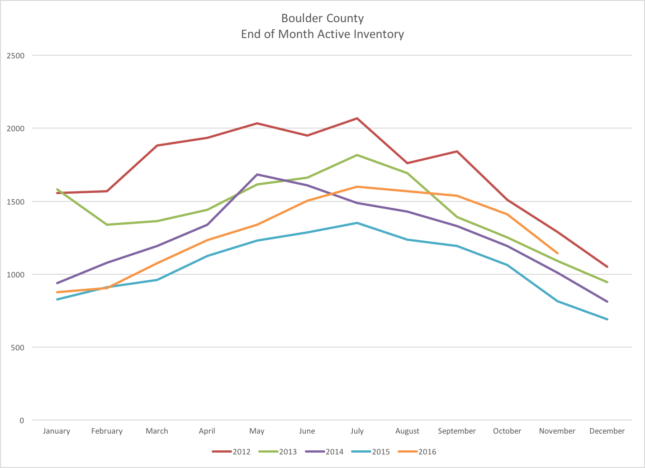
Lack of inventory has been a consistent theme over the past few years. It’s not just that buyers are snatching up the all of new listings, since 2012 we have seen a steady drop in homes on the market. The last part of this year the situation improved a bit but only to 2015 levels. At the end of the year all listings were down 28% from 2012 levels and single family listings were down 60% from 2007. Maybe as prices start to level out, whenever that is, sellers will get back on the selling track.
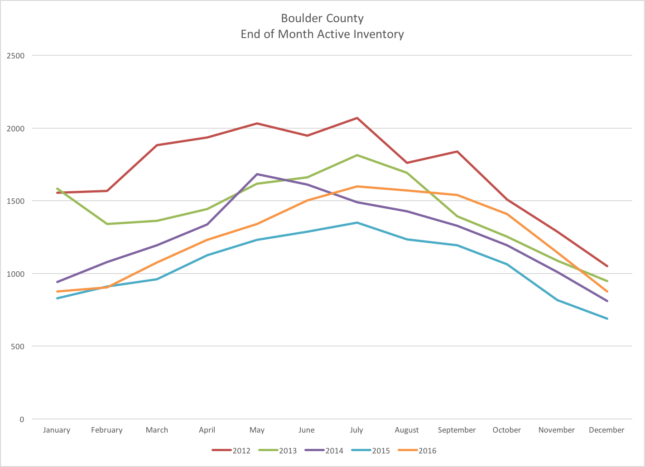
At the end of December there were 877 total homes, condos and townhomes on the market in Boulder County. After subtracting those that were already under contract, there were just 462 available homes to view. This includes all areas and all price ranges!
Low inventory isn’t just a local phenomenon; it is a problem across the country. Here are a few of my theories for this trend. 1) Trade-up conundrum – it’s easy to sell but difficult to buy. 2) Rising prices – when prices are rising rapidly sellers think that if they just hold for a few more years they could sell for 20% more and that would make things easier for them. 3) Let’s fix up and stay instead – because of number 1 and 2 above many would-be sellers have decided that staying and making improvements is the best option. For now low inventory has made it difficult to be a buyer and been a root cause for rising home prices.
Total Sales
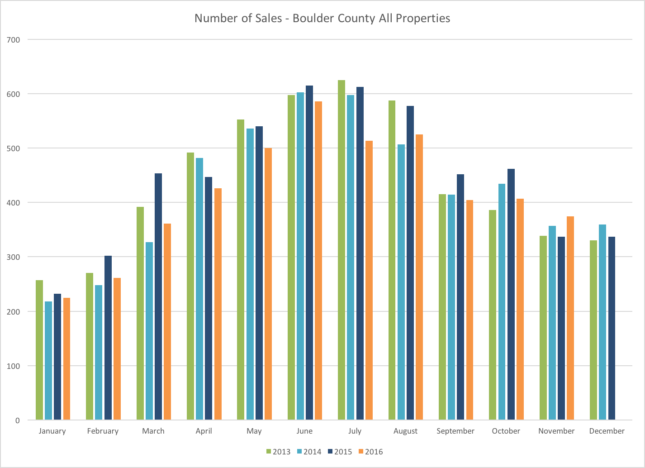
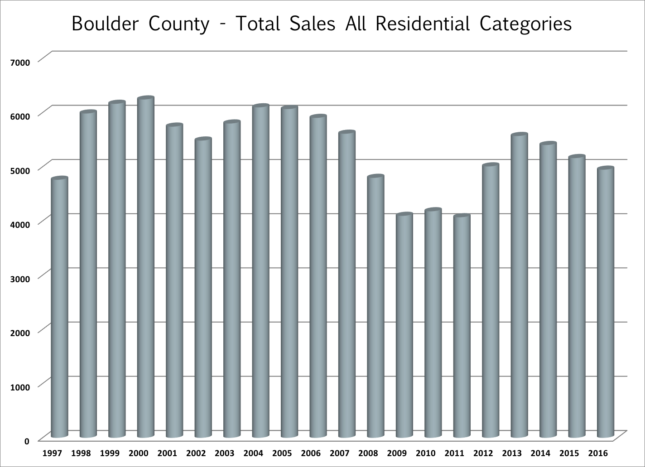
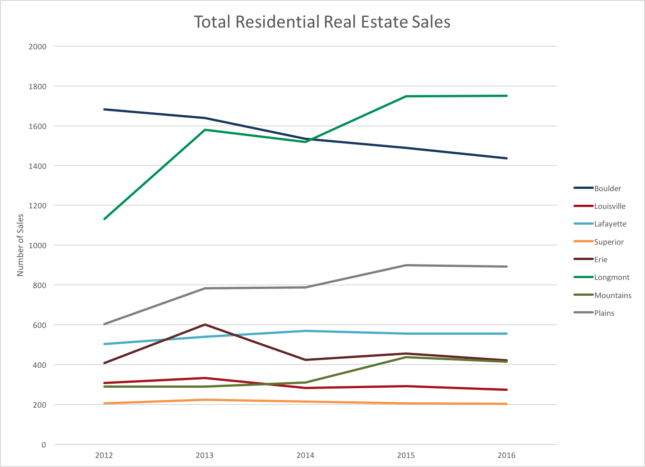
In Boulder County, sales were down 8% for the year. In the City of Boulder sales were down 15%. In the City of Longmont sales were down by just 3.5%. There are now more sales in Longmont than in Boulder. Low inventory while the market was very hot and then a slowing market during the later part of the year combined to stifle sales.
Interest Rates
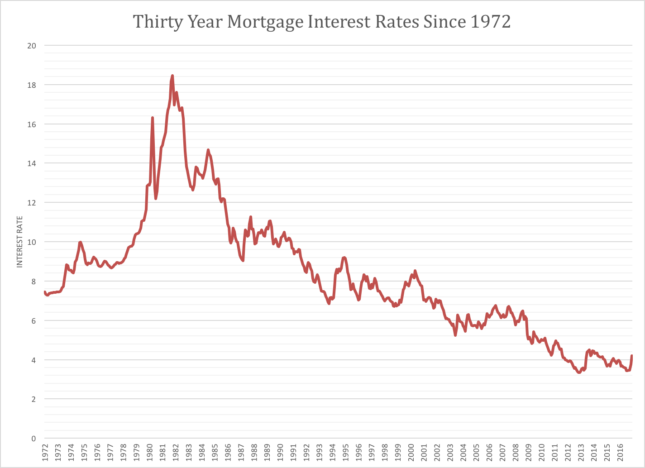
For a number of years, we have all been expecting to see the inevitable rise of interest rates. After many years of lingering low rates we saw interest rates start to move up at the end of 2016. As we began 2016 the 30 year fixed rate was 3.87% it then fell to as low at 3.44% in August and then ended the year at 4.2%. (See Figure B) Historically this is still a great rate, but that’s little compensation for the buyer who was originally pre-qualified in August and has now realized their payment has risen $170 while they have been looking. Low rates have been a boon to the market. Allowing buyers to afford homes even as prices have risen but now that interest rates are rising as well, affordability will be a problem.
Key Statistics for 2016
- The total number of sales during 2016 was down 8% from 2015.
- County wide, the median prices for single family homes were up on average 13.4% and the prices for condos and townhomes were up an impressive 25%.
- On average it took 30 days to go under contract. This was similar to last year.
- For the year 37% of the sales sold below list price; 21% sold at list price and 42% sold above list price. However, the market did cool in the 4th quarter with 51% selling below list price; 23% at list price and 26% selling above list price. (see Figure C)
- Through the end of the third quarter, FHFA.gov showed homes in Boulder County appreciating by over 10.56% during the previous four quarters. This ranked 14th nationally.
- The average premium paid in Boulder County for those homes that sold above list price was 4.7%.
The Future
So what does the future hold? It’s always a difficult question. In the short term it seems like the market is slowing a bit. Even in the slower months of December and January there doesn’t seem to be the sense of urgency we experienced over the past few years. However, we will most likely see a fast moving spring. Buyers will be rushing to beat additional interest rate hikes and contending with low inventory.
In the long run our area still seems poised for further growth and expansion. Google’s expanded new offices won’t open for a year but it’s clear that Boulder is already “on the radar”. Not only will Google fill its offices over the next few years with an additional 1,000 employees other related businesses will be attracted to the area. Only time will tell, but it seems like Boulder’s attractiveness is still on the rise. And with it, I see Boulder’s real estate market not only sustaining but thriving into the future.
[1] www.census.gov
[2] Leeds Business School’s “Colorado Business Economic Outlook 2017
[3] www.census.gov
[4] www.census.org
[5] Colorado State Demography Office
by Neil Kearney | Nov 10, 2016 | Boulder County Housing Trends, Statistics
October was a continuation of the the trends we have been seeing since July. Sales were down 12% for the month but last October was an especially strong month. Year-to-date sales are down 10% from a year ago and down 3.5% when compared to 10 months of sales in 2014. Inventory is still low but it has stabilized. Median prices have come off of their highs and during the month the average negotiation off of the list price was 1.17%. This after many months of the average sale being above the list price. It will be interesting to see how our market weathers the winter. During the past two winters inventory has remained low and sales remained strong. This has provided a hot start to both 2015 and 2016.
See the slideshow below for more details and comments.

by Neil Kearney | Nov 1, 2016 | Boulder County Housing Trends, Statistics
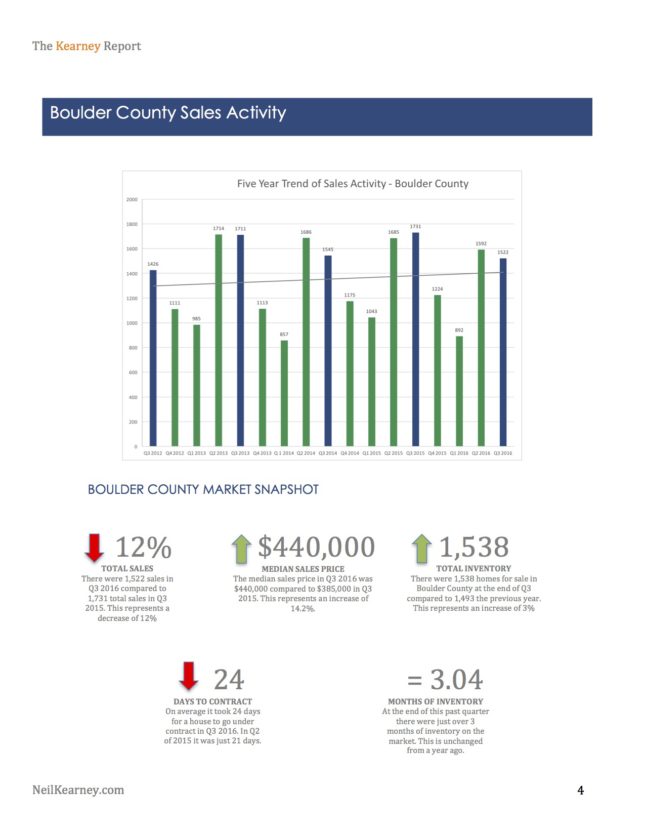
 I have just published The Kearney Report for the 3rd Quarter of 2016. I have streamlined the design and hope you are able to find the key information more easily. The entire report can be viewed below on this page or you can download the PDF link here The Kearney Report 3rd Quarter 2016
Real Estate Market Update
At the end of the second quarter the Boulder County real estate market was ranked #1 in the nation for annual home appreciation. It was a testament to the unrelenting demand, low inventory and the pent up frustrations of buyers who had finally realized that the price they needed to offer didn’t have anything to do with what the last home in the neighborhood sold for. Since June the market has slowed down. In the same way a car eventually needs to refuel and a horse needs to cool down, a market, real estate or otherwise can’t run at full speed forever.
Don’t get me wrong the market is still good, houses are still selling. In fact, in the 3rd quarter 42% of all sales sold for over the asking price (down from 50% in the 2nd quarter). The difference I have been seeing in the market over the last few months is this; inventory is slowly rising, houses are staying on the market longer, when a house does get multiple offers it’s more commonly two or three offers rather than a dozen, there are more price reductions happening, there have been fewer showings per listing. It is no longer a given that a house will sell. It’s back to reality, where a house must be priced correctly compared to the competition in regards to condition and location.
The total number of residential sales in Boulder County is down roughly 10% year-to-date. Third quarter sales were down 4% from the second quarter of this year and down 12% from Q3 of 2015. Interestingly, sales within the City of Boulder are down 24% from Q3 of last year. This steep decline within the City has been noted in six of the past seven quarters. In looking at the sales mix by price range for Boulder during the quarter, it seems that the sales declines in the lower price ranges are not necessarily translating into increases in the upper ranges.
Change in sales in the City of Boulder During the 3rd Quarter by Price Range
$0 – $250,000 Down 82%
$250,000 to $500,000 Down 25%
$500,000 to $750,000 Down 16%
$750,000 to $1 Million Up 5%
Over $1 Million Up 5%
Total Sales Down 12%
Another sign that the market has cooled a bit is the fact that prices decreased 5% from the second quarter. This doesn’t necessarily mean that the market has shifted (prices are still up 14% above where they were a year ago) it just means that the homes that sold during the most recent quarter didn’t follow the torrid pace of the second quarter. Most likely when the FHFA.gov Home Price Index comes out for the third quarter we will no longer hold the top spot. But I predict that we will still be near the top since the results are cumulative.
Could this slight slow down in the market be just a downshift, a pause before even more people to move to Boulder and its surrounding area? Absolutely, I don’t see anything out there that has fundamentally changed what is fueling our market. Vestros Real Real Estate Solutions, a company who provides real estate risk analysis to the mortgage industry predicts that Boulder will have another 10.5% appreciation over the next year. Second nationally only to Denver.
Interest rates are still favorable, people are still moving to our area and Google’s new offices are still under construction. Speaking of Google, other areas in which they have set up a large office have seen a fundamental shift in the real estate market after they arrived. Many predict that Boulder will follow this trend. It seems that we already have a head start.
You may have noticed that there are not many for sale signs out there. The inventory of “for sale” homes in Boulder County at the end of the 3rd quarter is up 3% from a year ago but down 12% when compared to 2014. Fewer homes are coming on the market and those homes are selling quickly. Even though inventory has increased slightly, it’s still slim pickings for buyers.
Here is our advice for buyers and sellers in the current market.
Buyers – After two years of frustration this might be a good time to step into the market again. This time of year you typically have a bit more time to make a decision regarding a home purchase and you may just get lucky and find a diamond in the rough that has been overlooked by the market. On average, homes are still selling for just below asking price. In the 3rd quarter 21% of homes sold closed at the asking price; 42% sold for above asking price (on average a 4% premium was paid) and 37% sold for under the asking price (at an average of a 3.4% discount).
Sellers – Properties are still selling. This may be a good time to lock in the price gains over the past few years. Condition matters! You may have more competition so it’s important to have your home ready to go in order to maximize price. If you are planning to sell in the winter let me know so that I can come out now to take some exterior photos before the snow flies.
by Neil Kearney | Oct 11, 2016 | Boulder County Housing Trends, Statistics
The Boulder County real estate statistics for September show that we are continuing a mini trend that we have seen since May. A general cooling of what had previously been an overheated market. We are seeing properties stay on the market longer, fewer sell for over list price (see more on this below), more price reductions (steadily increasing since May), and fewer sales (down 10% from 2015 and down 3% from 2014).
Sold for Under List Price
Avg Premium Paid for Sales Above List
Sold for Under List Price
Avg Premium Paid for Sales Above List
Sold for Under List Price
Avg Premium Paid for Sales Above List
During the third quarter 37% of sales sold for less than list price, 21% sold at list price and 42% sold for above list price. The graphics above give you an idea of how hot the market was in the second quarter (middle column in red). The third quarter and the first quarter were very similar.
The market has slowed but nice properties in good shape are still getting multiple offers. Last week a buyer of mine was one of seven offers on a house in Boulder listed for $800,000. Buyers are lingering, waiting for a good deal.
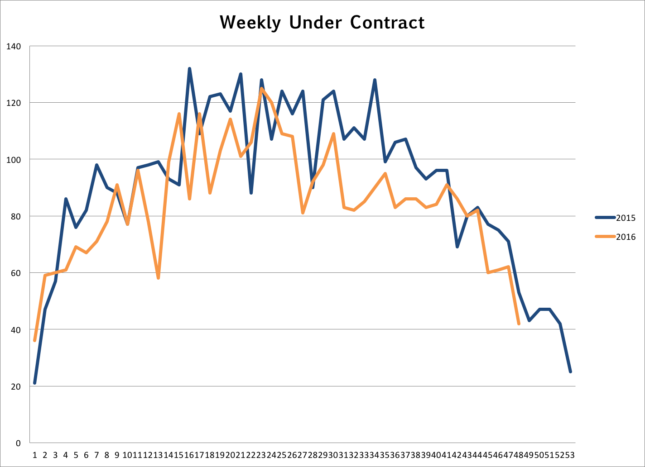
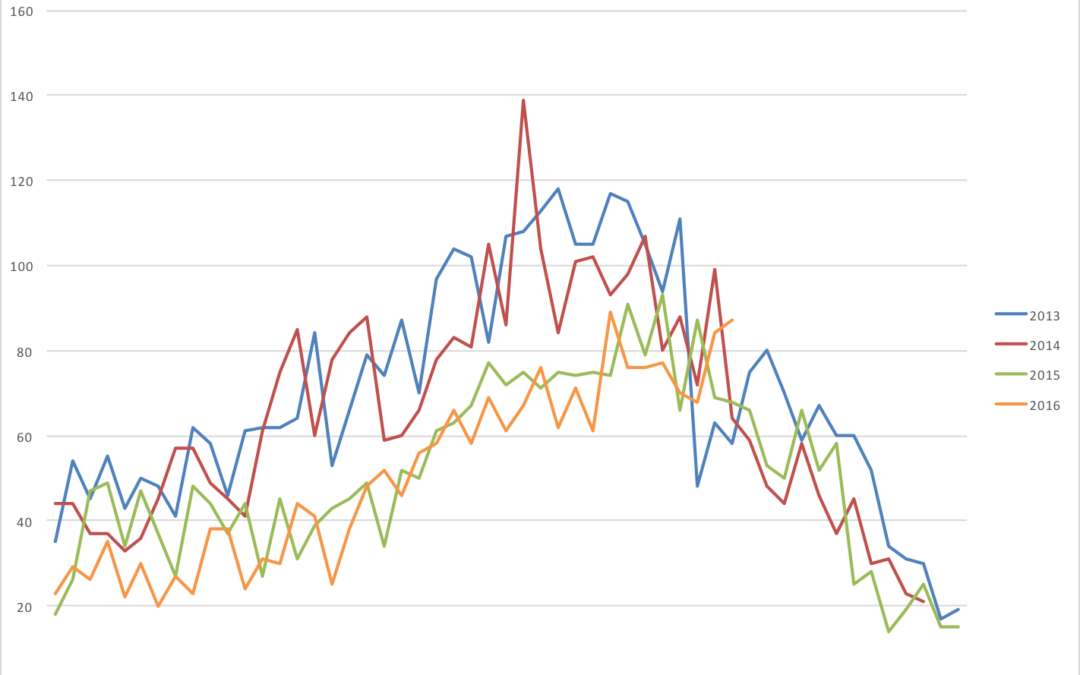
See the slideshow below for the current details about the Boulder County real estate market. There are slides on total sales, under contract trends, under contract % trends, price reductions compared over time, and median price.

 The sales mix in Longmont is completely different that Boulder. 91% of sales are $500,000 or below. 82% of sales are between $250,000 and $500,000 and over the last three years the entry level has shrunk from 45% to just 9%.


