by neil kearney | Feb 24, 2010 | General Real Estate Advice, Real Estate 101
From time to time it is good to gain some perspective on the environment around you. The real estate market is dependent upon many factors, one of the most important being interest rates. The affordability of a home depends upon two variables: price and interest rates. A 1% hike in rates can mean a big difference in what type of house you can afford. For example, a buyer borrowing $400,000 at 5% would make roughly the same payment as a buyer borrowing $357,000 at 6%.
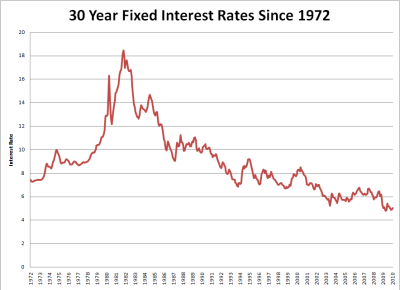
While the market hasn’t been great over the past two years, imagine if the rates were not within a whisker of the all-time record lows. These rates will not last forever. Now is the time to take advantage.
The chart below shows monthly 30 year fixed interest rates since January of 1972. Source of the raw data was Freddie Mac.

by neil kearney | Feb 23, 2010 | Boulder County Housing Trends, Statistics
Overview of the luxury condo market it downtown Boulder
During 2002 and 2003 One Boulder Plaza changed the landscape of downtown Boulder by inventing a new category in the local real estate market. That first successful project merged the Downtown Boulder location and luxury finishes. The result was a paradigm shift to what a buyer would pay for a square foot of residential living space. As sales mounted and a new buyers were attracted to the area other developers became encouraged and decided to continue the concept. Soon new projects were built and early on the local and national real estate market (as well as the financing) were robust enough to provide buyers for the newest and best projects. Competition has been tough with buyers preferring to choose their finishes and buy “new” rather than pay a similar price for a resale.
Since 2007 the combination of difficult credit conditions, an economic slump, stock market losses and out of state real estate losses have hit the local luxury market severely. Here is a graph showing all properties sold in Boulder County over $1,000,000 which were listed in the MLS since 1997.

As you can see the number of sales has dropped significantly since the peak year of 2007. However, sales in this category are not dead. During 2009, 78 condo properties sold in Boulder area above $500,000. Sixteen of those sales were over $1,000,000. The average price per square foot for properties in the downtown area under $900,000 was $503 and $697 for properties over $1,000,000.
I think going forward the strength of this market going forward depends upon outside forces such as; the strength of the housing market in general both locally and nationally, the ability of the luxury market to withstand a high inventory position while not losing too much value and the availability credit for buyers.
Market Data
Since January 1, 2009 there have been 16 sales of condo units in Boulder Colorado over $1,000,000. To view a detailed spreadsheet showing all of the sales, the price per square foot of each unit and the sold date, click here. I welcome you to delve into the details but here are the details. The sales ranged from $1,000,000 to $5,317,000 for Jared Polis’s custom built penthouse unit at the Walnut. The average price per finished square foot for the entire bunch was $697. This is about $100 higher than it would be if we threw out the sales over $2 million.
Currently, there are 25 condos listed in Boulder over $1 million. This number understates the true market a bit because there are some properties listed for sale that are not in the MLS. Most notablyThe Arete has just five properties listed for sale while I think the true number available is close to double that.
by neil kearney | Feb 19, 2010 | Uncategorized
The definition of ‘recovery’ from my handy dandy Dictionary.com Iphone app: “restoration or return to any former and better state or condition”. The results are in, and despite some starts and fits to what might be deemed improvement, we have not yet reached what might be deemed a recovery.
After posting gains in the number of sales during October, November and December, sales during January were again down, although ever so slightly. This means that the number of sales in January 2010 were at the lowest levels for any month that can be searched using IRES’s historical online data. Not quite the classical definition of recovery.
Statistics are by nature backward looking and sometimes the past is too negative for an optimistic person like me. So, before I move on, and talk about the present, I’d like to give an ever so brief report on the major trends in the local real estate market. Through January, sales continue to struggle and prices are trending downward (although slightly) for the first time in decades.
Now to what I am seeing happening right now in the market. Just after the New Year, buyers started breaking hibernation early and decided that looking at houses would be a good thing to do. Since January showings have been robust and starting late January buyers started making offers. Right now 15% of the 2,600 residential listings in Boulder County are under contract. 398 units, not too bad.
Last year we had a late start to our selling market. Not much happened during the first quarter. This year, because of the tax credit, the opposite is true. I expect the number of sales for the next few months to exceed 2009. We are off to a quick start, but the lingering question on my mind is how strong the market will be after April 30th. With the scheduled expiration of the tax credit possibly coinciding with the end of the Fed buying of mortgage back securities (see interest rates – rising); we will have a stern test as to the strength of our short lived recovery. I will keep you posted.
by neil kearney | Feb 16, 2010 | Colorado Lifestyle
Boulder chalked up another national honor yesterday when the Gallup polling company announced the results of its “Healthways Well-Being Index. According to their information:
The Gallup-Healthways Well-Being Index score measures for each city an average of six sub-indexes, which individually examine life evaluation, emotional health, work environment, physical health, healthy behaviors, and access to basic necessities. The overall composite score and each of the six sub-indexes’ scores are calculated on a scale from 0 to 100, where 100 represents fully realized well-being.
While it lists Boulder as the winner, the actual area is the Boulder Metropolitan Statistical Area which includes all of Boulder County. With a composite score of 72.5 Boulder out paced all areas regardless of size. The study was extensive and included a sample of 353,000 adults nationwide.
The overall result calls attention to what we already know. The quality of life in the Boulder area is outstanding and the people who live here tend to be happy, employed, healthy and relatively affluent.
Here are the definitions of the areas that were examined during the poll.
The Life Evaluation Index is based on the Cantril Self-Anchoring Striving Scale, which asks people to evaluate their present and future lives on a scale with steps numbered from 0 to 10, where 0 is the worst possible life and 10 is the best possible life. Those who rate today a “7” or higher and the future an “8” or higher are considered to be “thriving.” Those who rate today and the future a “4” or lower on the scale are considered to be “suffering.” The overall Life Evaluation Index score is calculated as the percentage of thriving Americans minus the percentage of struggling Americans.
The Emotional Health Index measures daily smiling or laughter, learning or doing something interesting, being treated with respect, enjoyment, happiness, worry, sadness, anger, stress, and diagnosis of depression.
The Work Environment Index measures job satisfaction, ability to use one’s strengths at work, supervisor’s treatment (more like a boss or a partner), and the formation of a trusting work environment.
The Physical Health Index is determined by sick days in the past month, disease burden, health problems that get in the way of normal activities, obesity, feeling well-rested, daily energy, daily colds, daily flu, and daily headaches.
The Healthy Behavior Index includes four items: smoking, eating healthy, weekly consumption of fruits and vegetables, and weekly exercise frequency.
The Basic Access Indexis determined by access to clean water, medicine, a safe place to exercise, and affordable fruits and vegetables; enough money for food, shelter, healthcare; having health insurance, having a doctor, having visited a dentist recently; satisfaction with the community, the community getting better as a place to live, and feeling safe walking alone at night.
Not only is this a feel good story for our citizens it gives companies very real data why they should bring their employees to our area. We have always had a large contingent of people who choose to live in Boulder because of the “outdoor” lifestyle or previous rankings in publications such as Outside Magazine and Money Magazine. What it turns into is a big self-fulfilling prophecy which attracts the people who perpetuate the lifestyle. Not a bad cycle to be in.
For a full list of the ranked cities in the poll, click here.
by neil kearney | Feb 11, 2010 | Boulder County Housing Trends, Statistics
The real estate market is off to a quick start this year. I see three major reasons why we are seeing increased activity. The first is the extended tax credit. The second is low interest rates. The next reason is less quantifiable but just as valid. I see the third cause of the improved market so far this winter as an overall improved confidence. Many people have been slogging along over the past 18 months, listening to bad news, cutting their spending and hoping it doesn’t affect them too much. Just like a farmer’s tentative first steps out of the cellar after the tornado, most people pick up a few sticks and are glad the tornado hit the next town. It’s time to start living again.
Showings are very strong and contracts are just starting to react. You will see that total sales in Boulder County were just about the same as they were last January. Not great, the feel going forward is totally different. Last January the phones were silent and people were in shock. This year contracts are up and we are ready for an early spring.
It feels like we have a lot of “mass” behind the early sales. Most of the early activity is still in the lower price ranges. However, there are currently 16 homes under contract which are listed above $1,000,000 in Boulder County. Let me know if you questions. But for now I need to get back to work.
The slideshow is best when viewed in “full screen”. Just hit the second button in on the top right corner.

