The latest round of quarterly real estate statistics for Boulder County are not as robust as we have grown accustomed to seeing. The superlatives describing growth upon growth have paused for a quarter or two. I liken it to an inevitable hangover after the post-pandemic all-night real estate party. When you compare year-over-year statistics, it’s hard to follow a big surge. Such is the case this quarter. The number of sales, median prices, time on the market and inventory all moved negatively when compared to the first quarter last year. In this report, I will concentrate on the overall trends rather than just comparing the numbers to last year. Here we go!
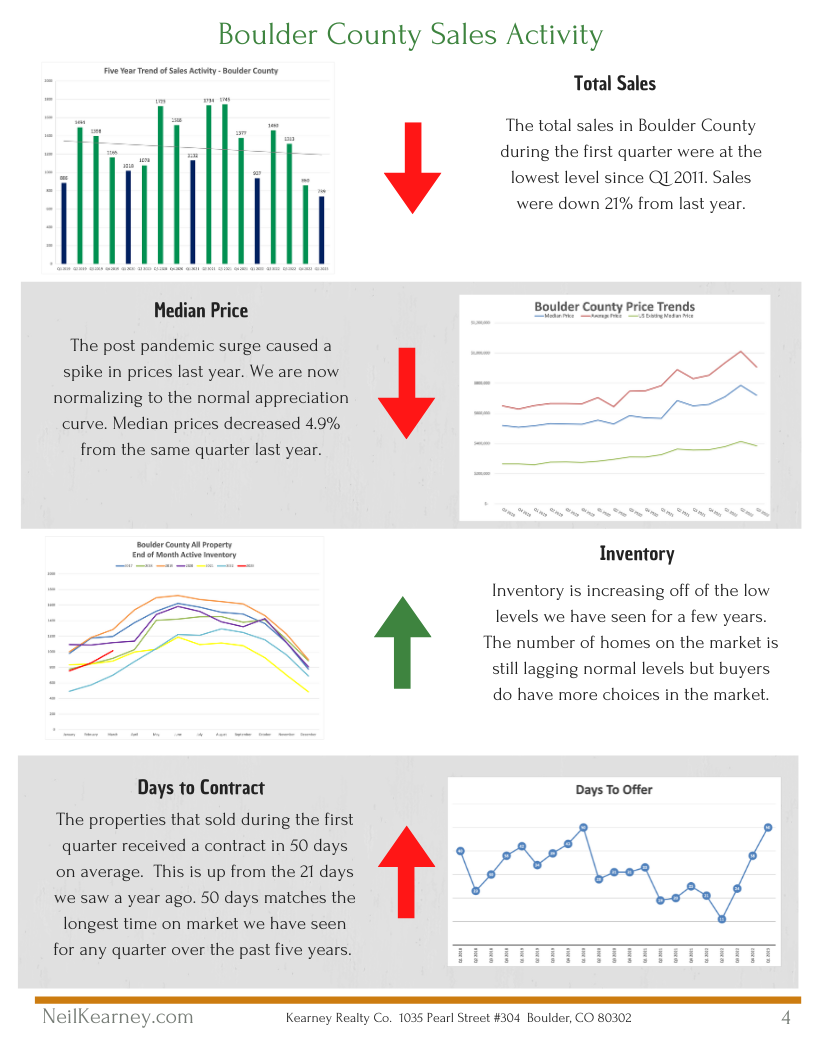
There were 739 real estate closings during the first quarter in Boulder County. This is 17% lower than the first quarter average over the past 15 years. The first quarter typically has the lowest number of sales than any quarter during the year, so we still have time to make up the gap by the end of the year. What has caused the lower sales? We have seen decreases on both the supply side and demand side. Supply side: You can’t take your mortgage with you! High interest rates have disincentivized sellers from paying off their current mortgages with low rates when they sell and then getting new mortgages with the current high rates with a new home. Lateral moves within a city just don’t make sense when a similar home will cost you tens of thousands more in payments each year. Demand side: There are fewer buyers because of the high rates (see previous reason) and it is especially difficult for first time homebuyers to make the math work.
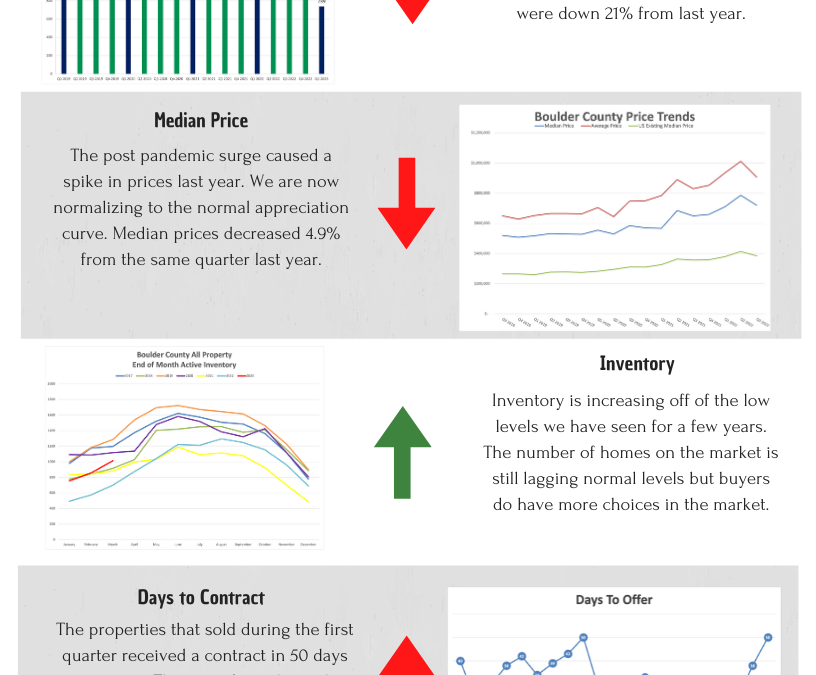
Median prices are down $35,000 or 4.9% from last year. However, when we take a longer view, we find that median prices in Boulder County are up 19% since 2021, 27% since 2020 and 78% since 2015! The idea that the sky is falling because prices are down when comparing one quarter (or one month) to another is not an accurate picture. Last year we saw a spike in the trend line, and this year we are returning to the historical trend. In my opinion, prices are holding up fairly well.
One of the main causes of the frenzied real estate party last spring was a lack of inventory. There was high demand from buyers trying to race rising interest rates and there were very few houses to view and buy. The typical buyer was rushing to compete on the new listings each week because those were the only choices. This year, inventory is rising and buyers have more opportunities in the market, but we are still not yet to the “normal” levels of active listings.As long as the inventory of homes stays in relative balance to the number of buyers actively looking in the price range, prices will have support. On average we are still in good shape on this front. However, on average, the higher the price the more inventory there is.
The natural result of fewer sales and higher inventory longer time on the market. On average, it took 50 days for a home to find a buyer this past quarter. This is 11 days longer than the six year average. We are also seeing more price reductions as properties sit longer on the market.
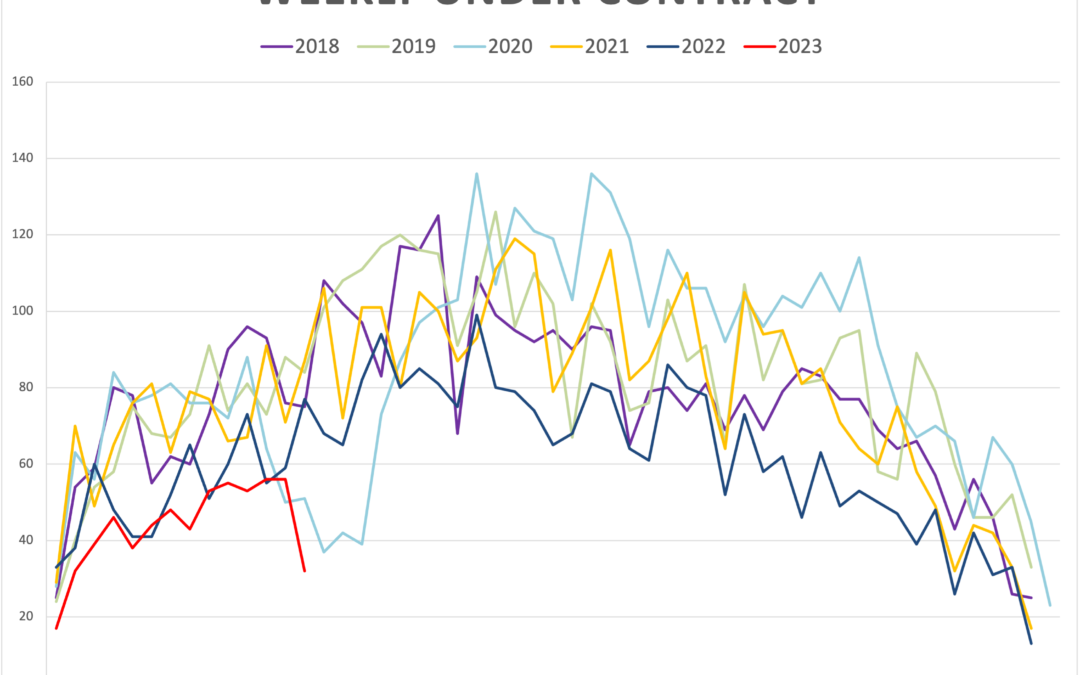
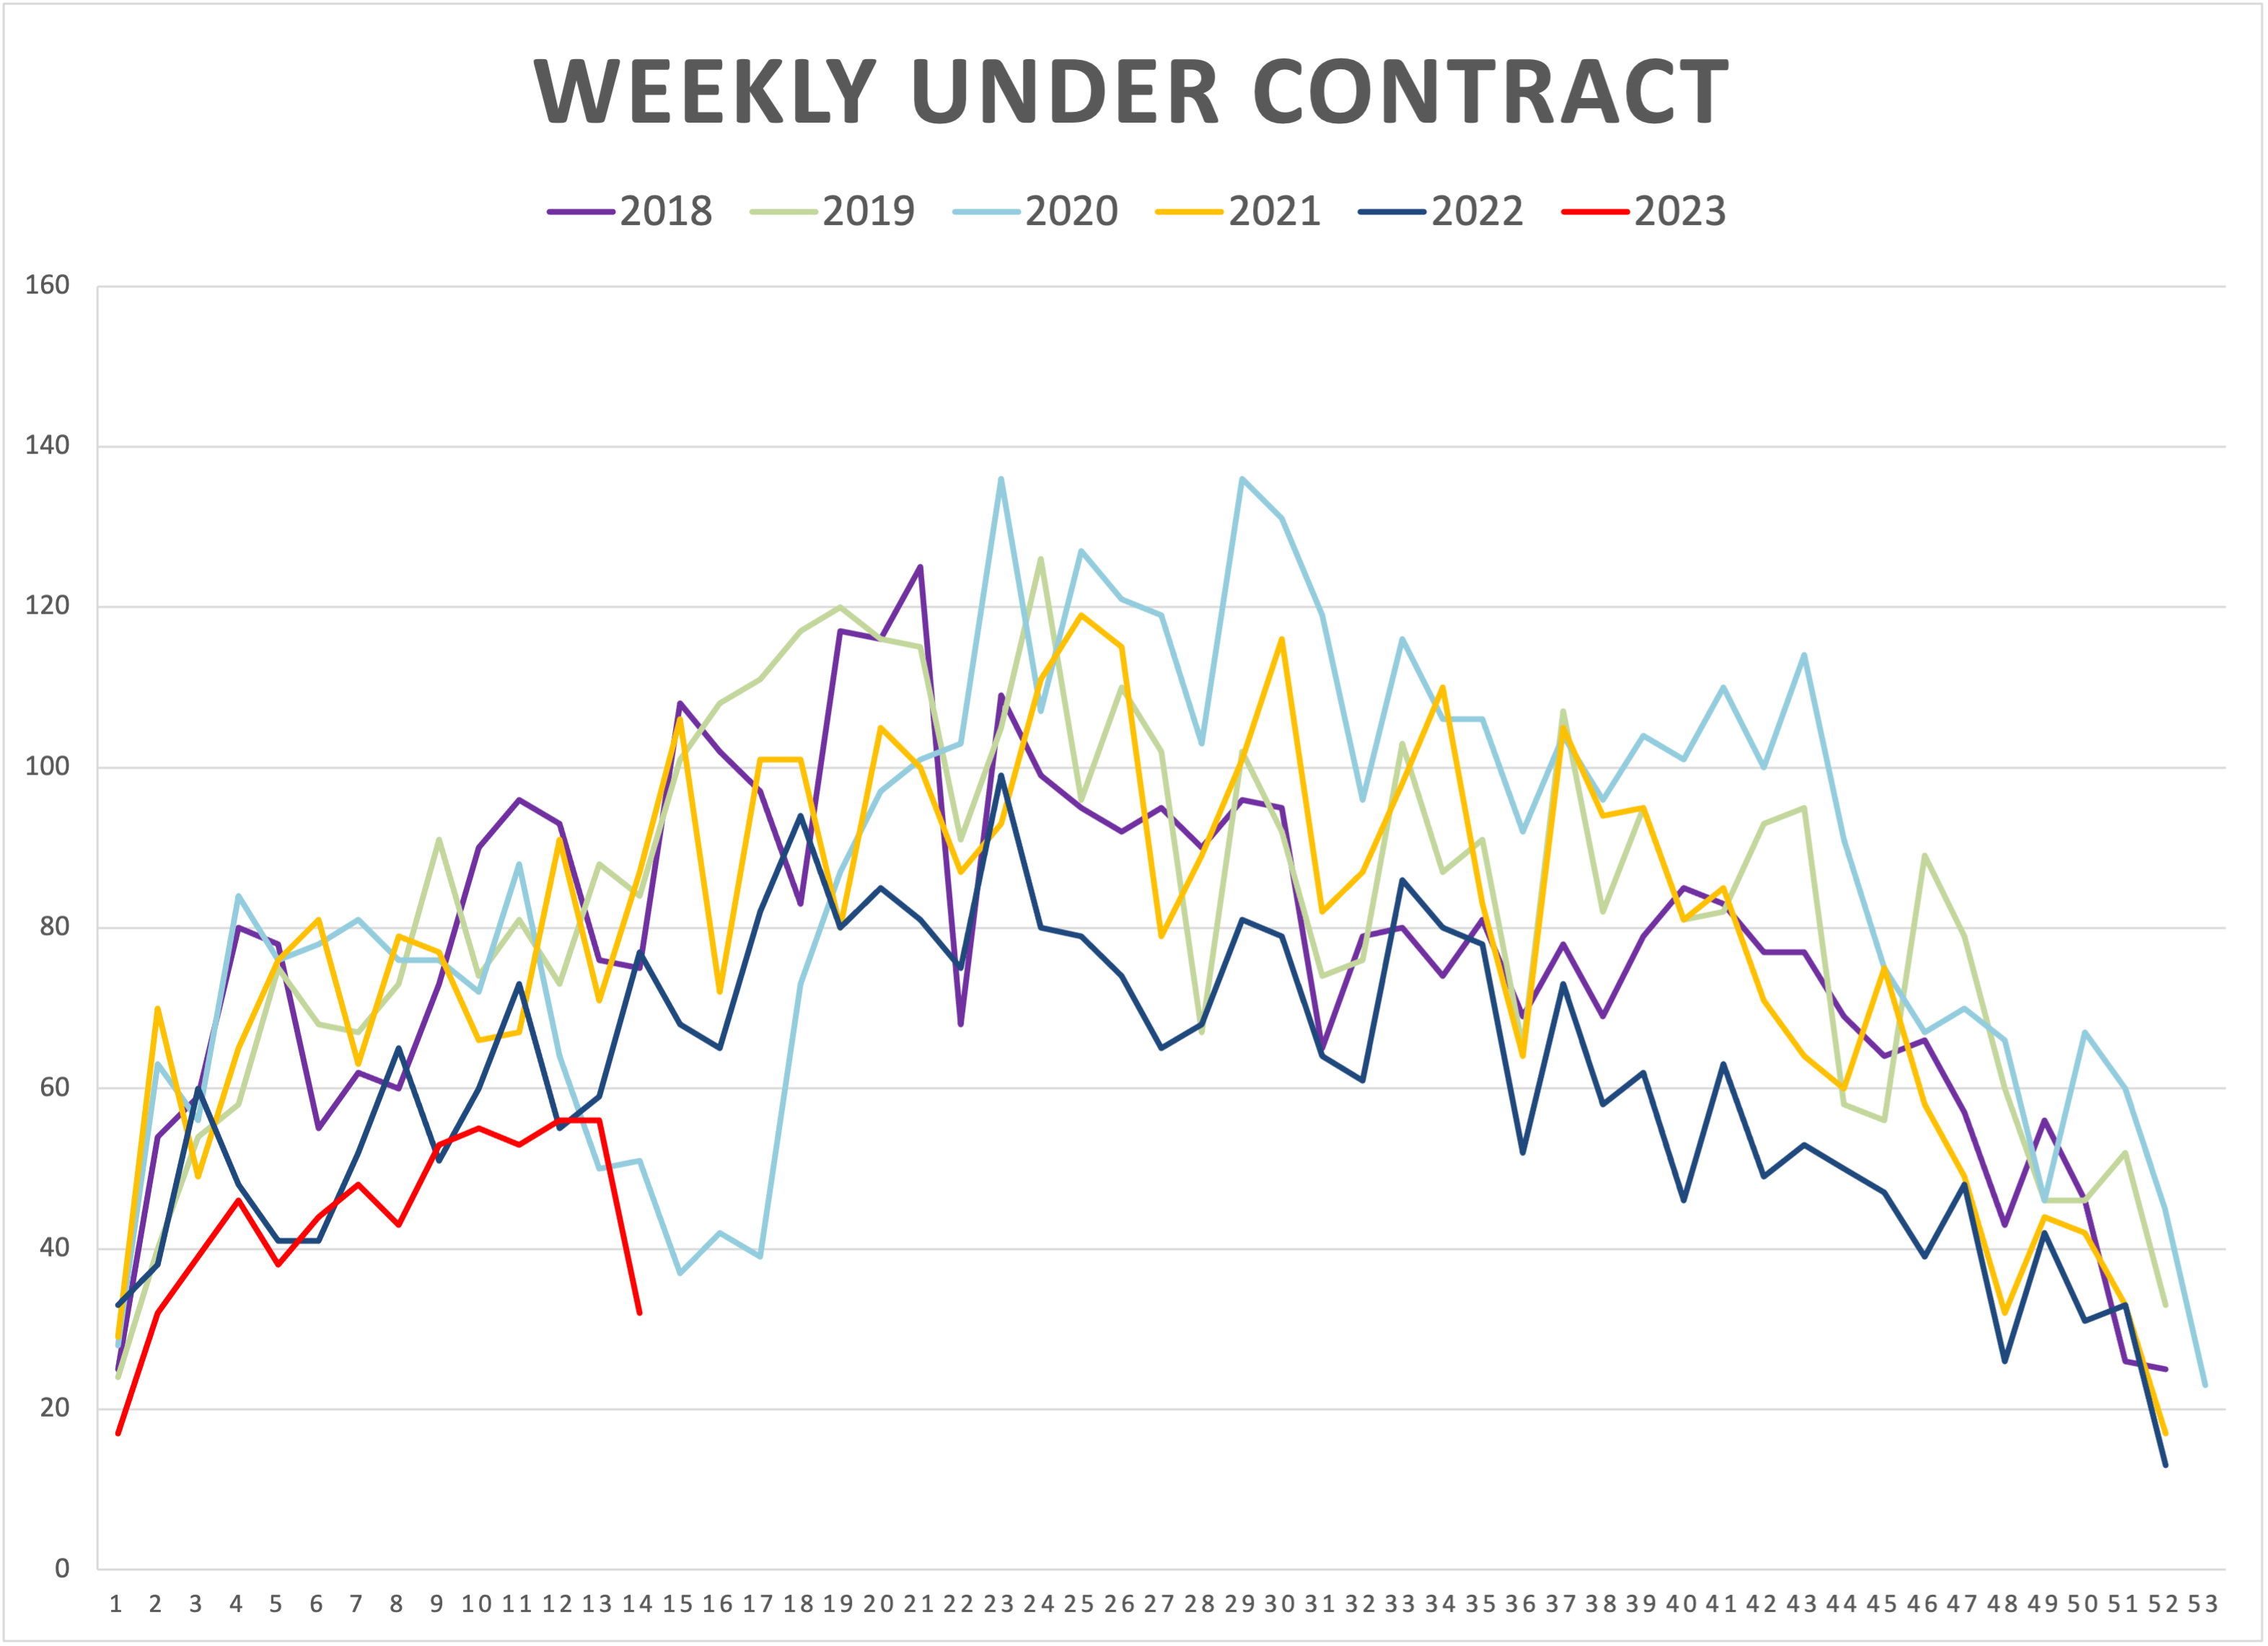
We are coming into the prime spring selling season and interest rates have dropped off of their fall highs. The forward looking statistics that I keep an eye on include the number of properties that go under contract on a weekly basis. We have been at or near the five year lows in this regard and we haven’t yet turned the corner in terms of buyer demand. But don’t be fooled by the headlines that suggest a big drop in prices. Those are most likely just comparing the most recent month to the same month the previous year. Keep an eye on the longer trend.I’m always here for you to be of service and would be honored if I’m your first call when you need real estate advice.I love your referrals.Enjoy the report and stay in touch!
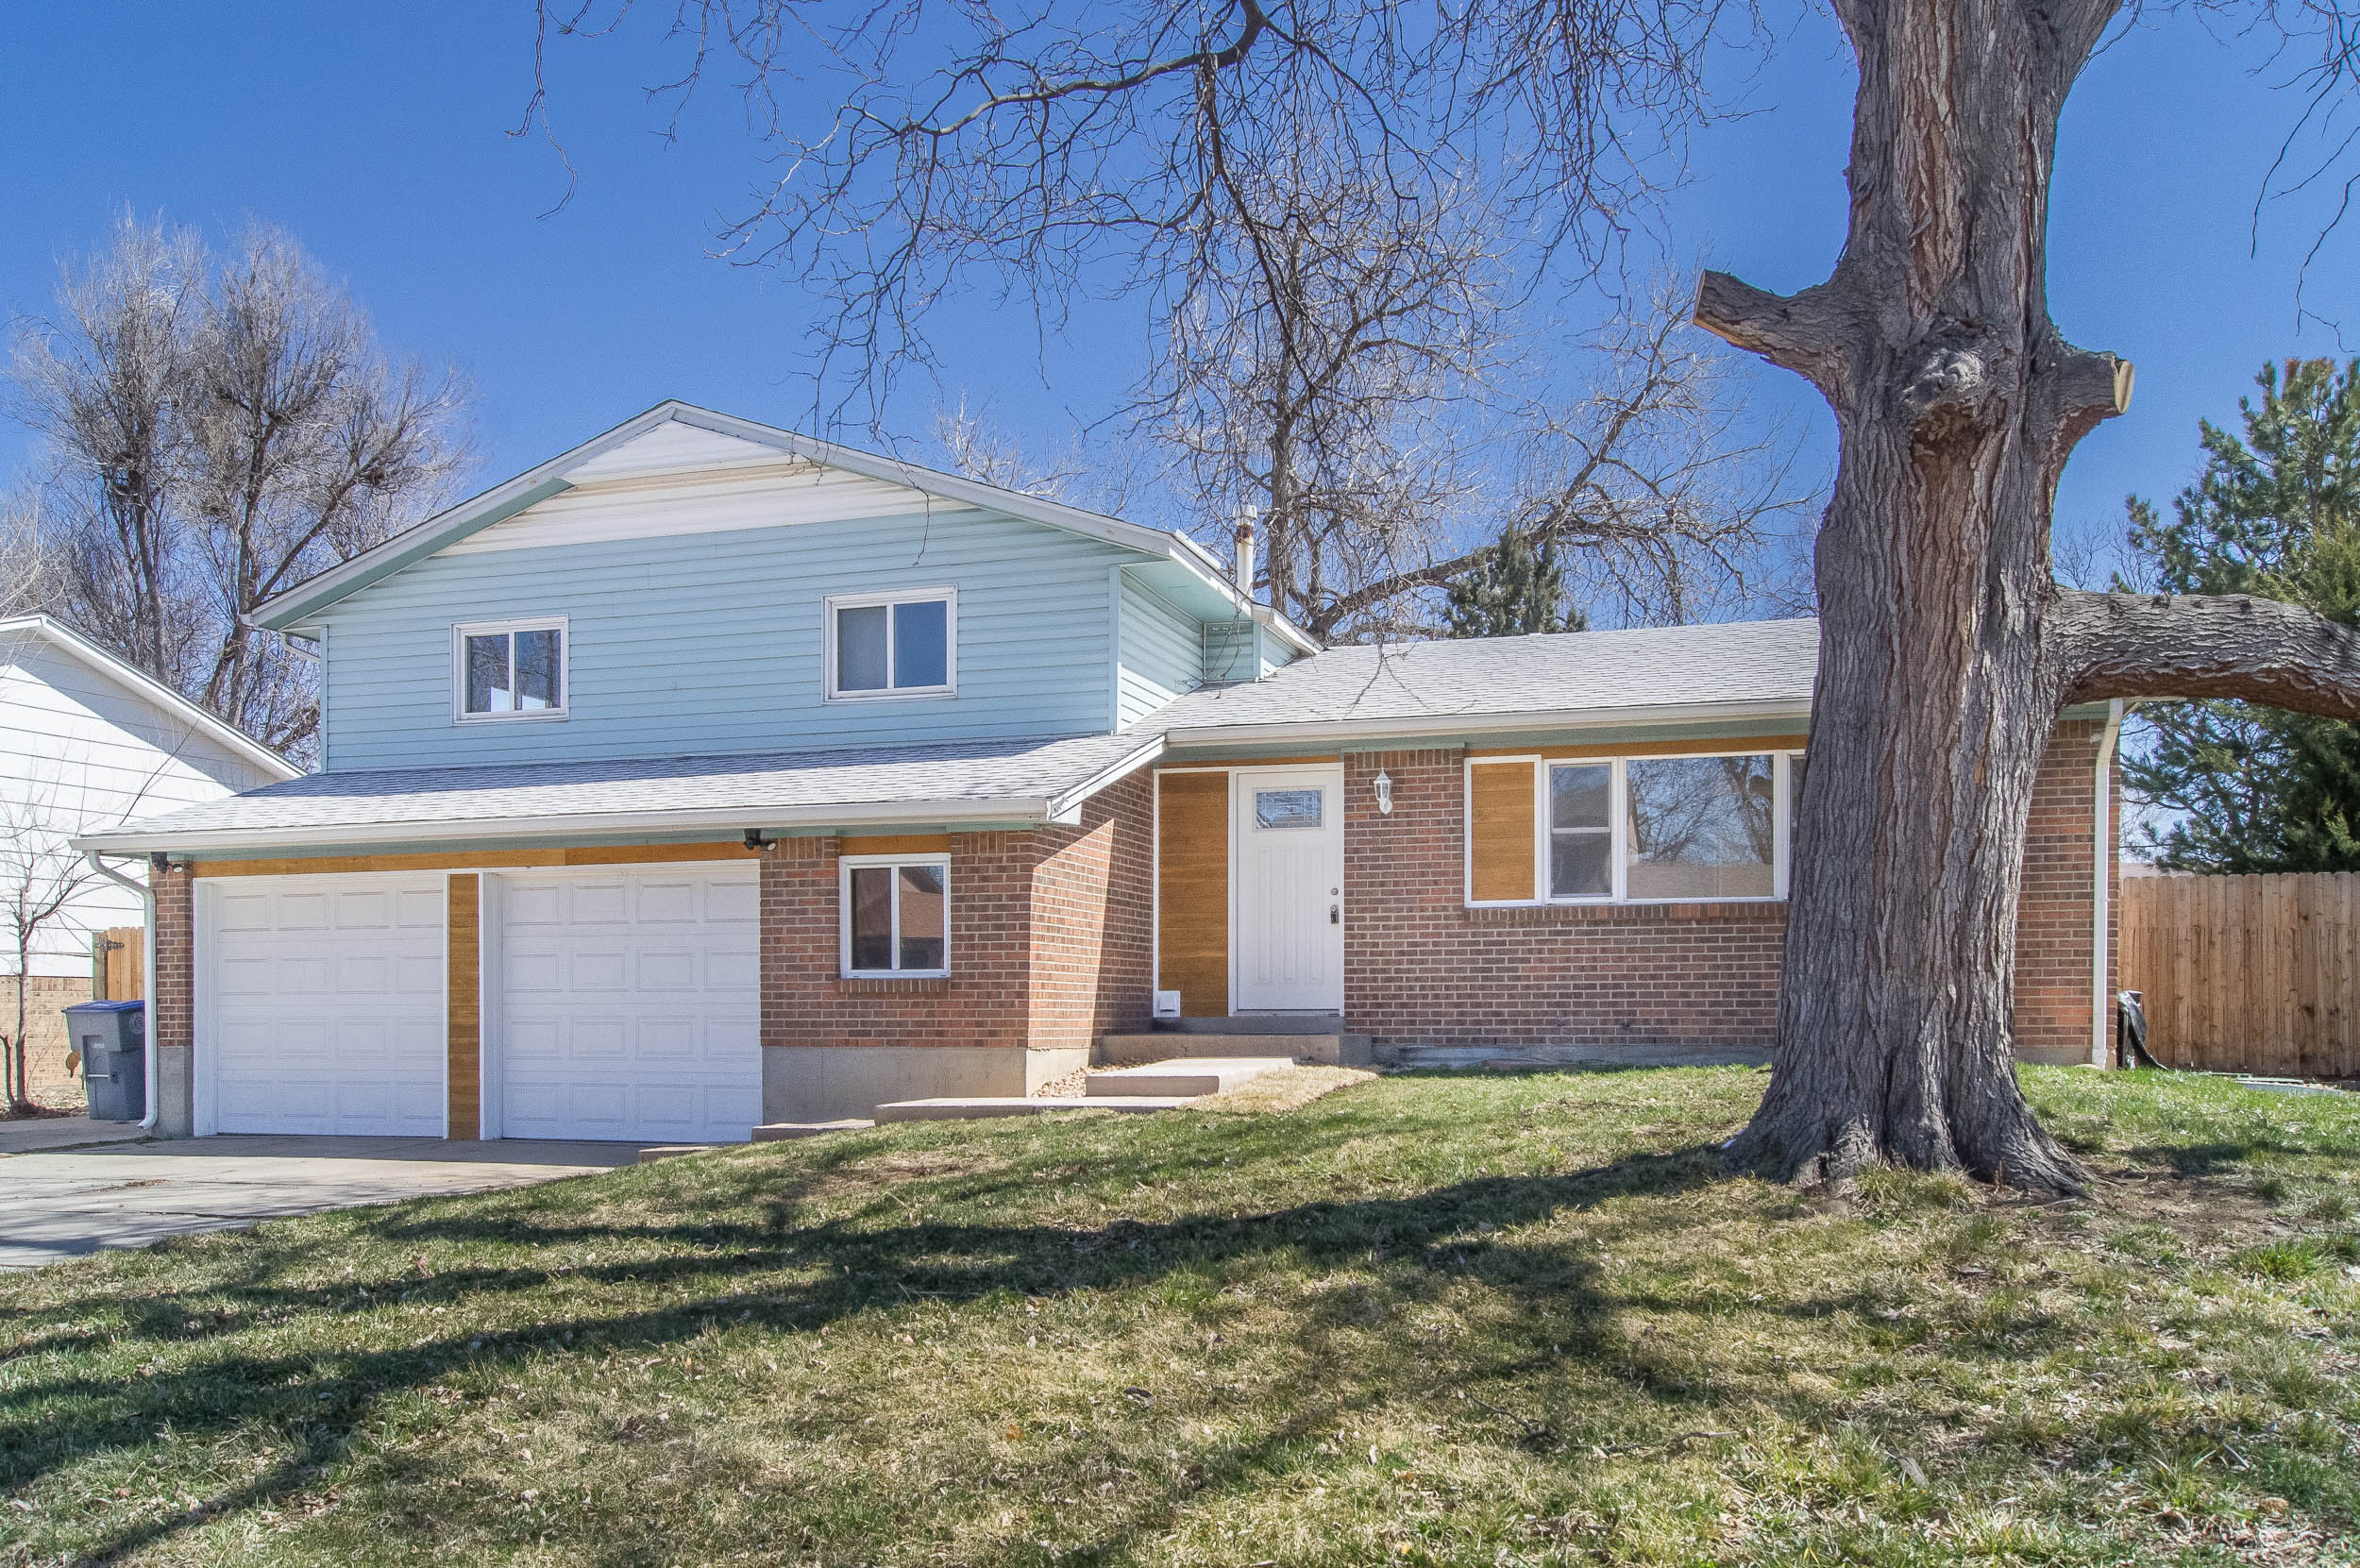
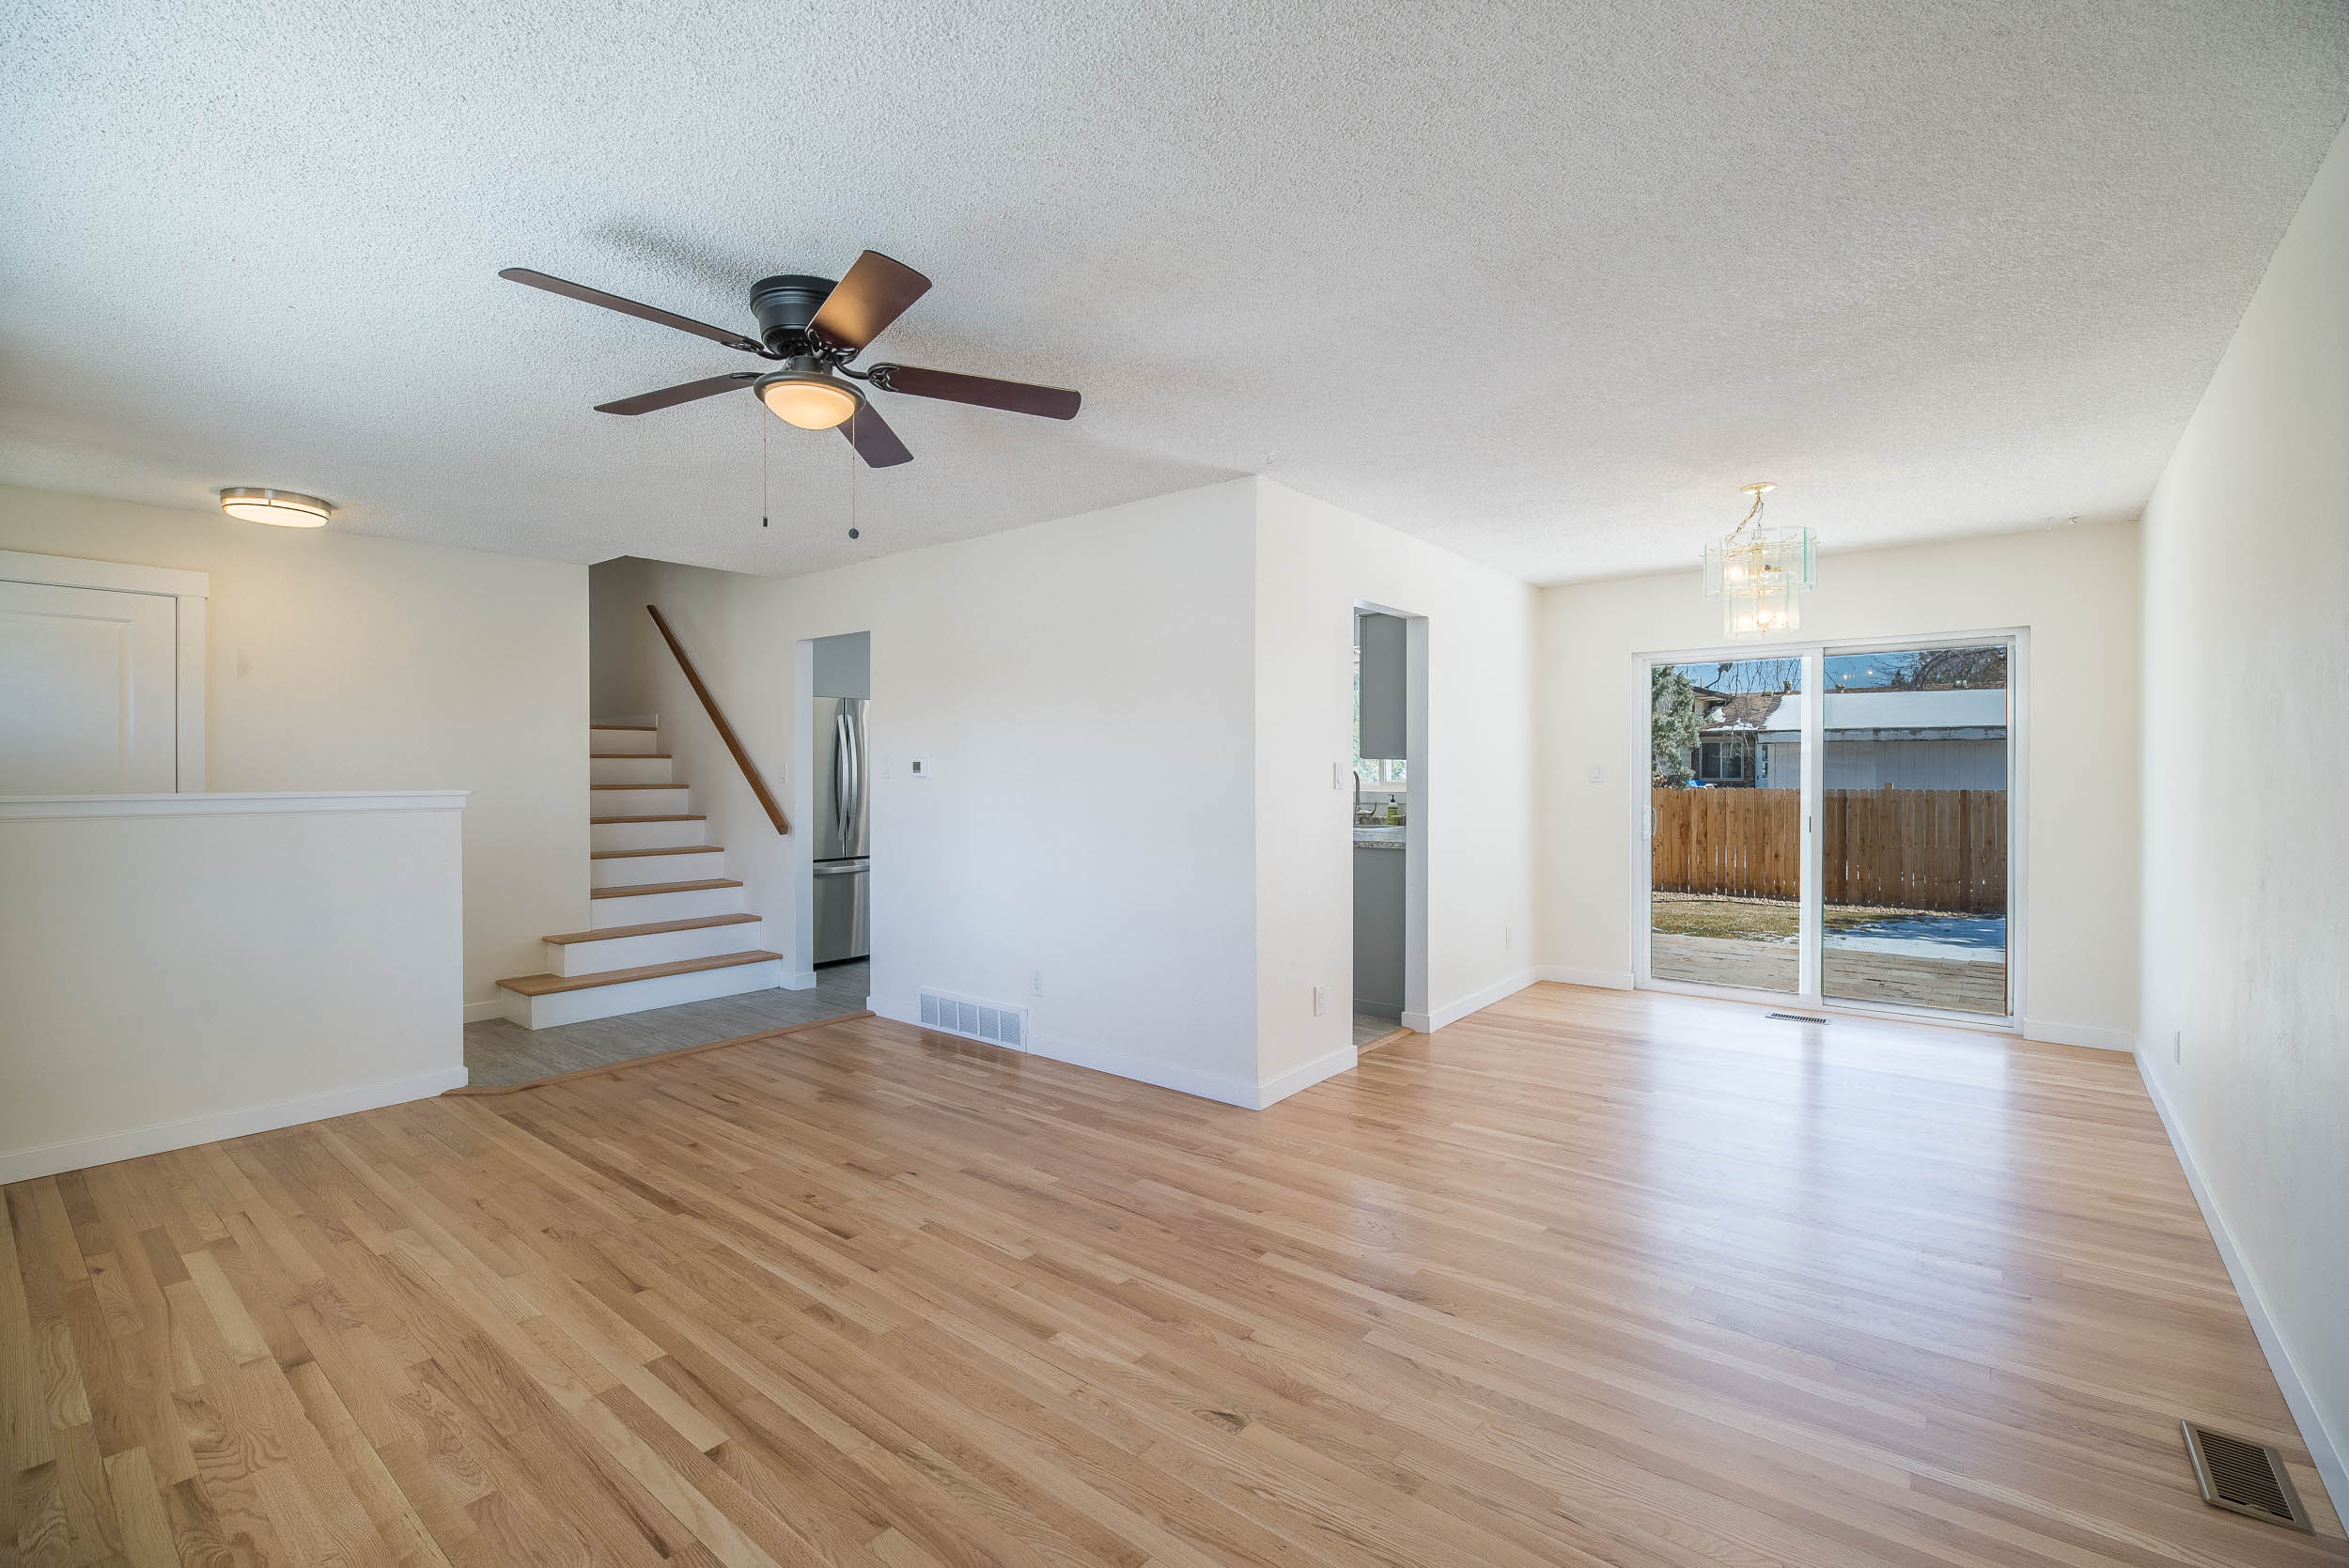
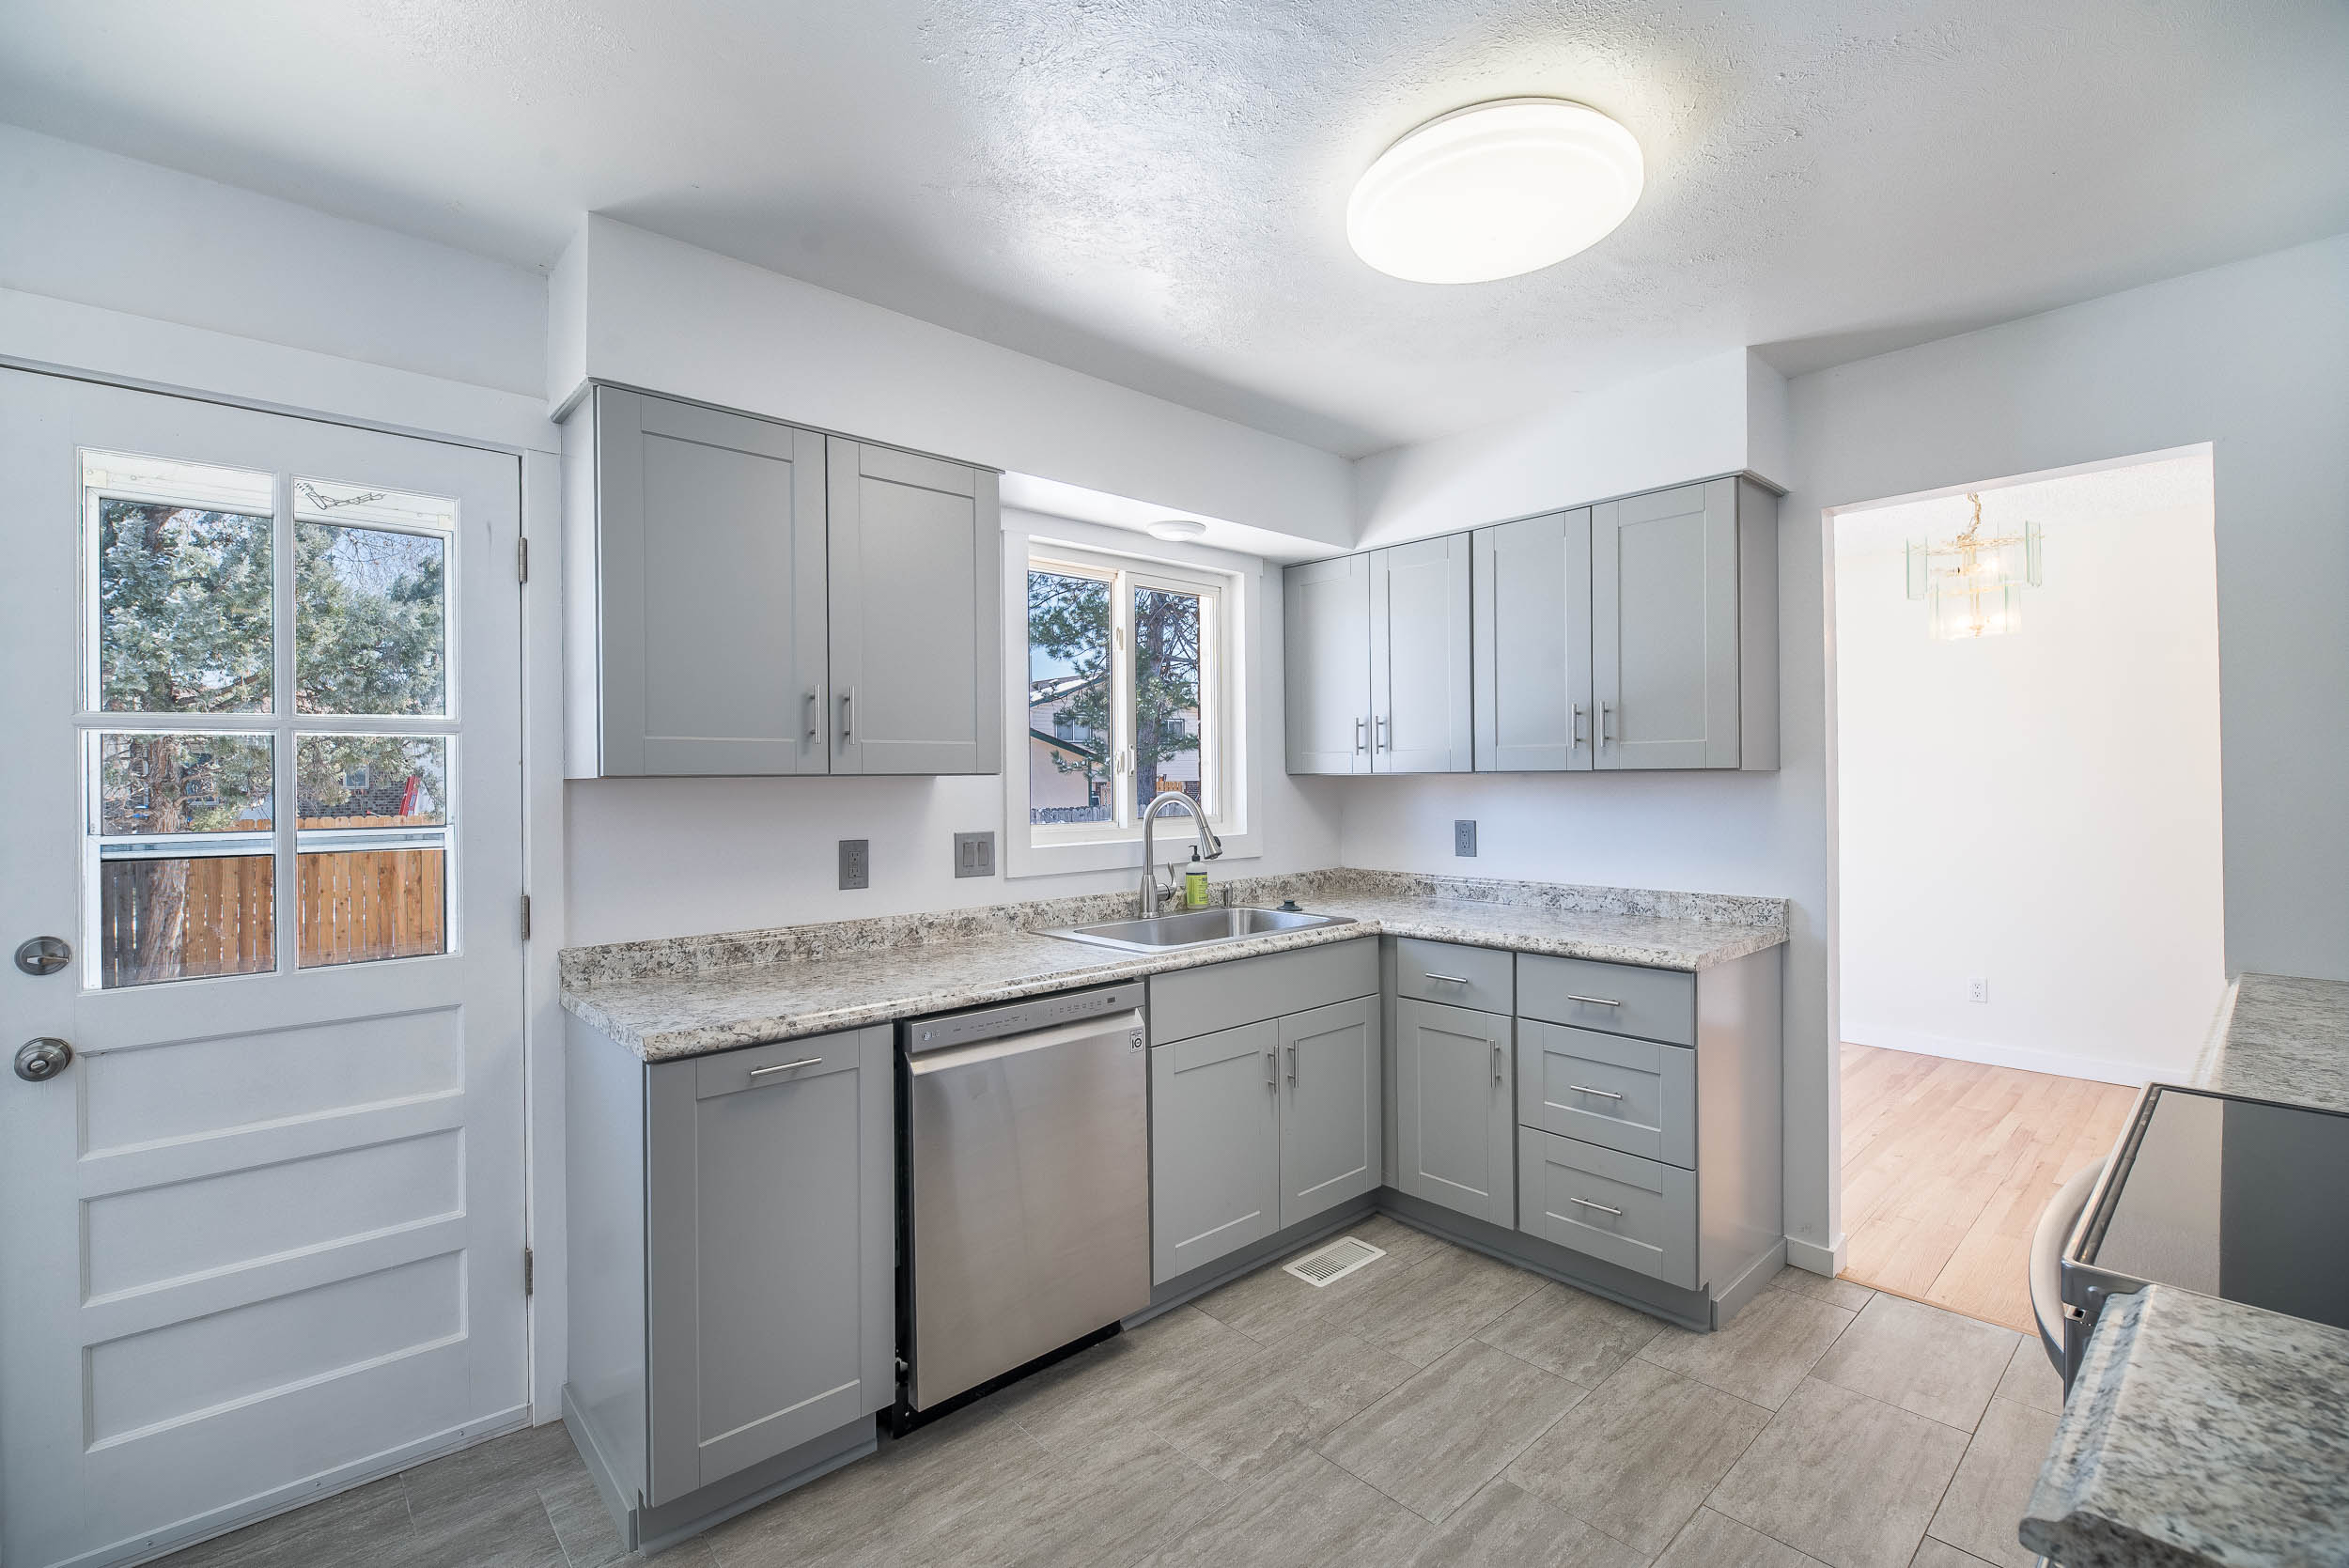
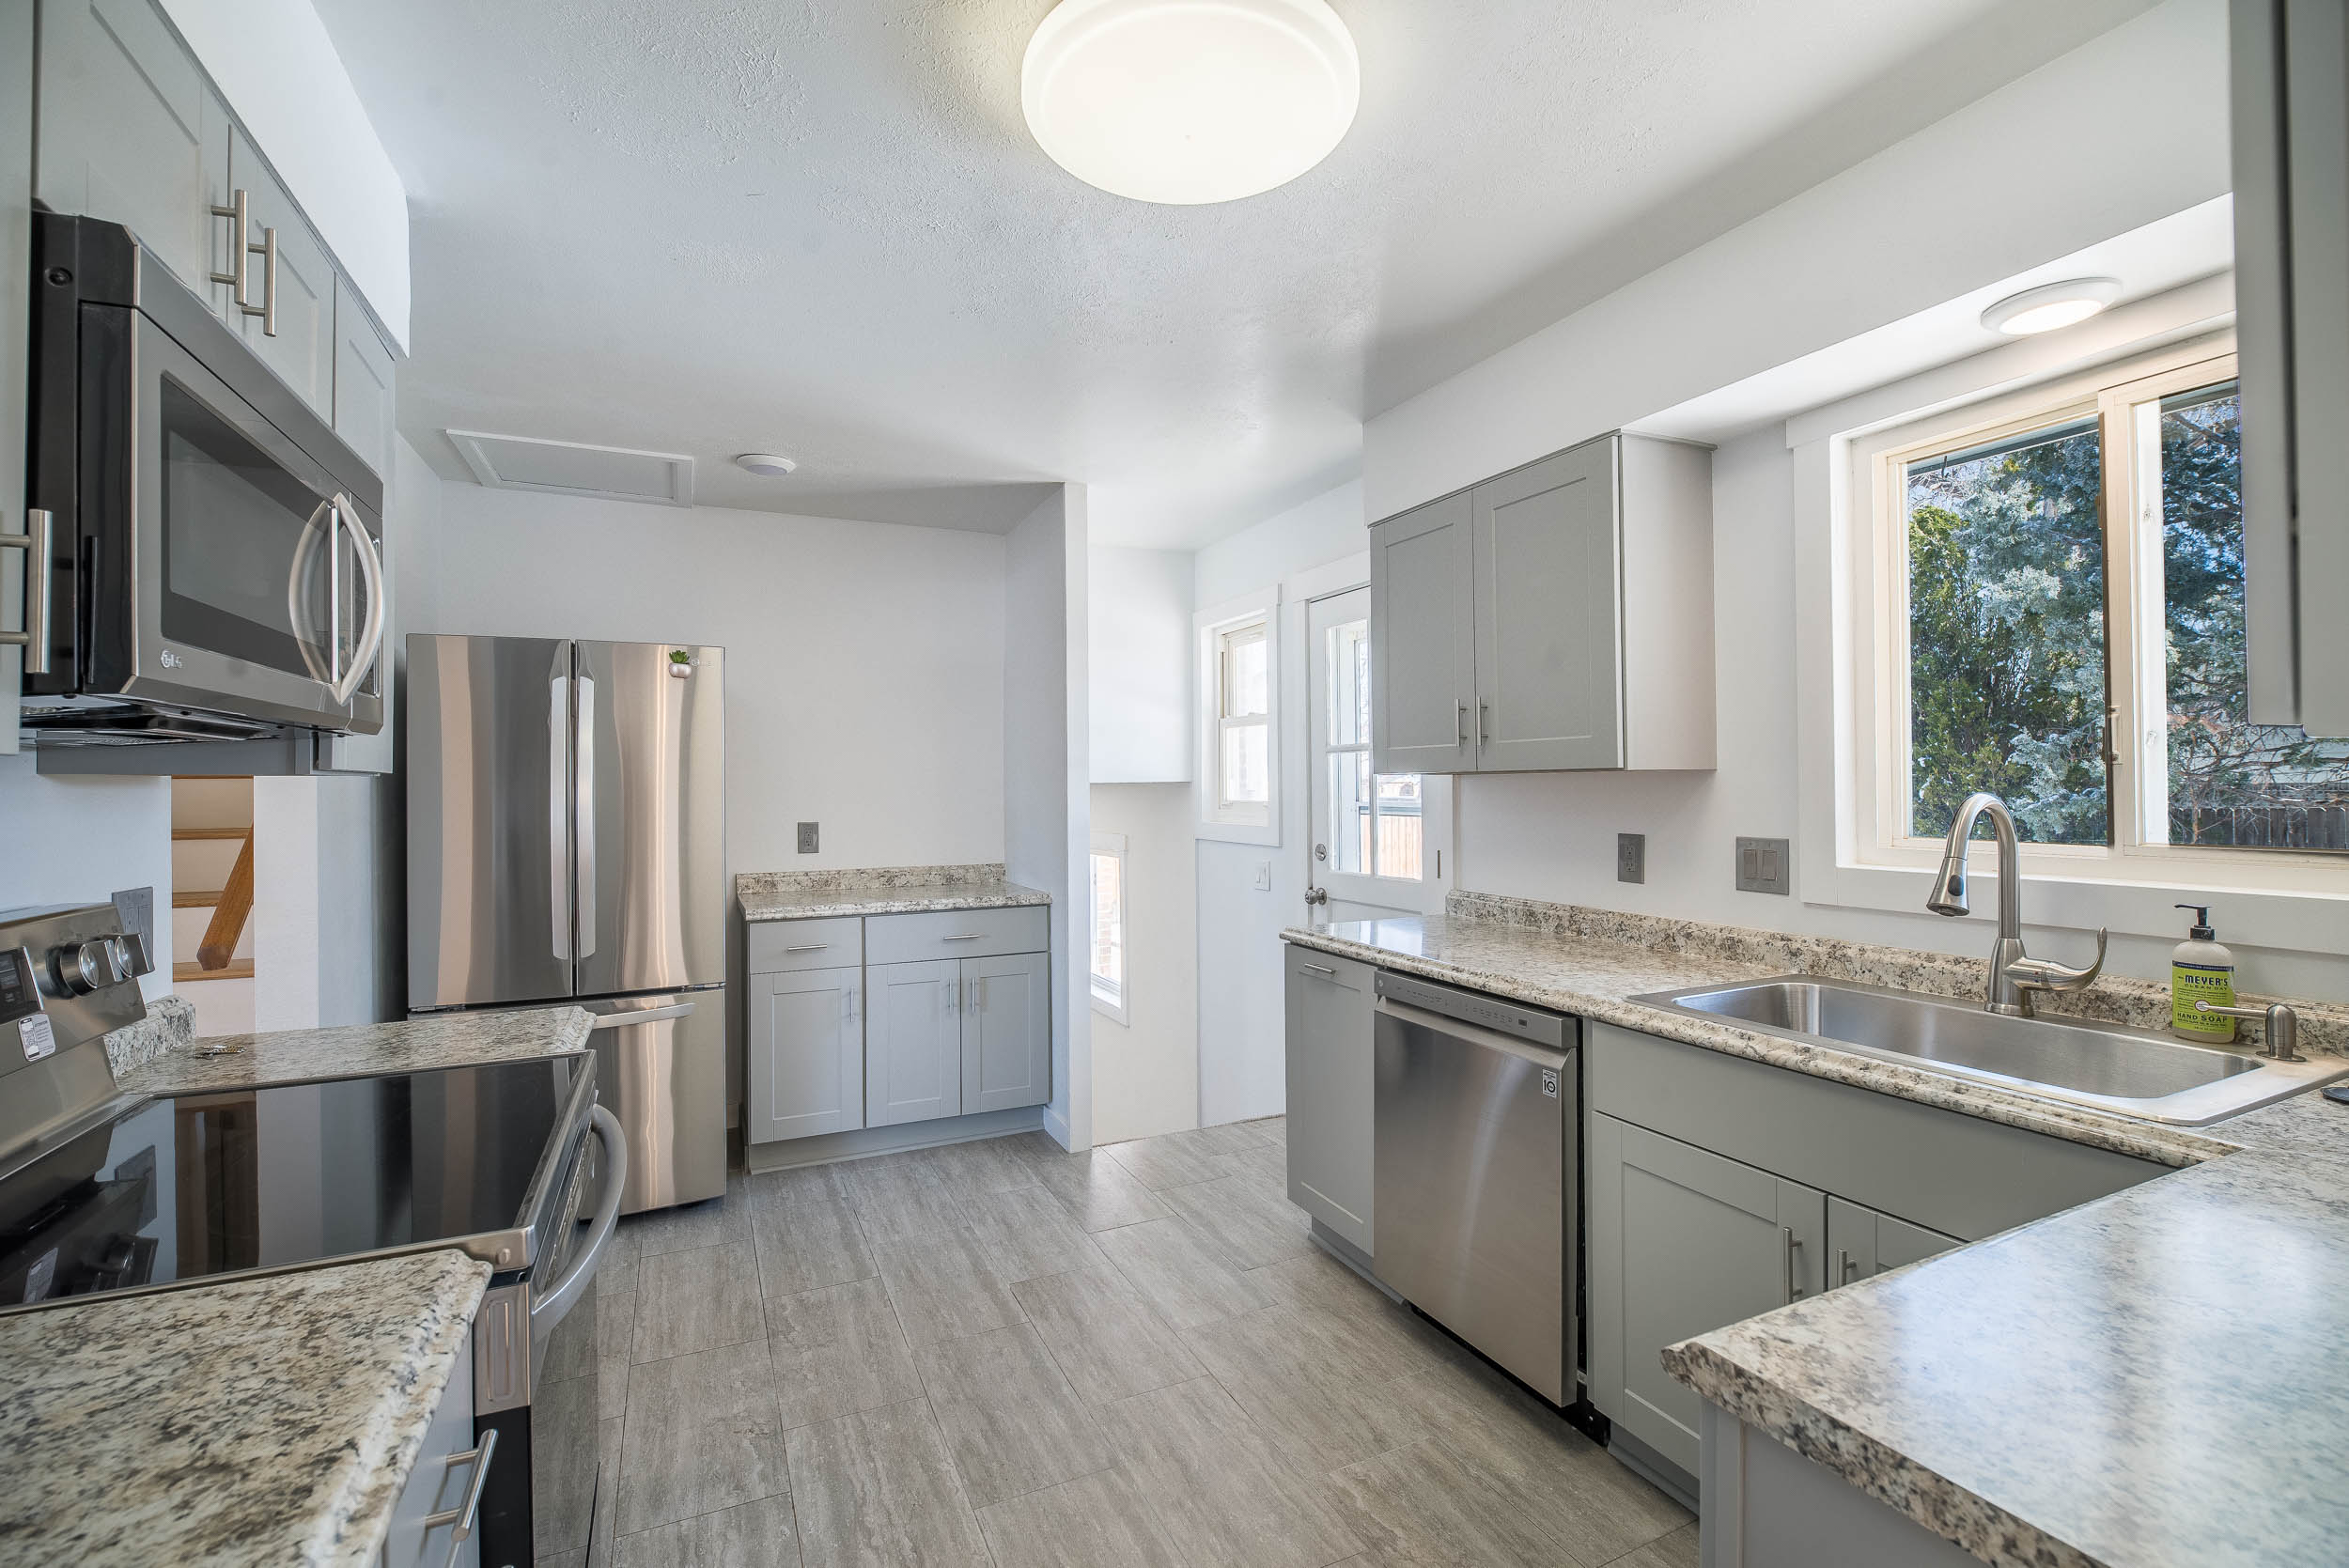
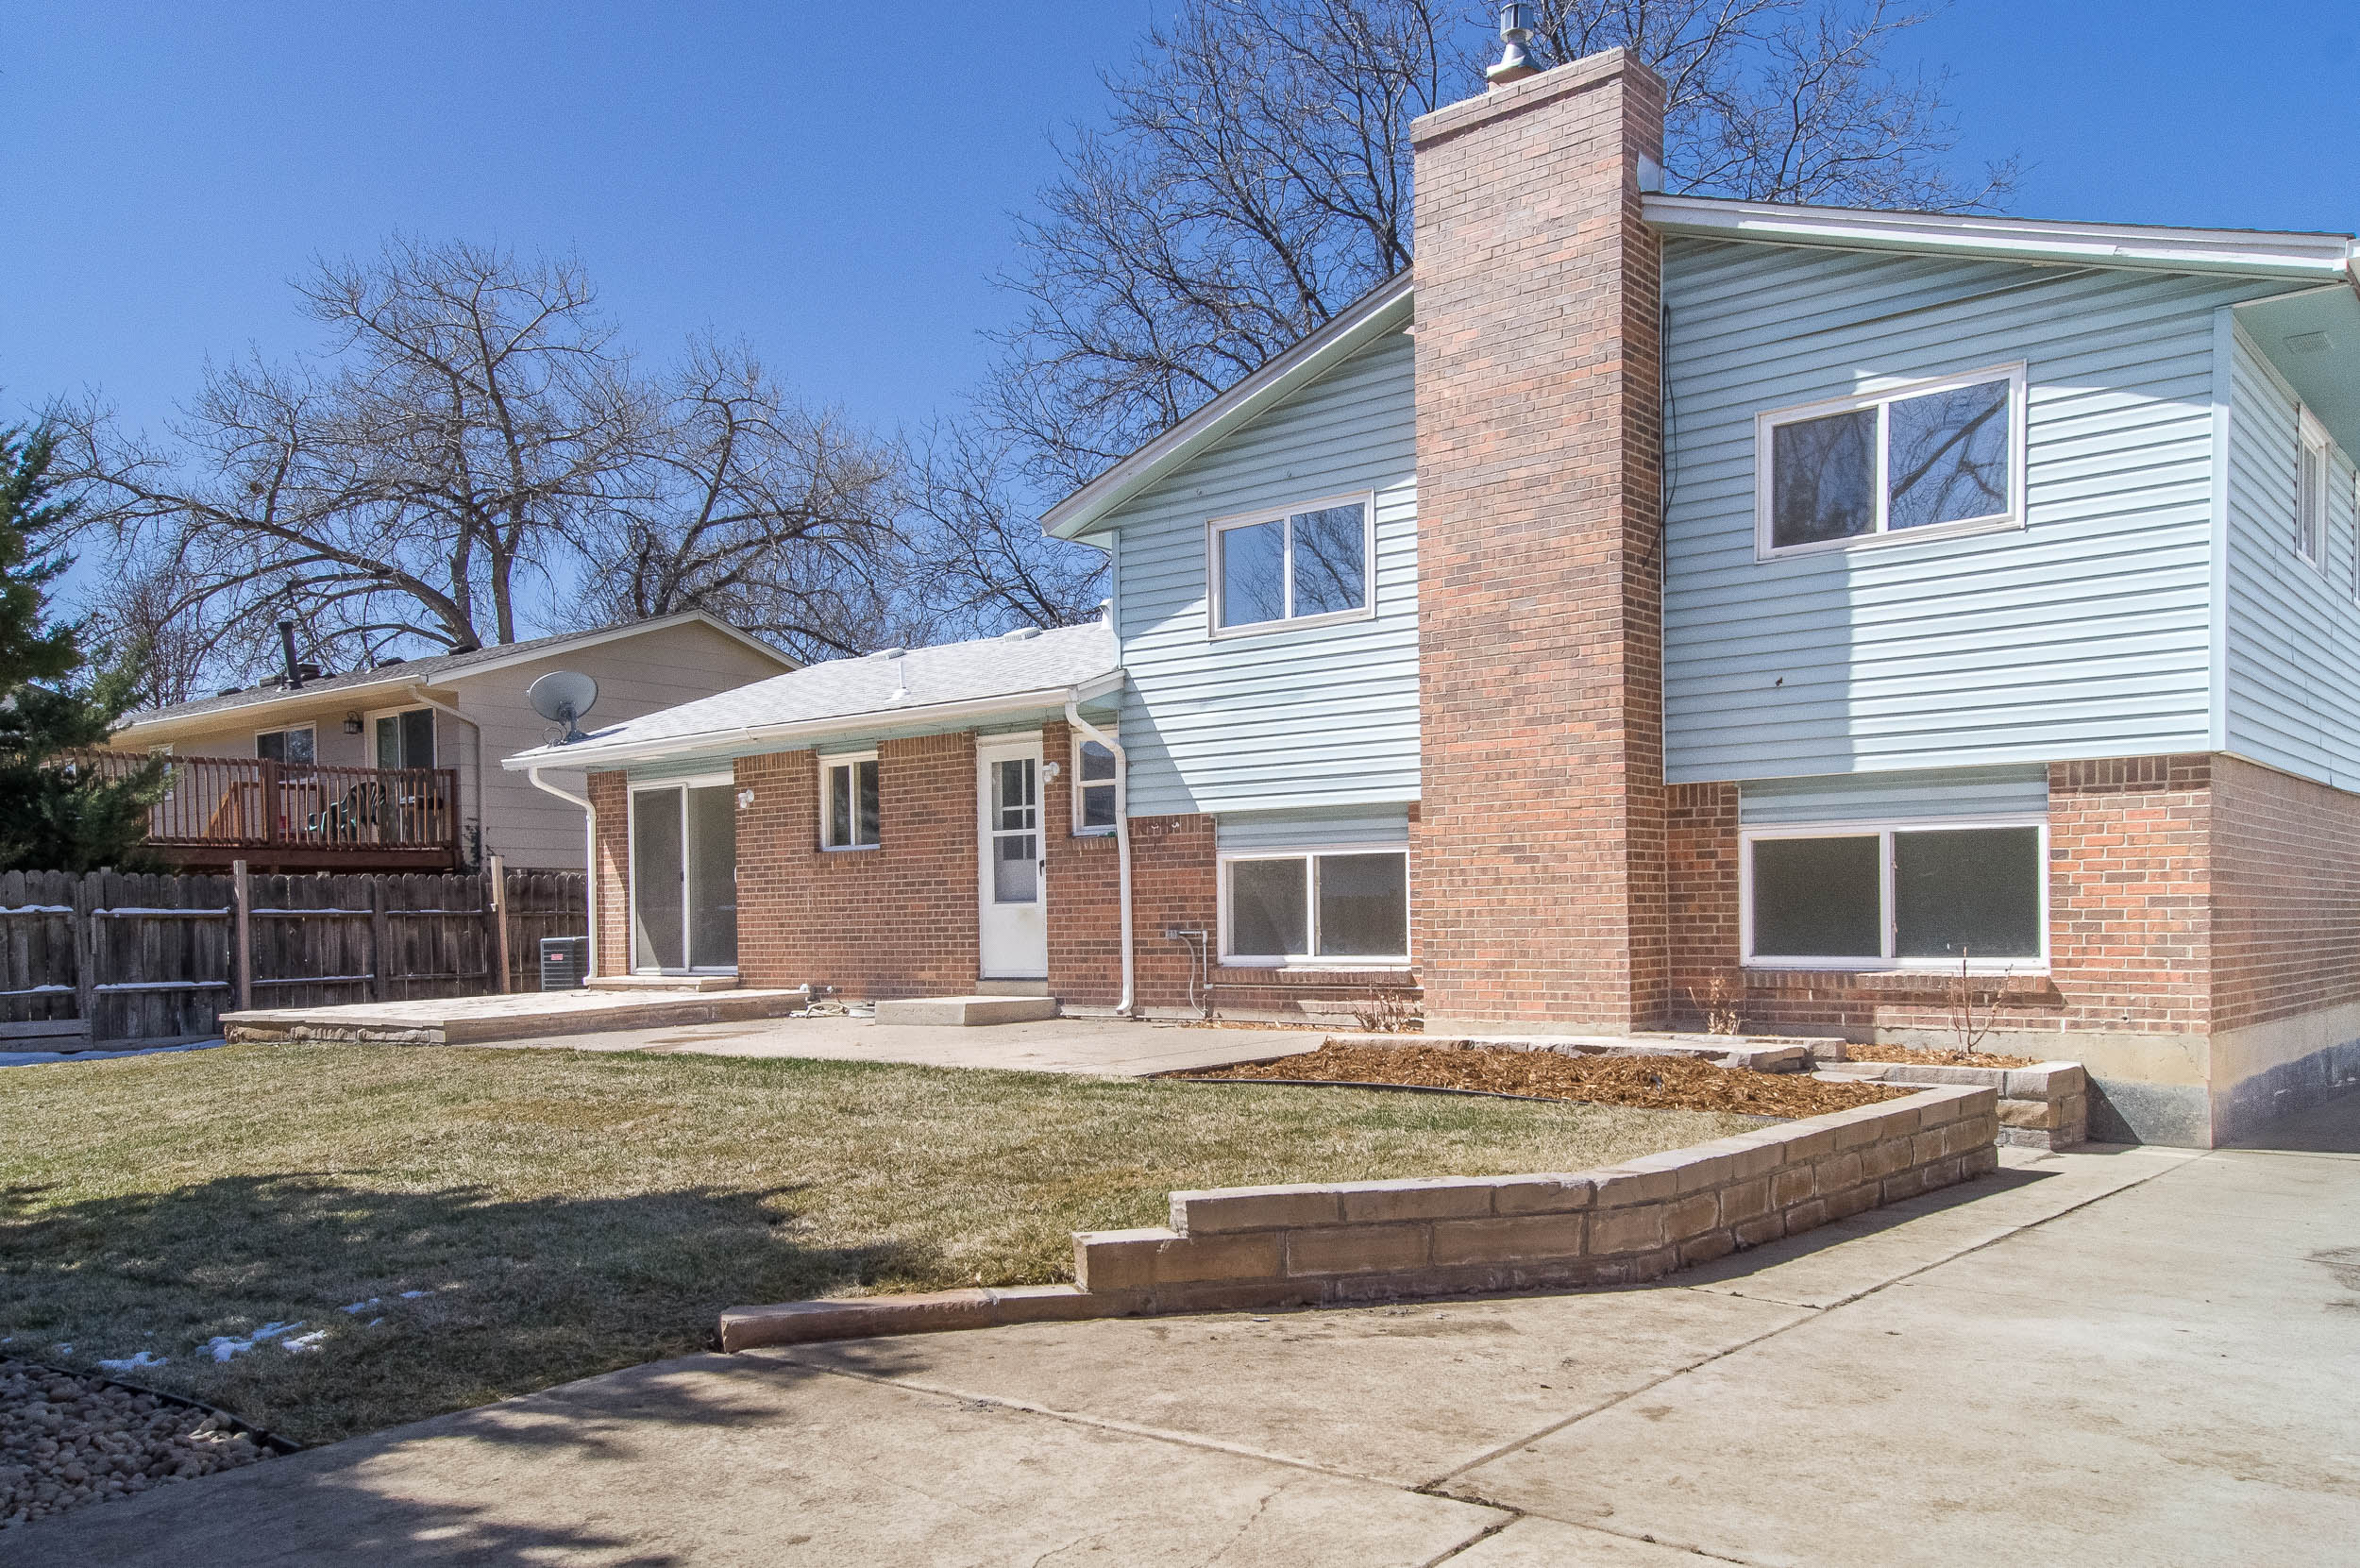
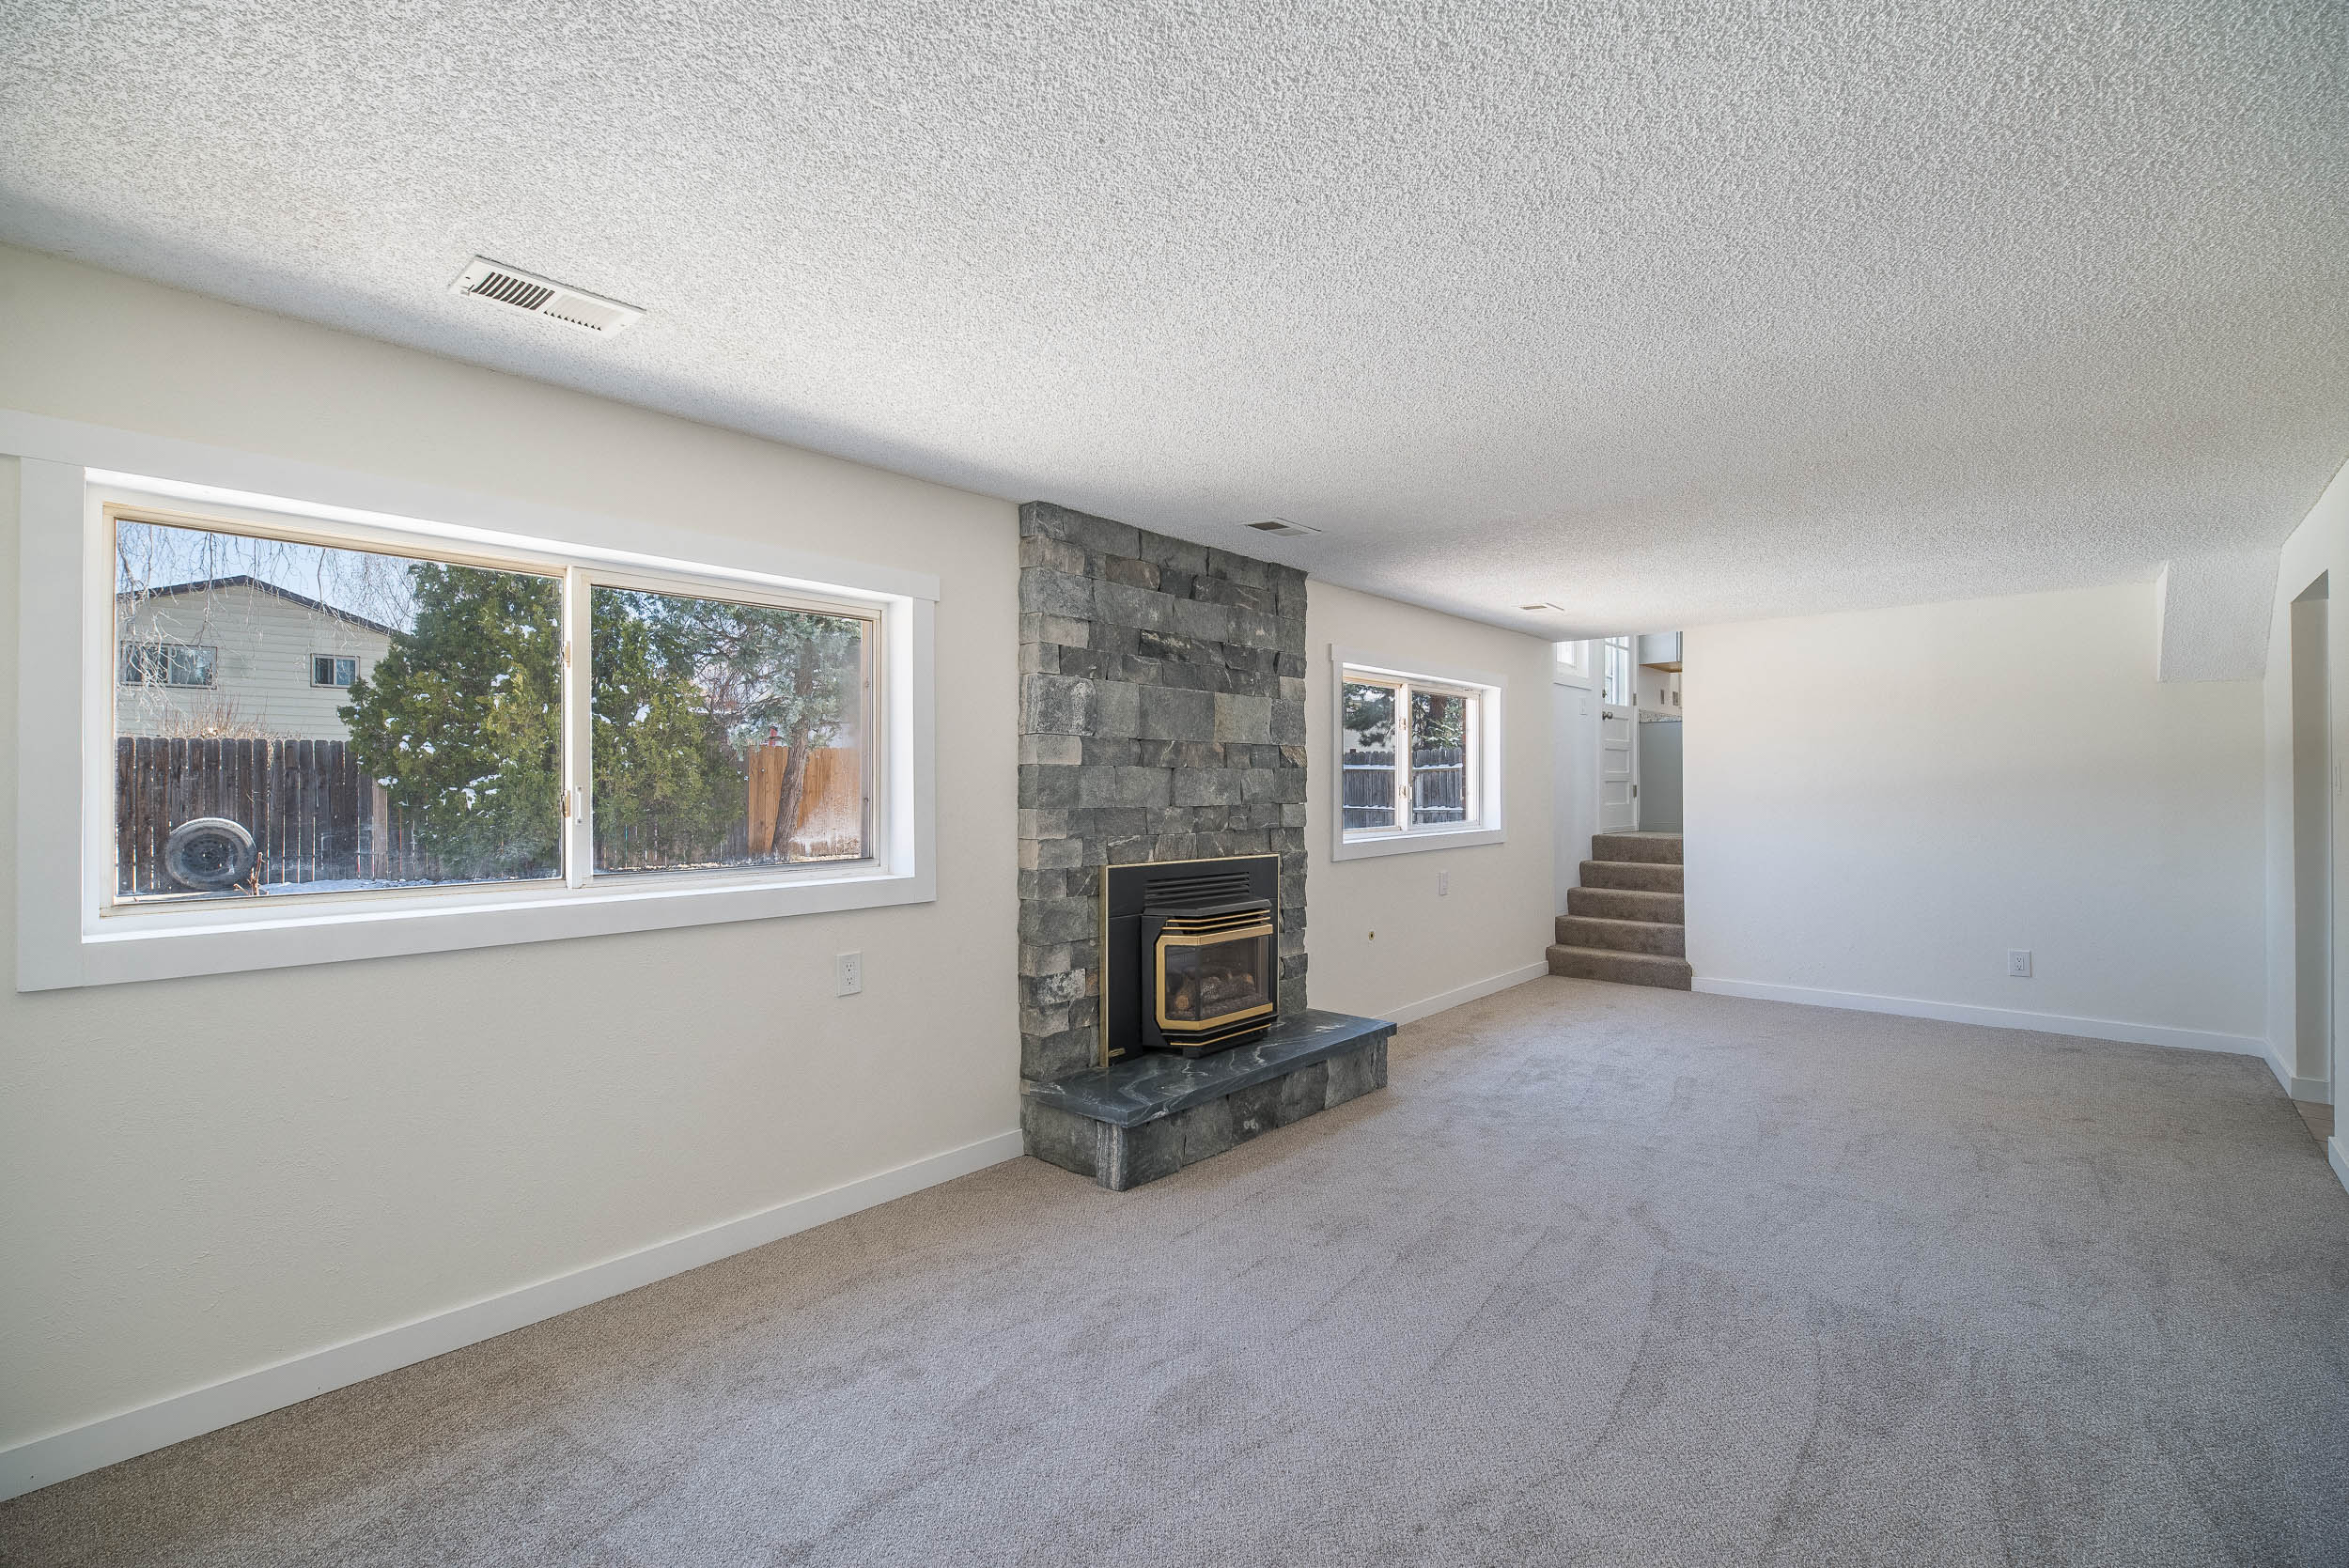
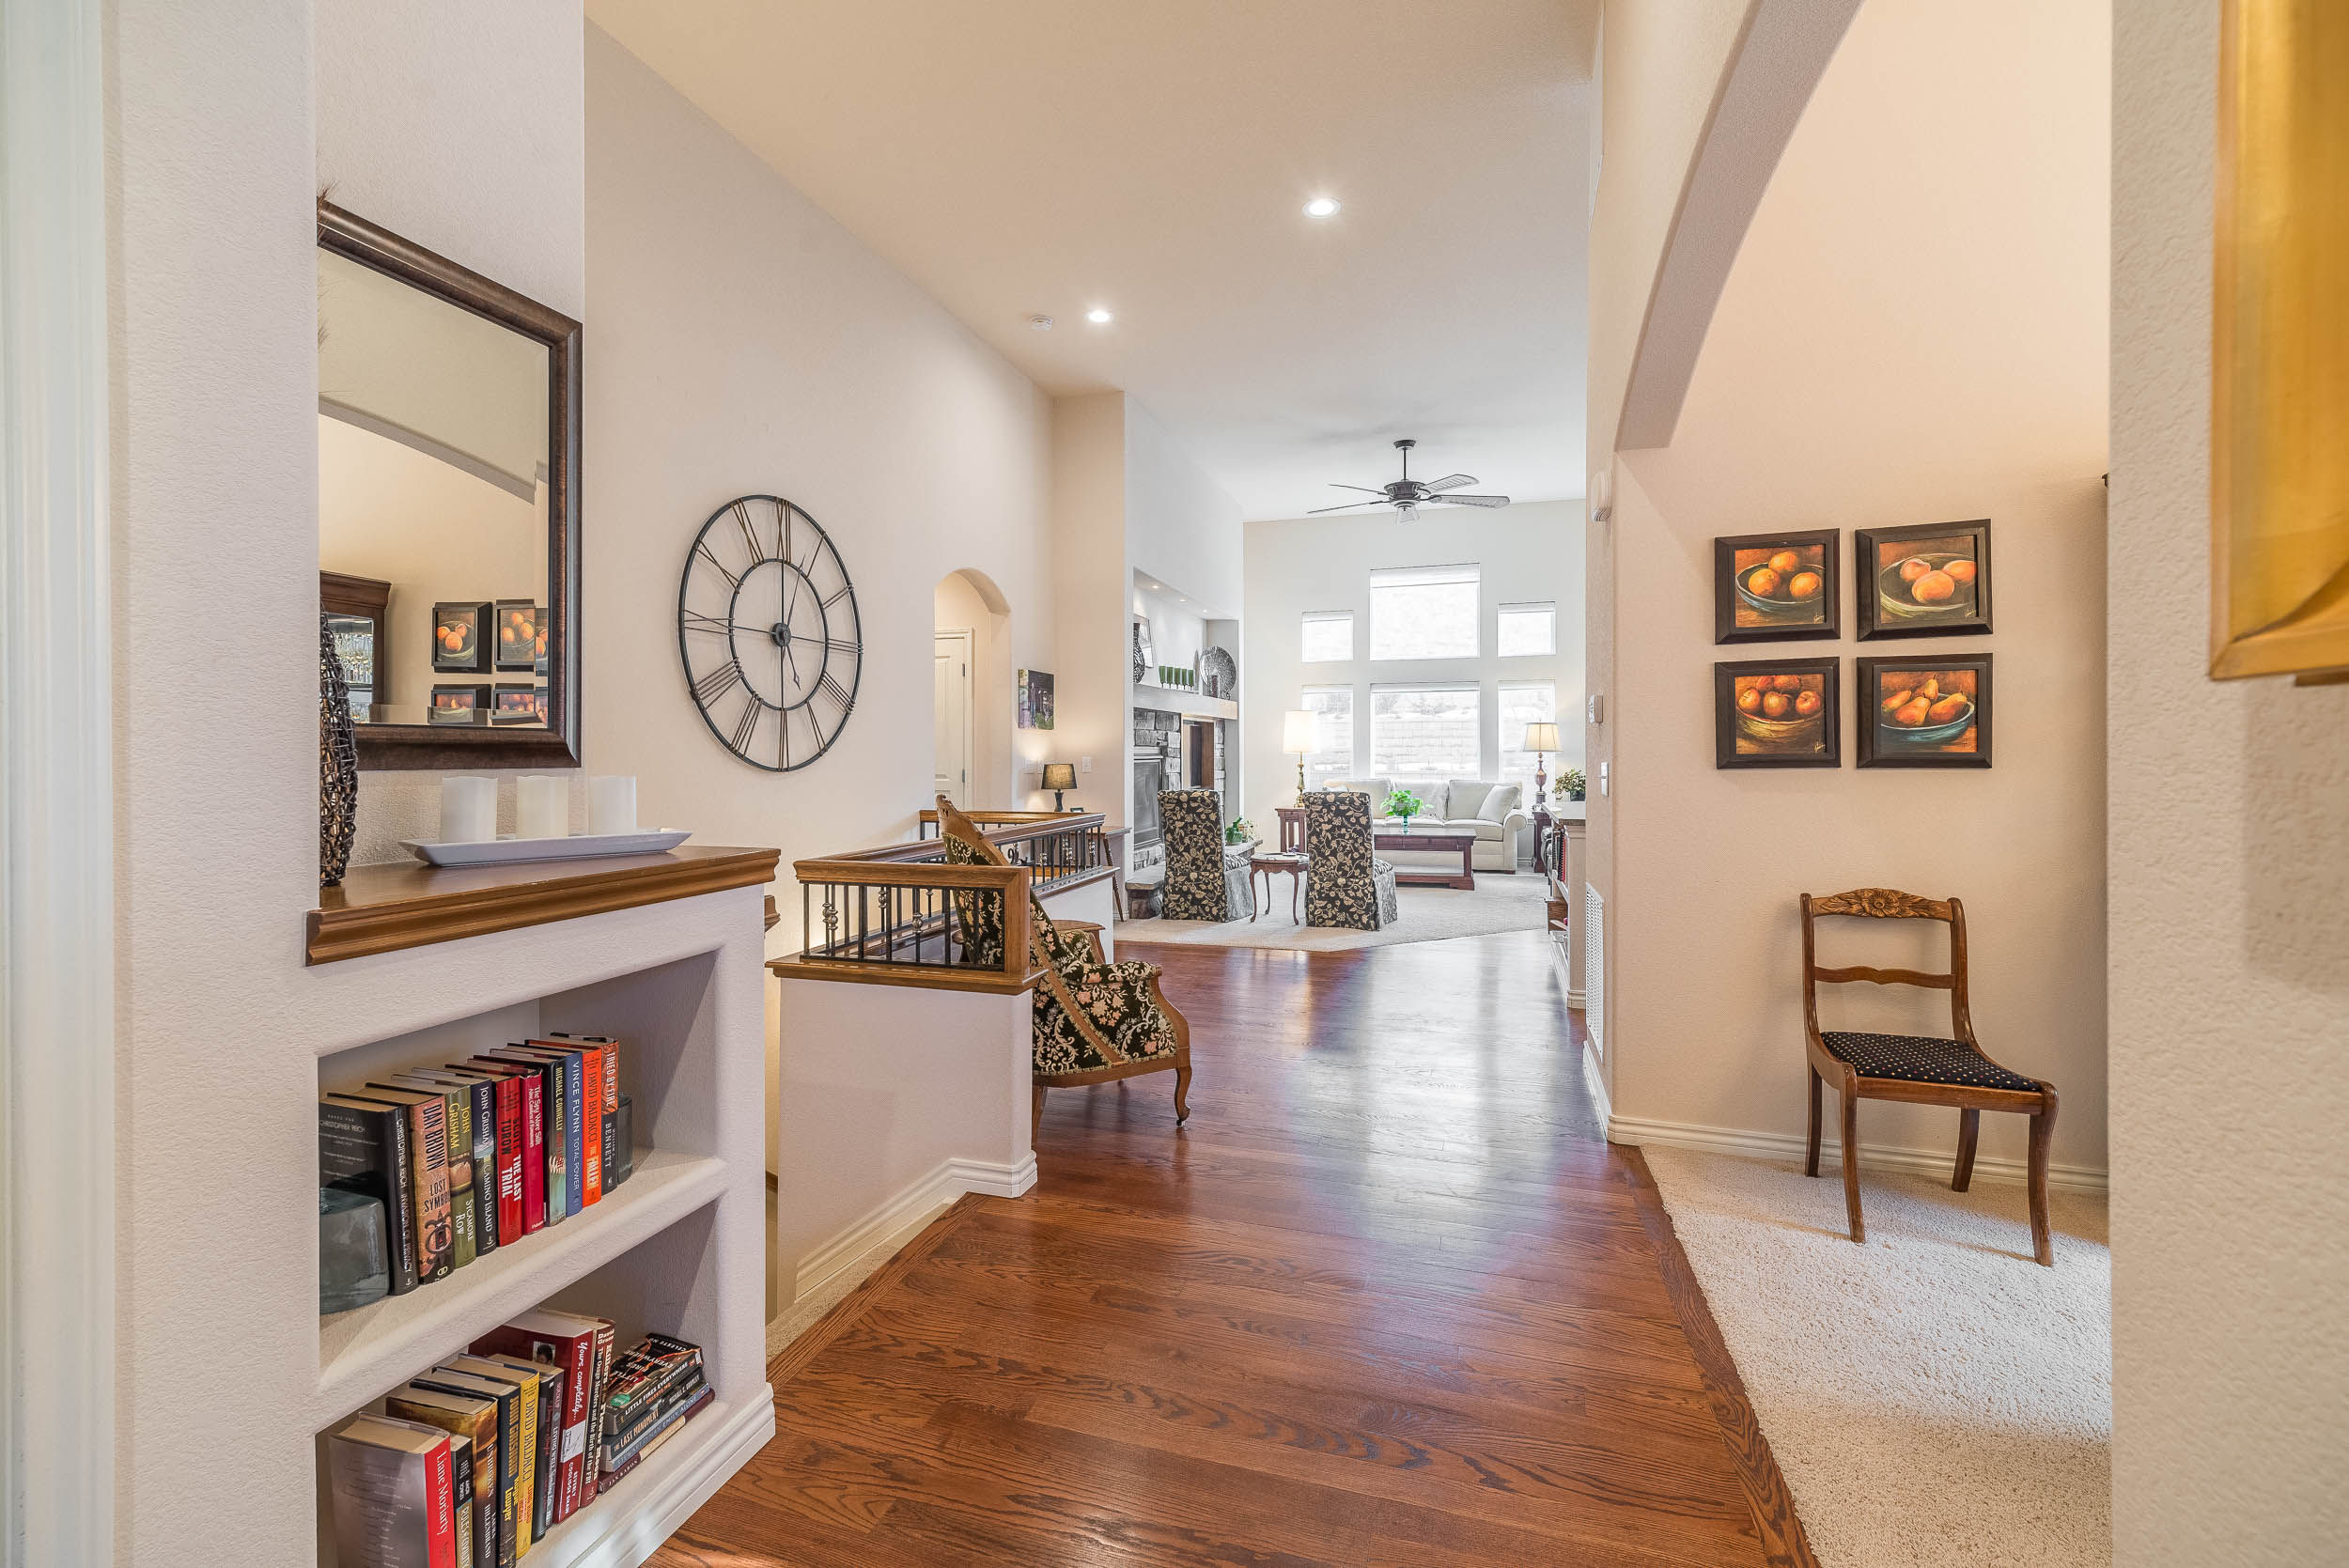
A full top to bottom remodel has just been completed! Inside you will find gleaming hardwood floors on the main and upper levels, new carpet on the lower levels, new paint, new trim, new hardware, and a bright kitchen with fresh cabinets, countertops and stainless steel appliances… This tri-level has three bedrooms upstairs and a finished basement. Large yard with extra parking, flagstone patio, newer furnace and a/c. Quiet location located a short walk to the neighborhood park and Indian Peaks Elementary School. All the work has been done, just enjoy it!
Spring is here! More new listings are coming on the market and the buyers have options. Inventory in Boulder County rose by 18% during the month to just over 1,000 listings. At the end of March, 42% of active listings were already under contract which is back to 2019 levels. The first week of April saw 104 new listings and just 32 properties go under contract. (see graph below) This is a concern going forward as the strength of the market requires steady buyer demand. Interest rates dropped yesterday into the high 5’s for the best buyers which may spark some new demand as we head into the prime selling season. See all of the statistics in the slideshow which is posted below the video.
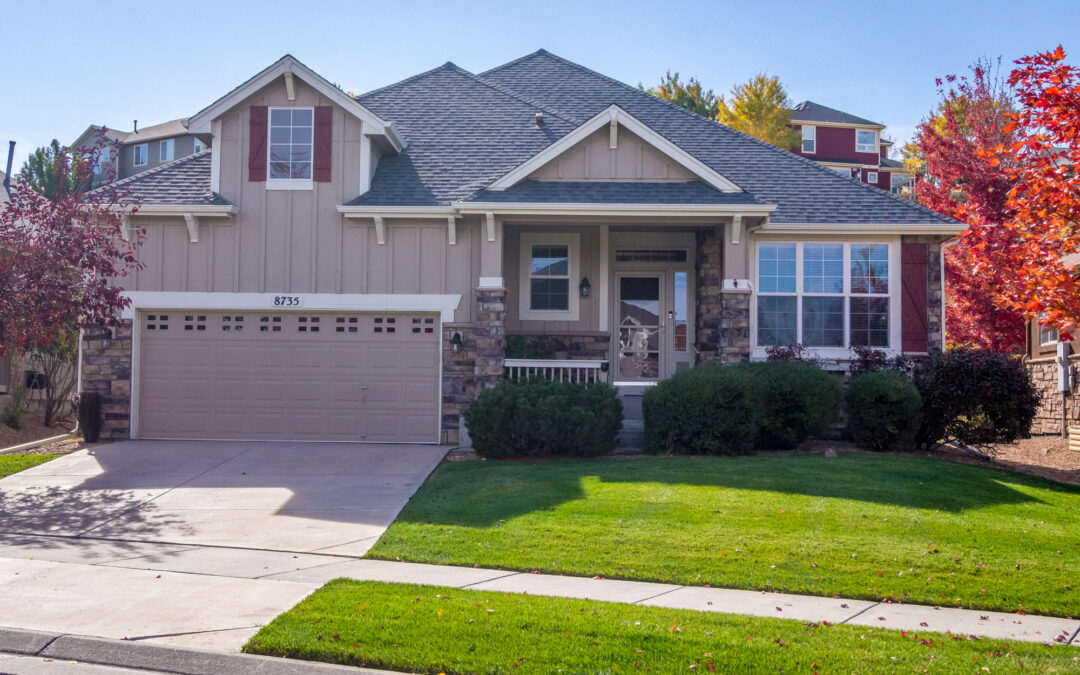
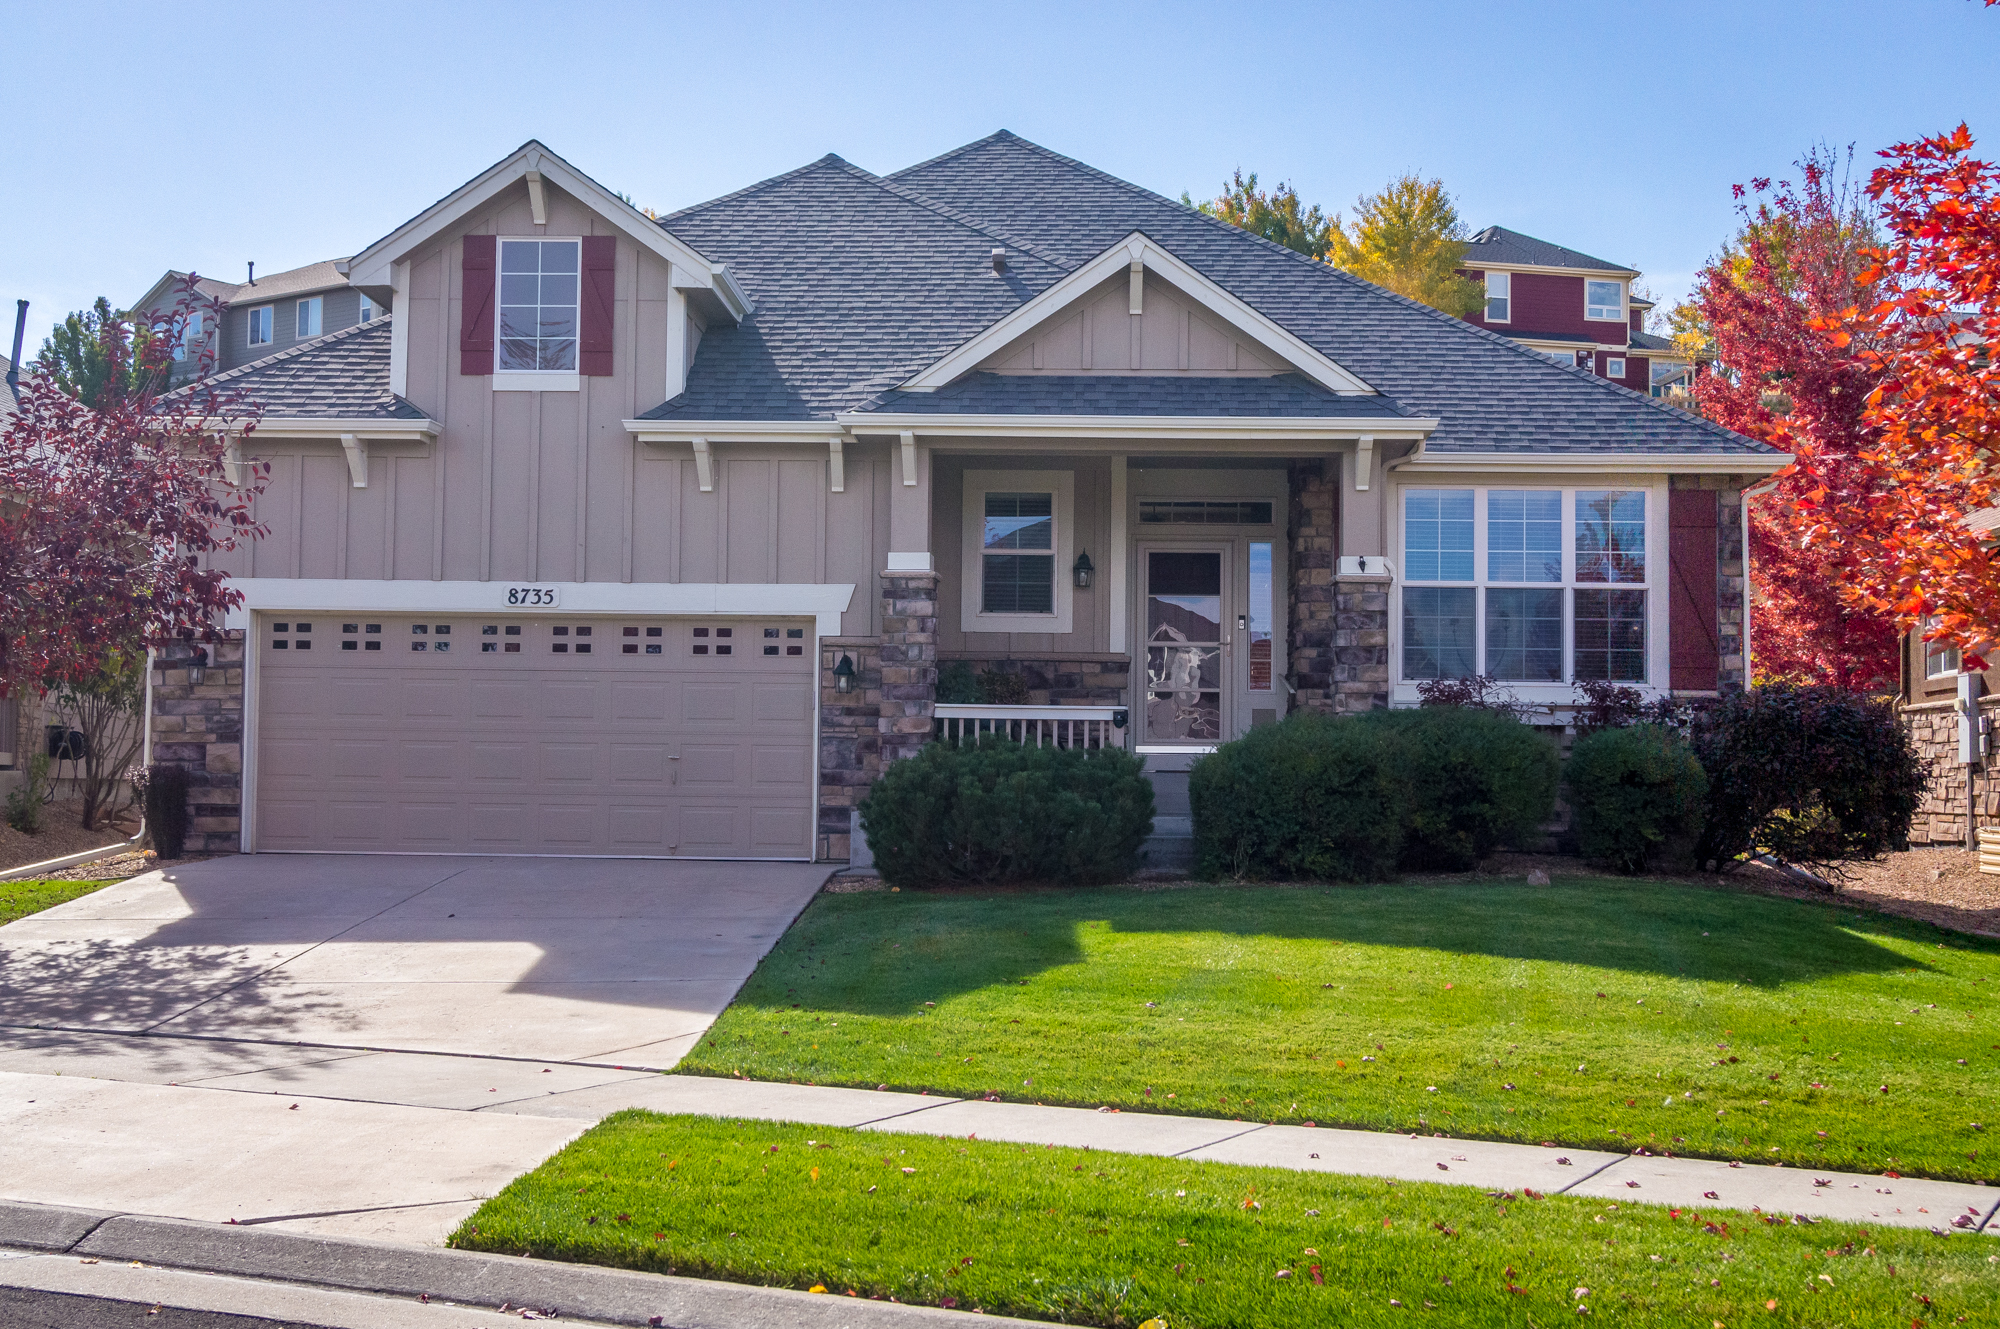
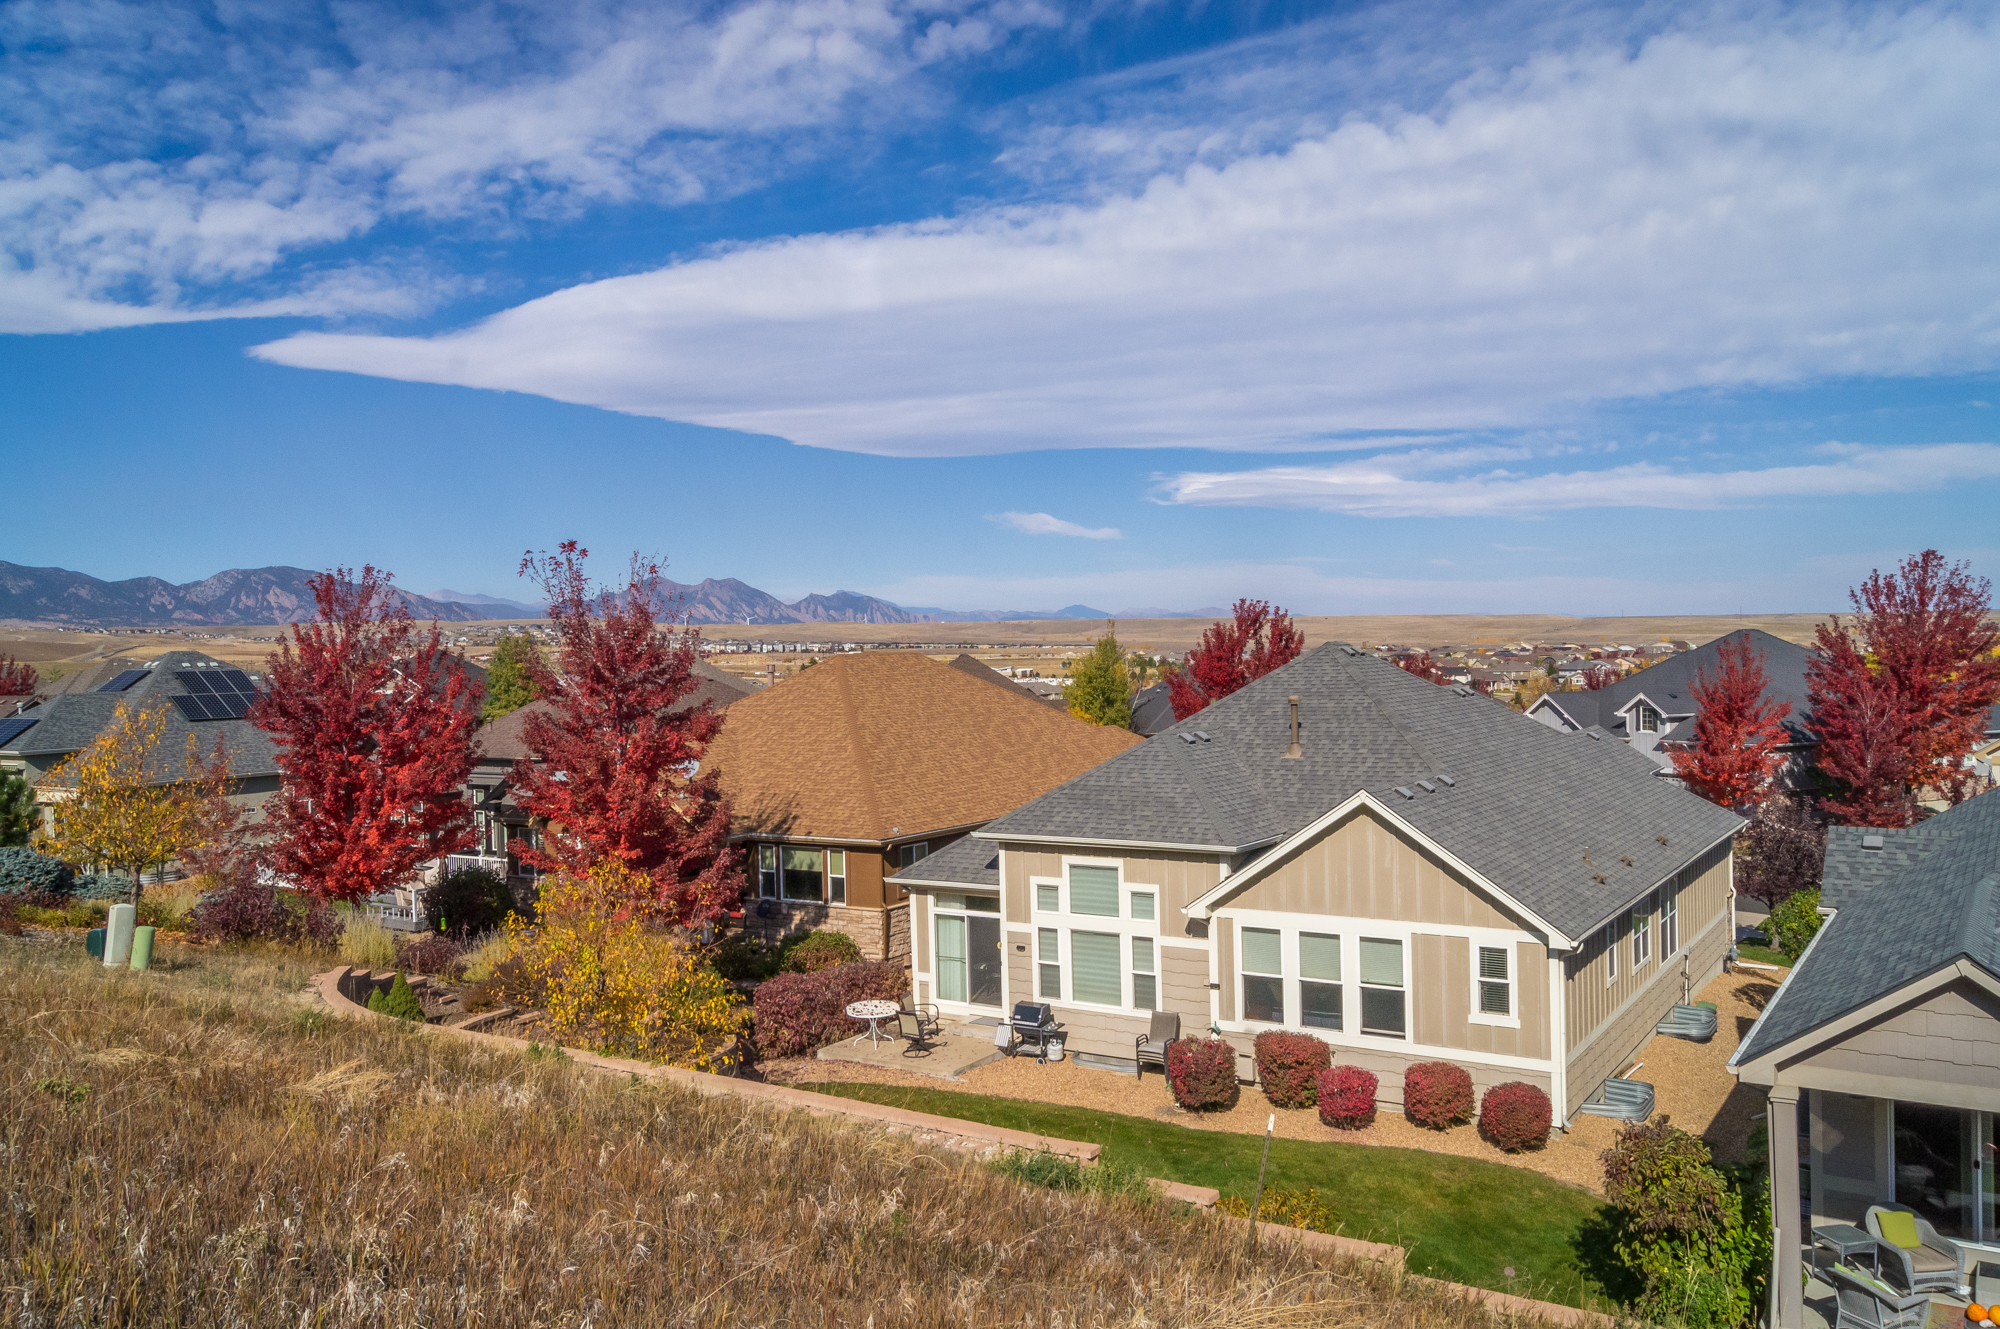
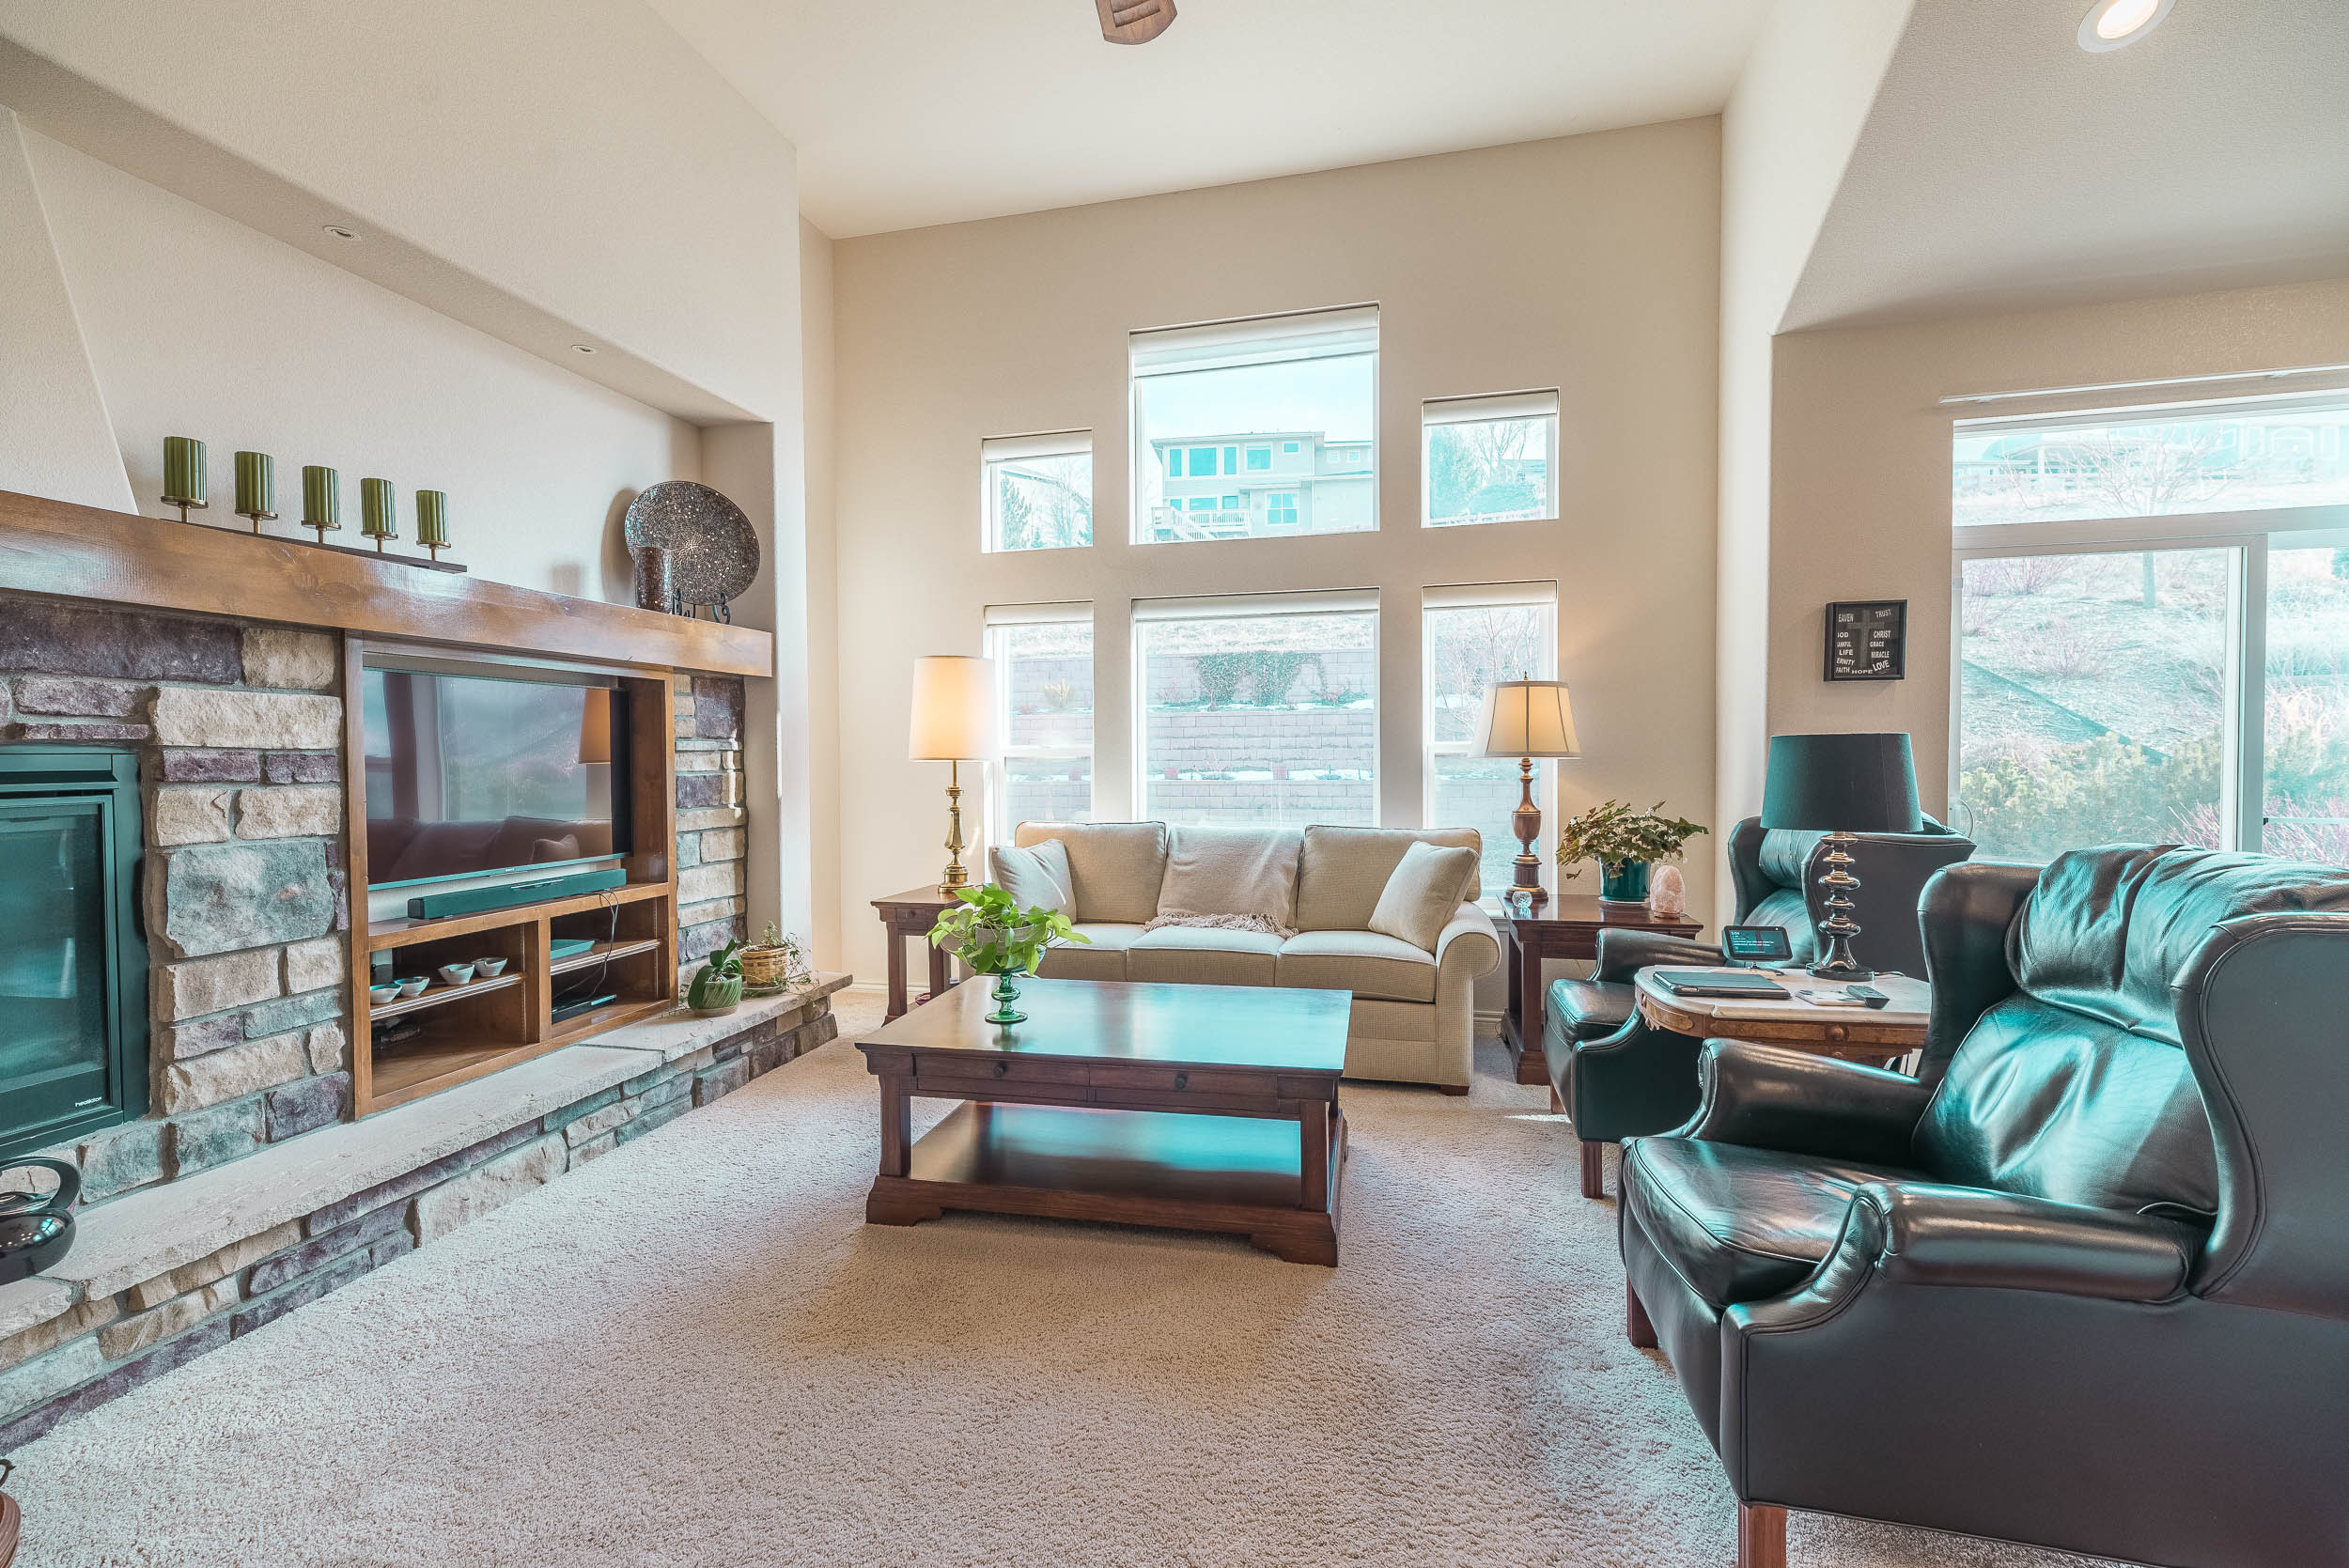
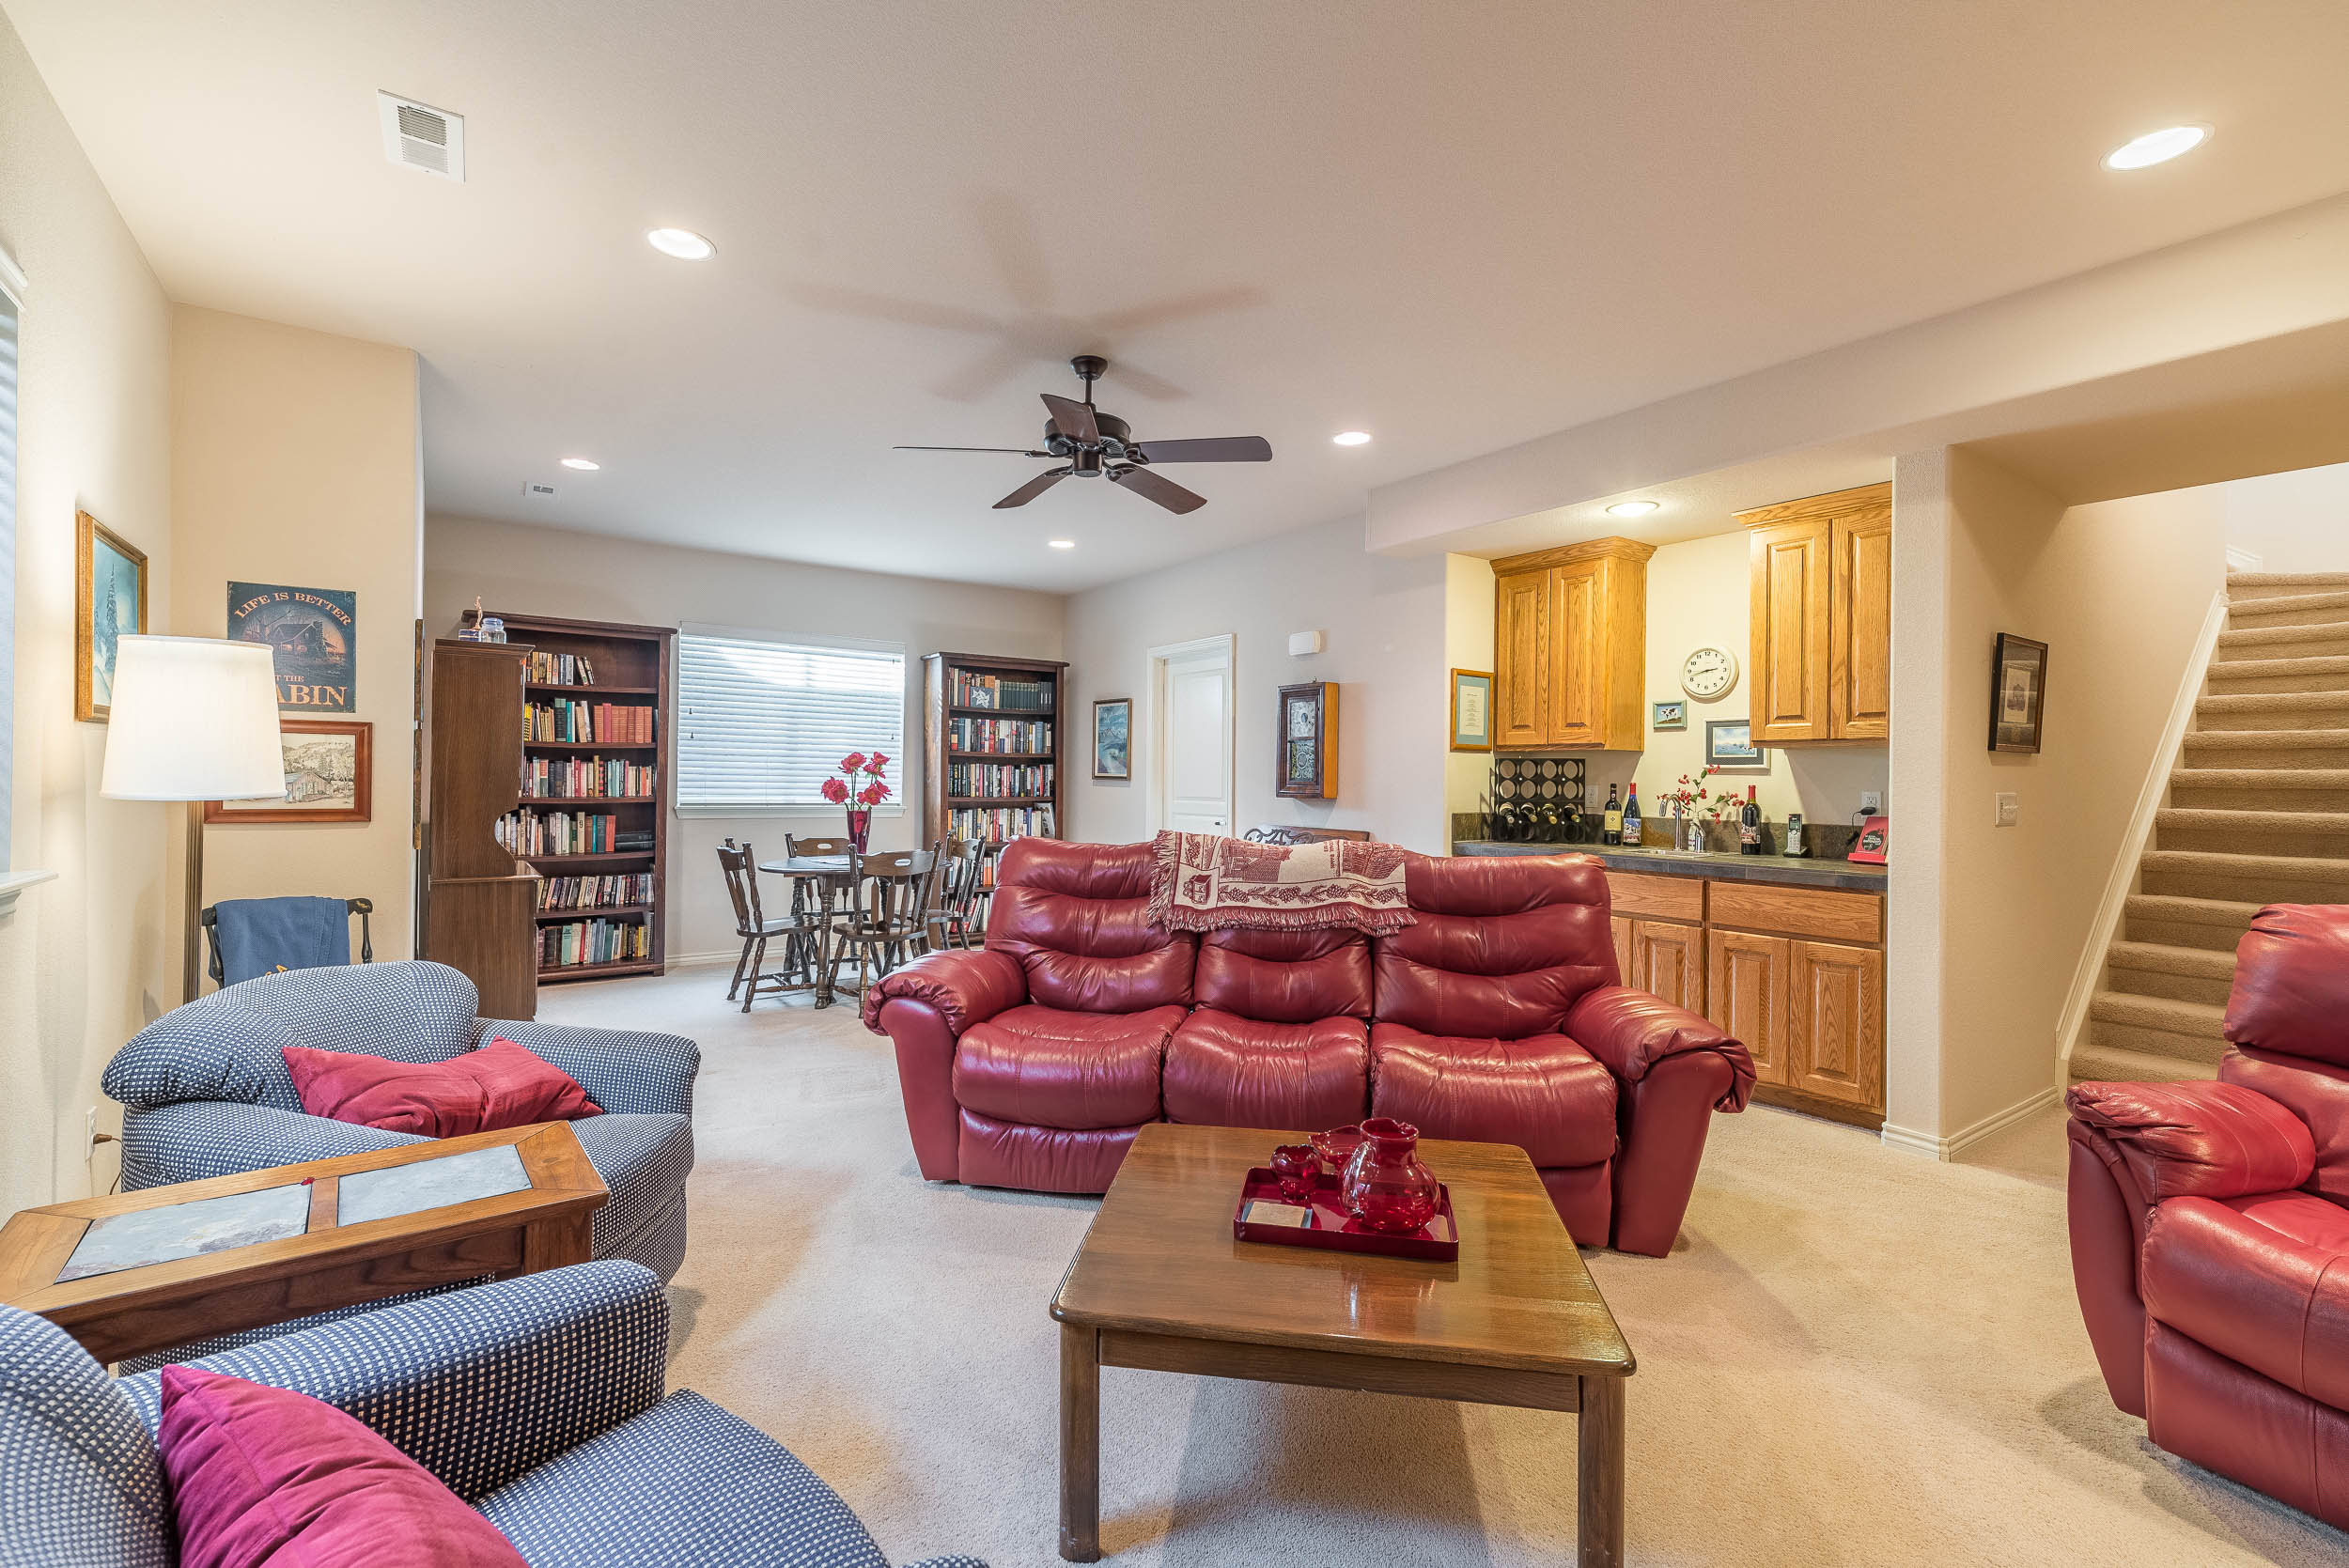
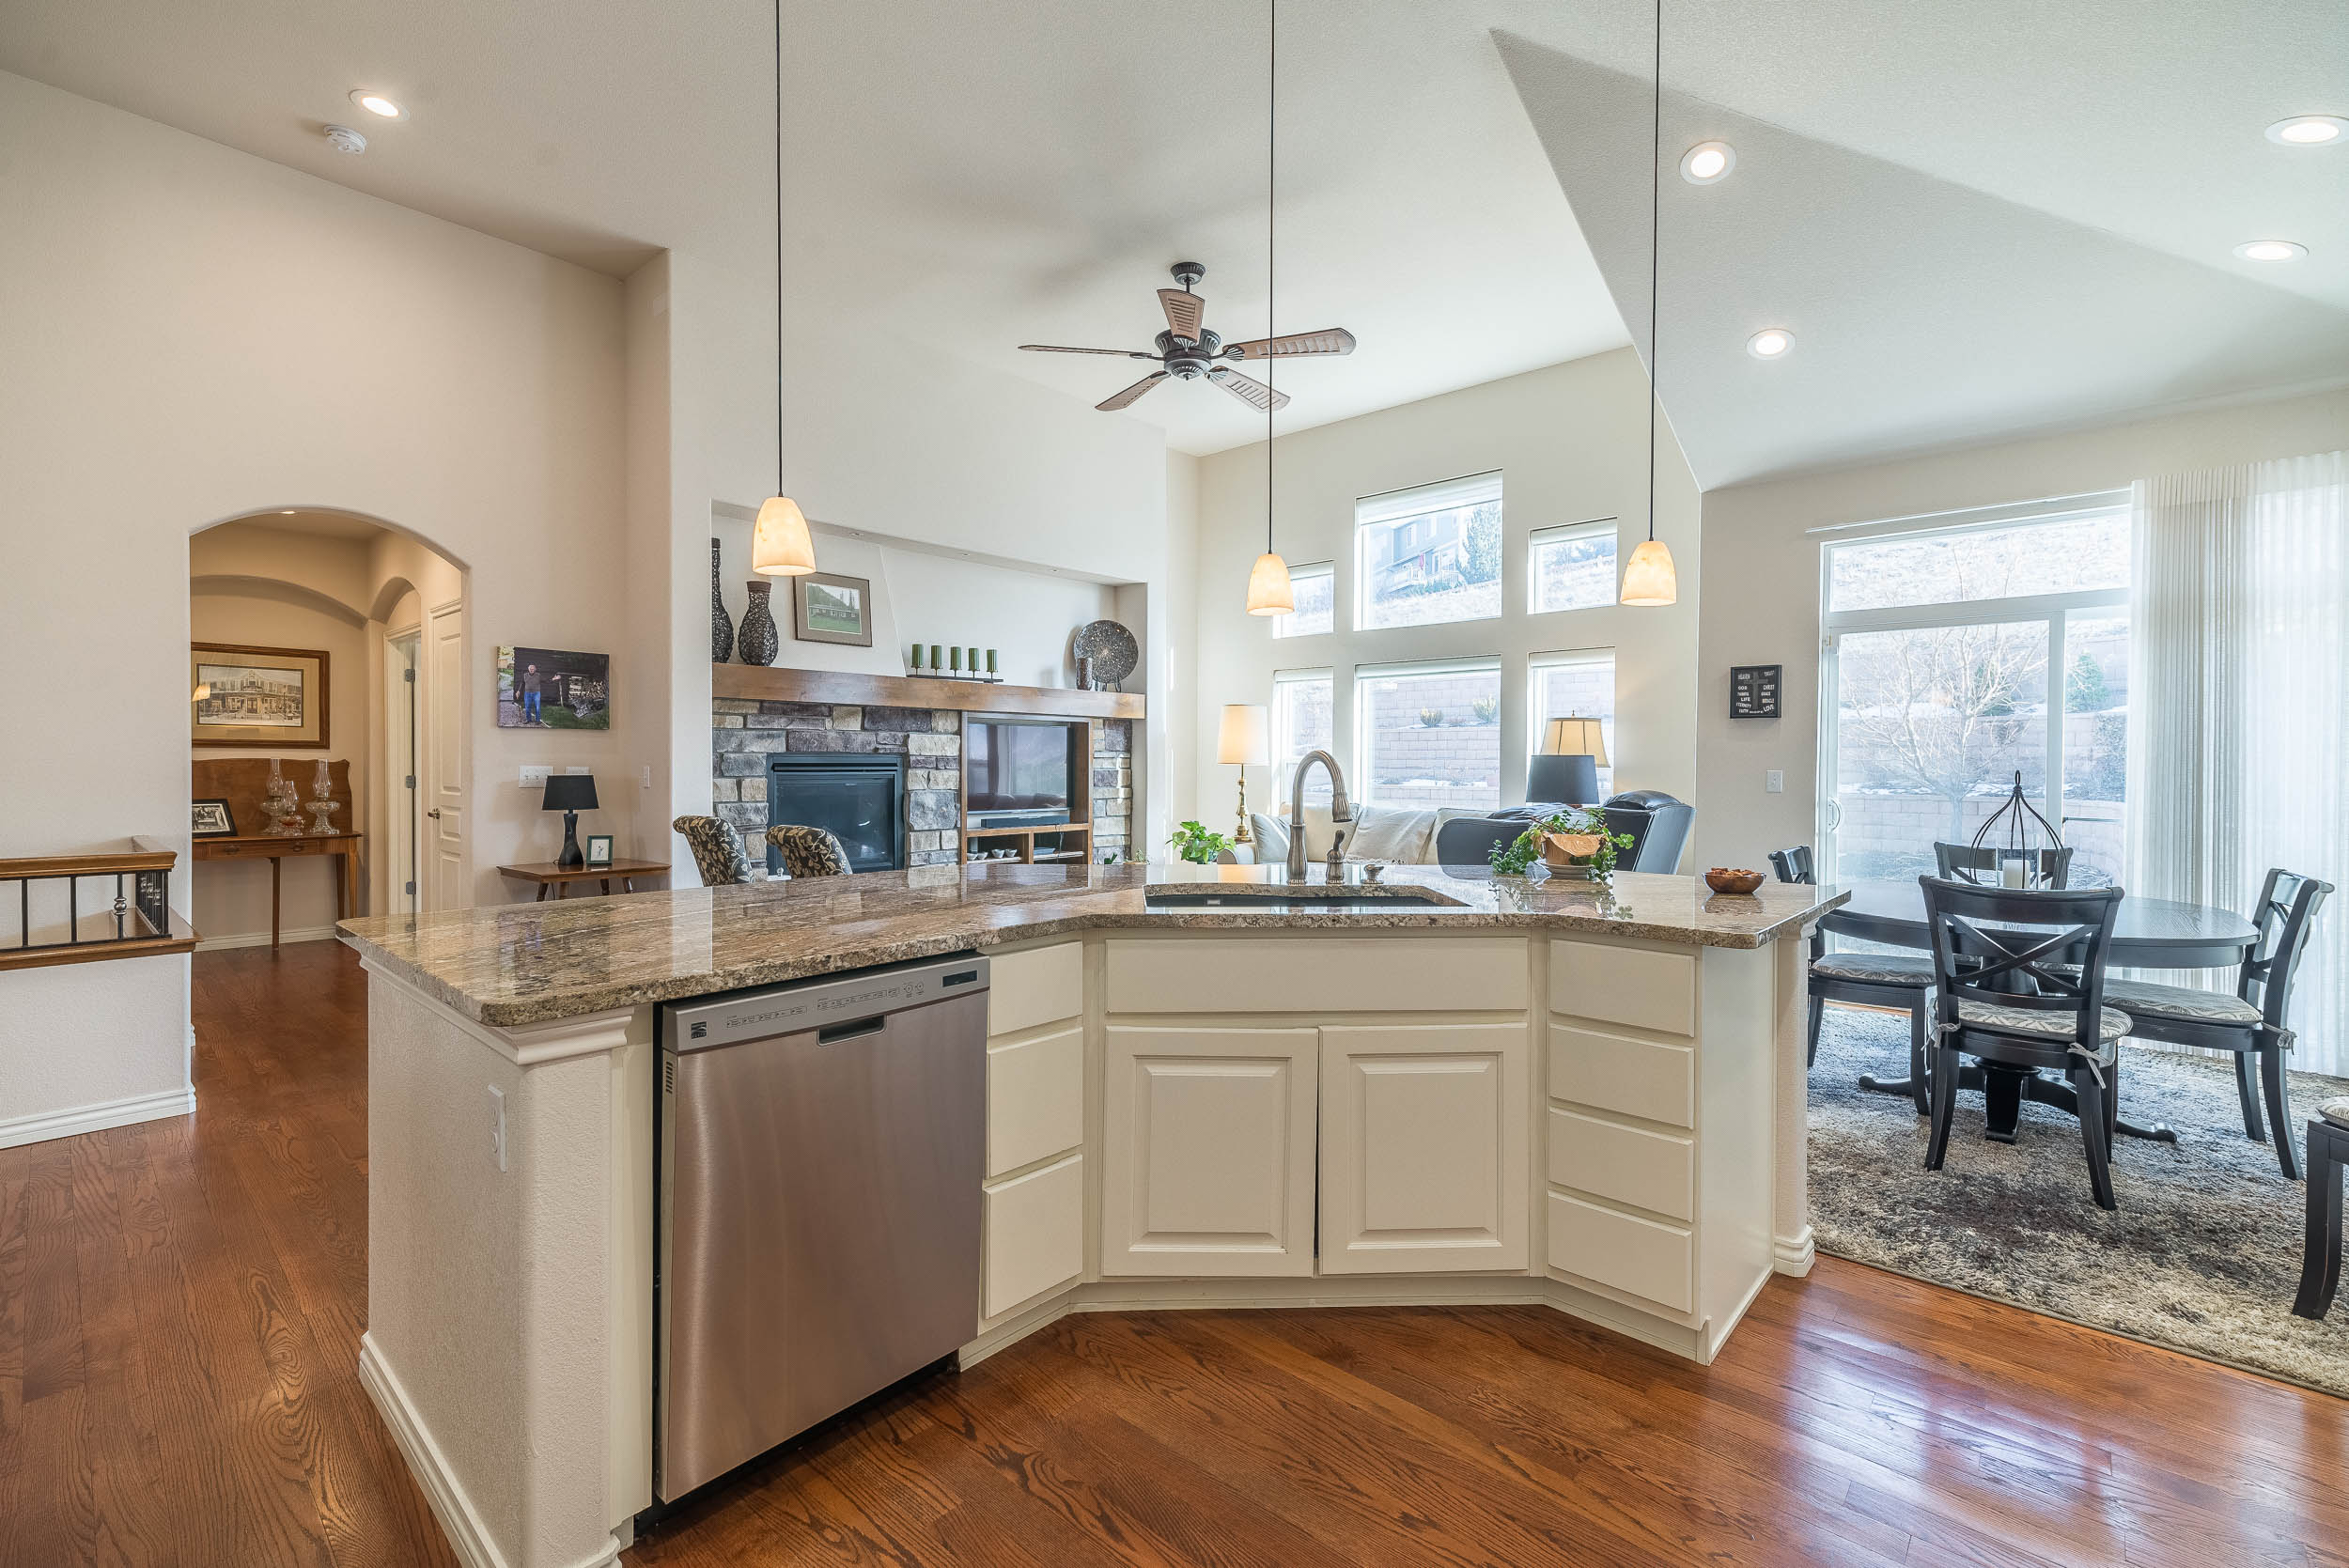
Beautiful, spacious main floor living and no yard maintenance, yet lots of room in the professionally finished basement and a large yard. There is so much to love about this beautiful home! As you step inside, you will be greeted by an abundance of natural light that floods the main floor open floor plan. The modern kitchen flows seamlessly with the main living area which creates an inviting area that is perfect for entertaining. There are two bedrooms plus a study on the main level and the builder finished basement has two additional bedrooms plus a cozy family room, a storage area and a full bath. Located on a quiet cul-de-sac that offers the perfect combination of privacy and convenience. Enjoy low maintenance living with all lawn care and snow removal included in the HOA fee. Conveniently located just 16 miles to Boulder and 19 miles to downtown Denver, this property is just minutes away from shopping, dining, and entertainment options. Don’t miss out on the opportunity to make 8735 Deframe Court your dream home!
Last summer, after the market quickly changed from sizzling to simmering, there was speculation that the high interest rates were going to spiral the market into a big correction. There have been some changes in the market, but the worst case scenario predictions have not come to pass. Today, I will give an overview of the market as well as analyze the the Boulder County real estate market by price. Yes, there is a difference!
Overview
The main outcomes of the recent market shift have been fewer sales. High interest rates (upper 6’s at this writing) has suppressed both the supply of listings as well as the number of buyers. Sellers who may have considered a move are reconsidering once they realize that they would be giving up their current low payment with its low interest rate and stepping up to a payment significantly higher for the same priced home. Many would-be sellers are deciding to stay where they are. Homebuyers seem to be adjusting to the initial shock of interest rates that have more than doubled in the last 18 months, but with prices holding steady, affordability is a big concern. Fewer buyers are able to qualify for the properties they once did. These happen to be the ones they aspire to buy. But a subset of possible buyers is still ready, willing and able. Cash is king and there is a lot of cash flowing into real estate.
With both supply and demand reduced the market is fairly balanced. Inventory is rising off of last years rock bottom levels, but it is still well below normal. Since inventory is not accumulating prices are mostly stable and attractive properties are still selling fairly quickly. In February, the average time it took to put a home under contract that made it to the closing table was around 55 days. Up from the low 20’s last year.
Breaking It Down By Price
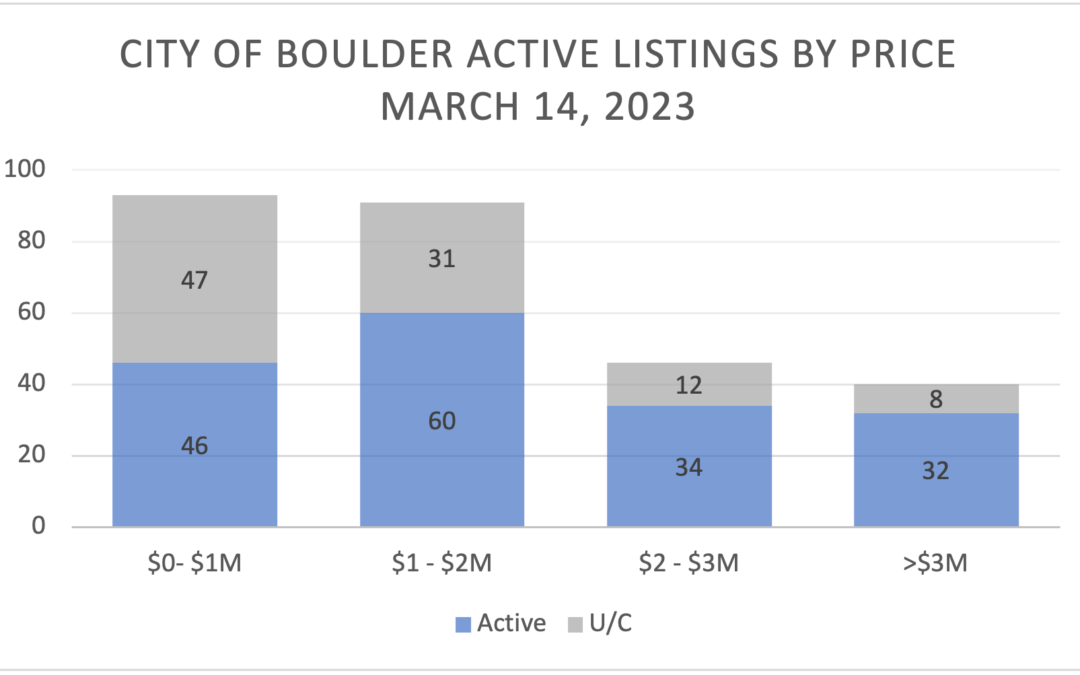
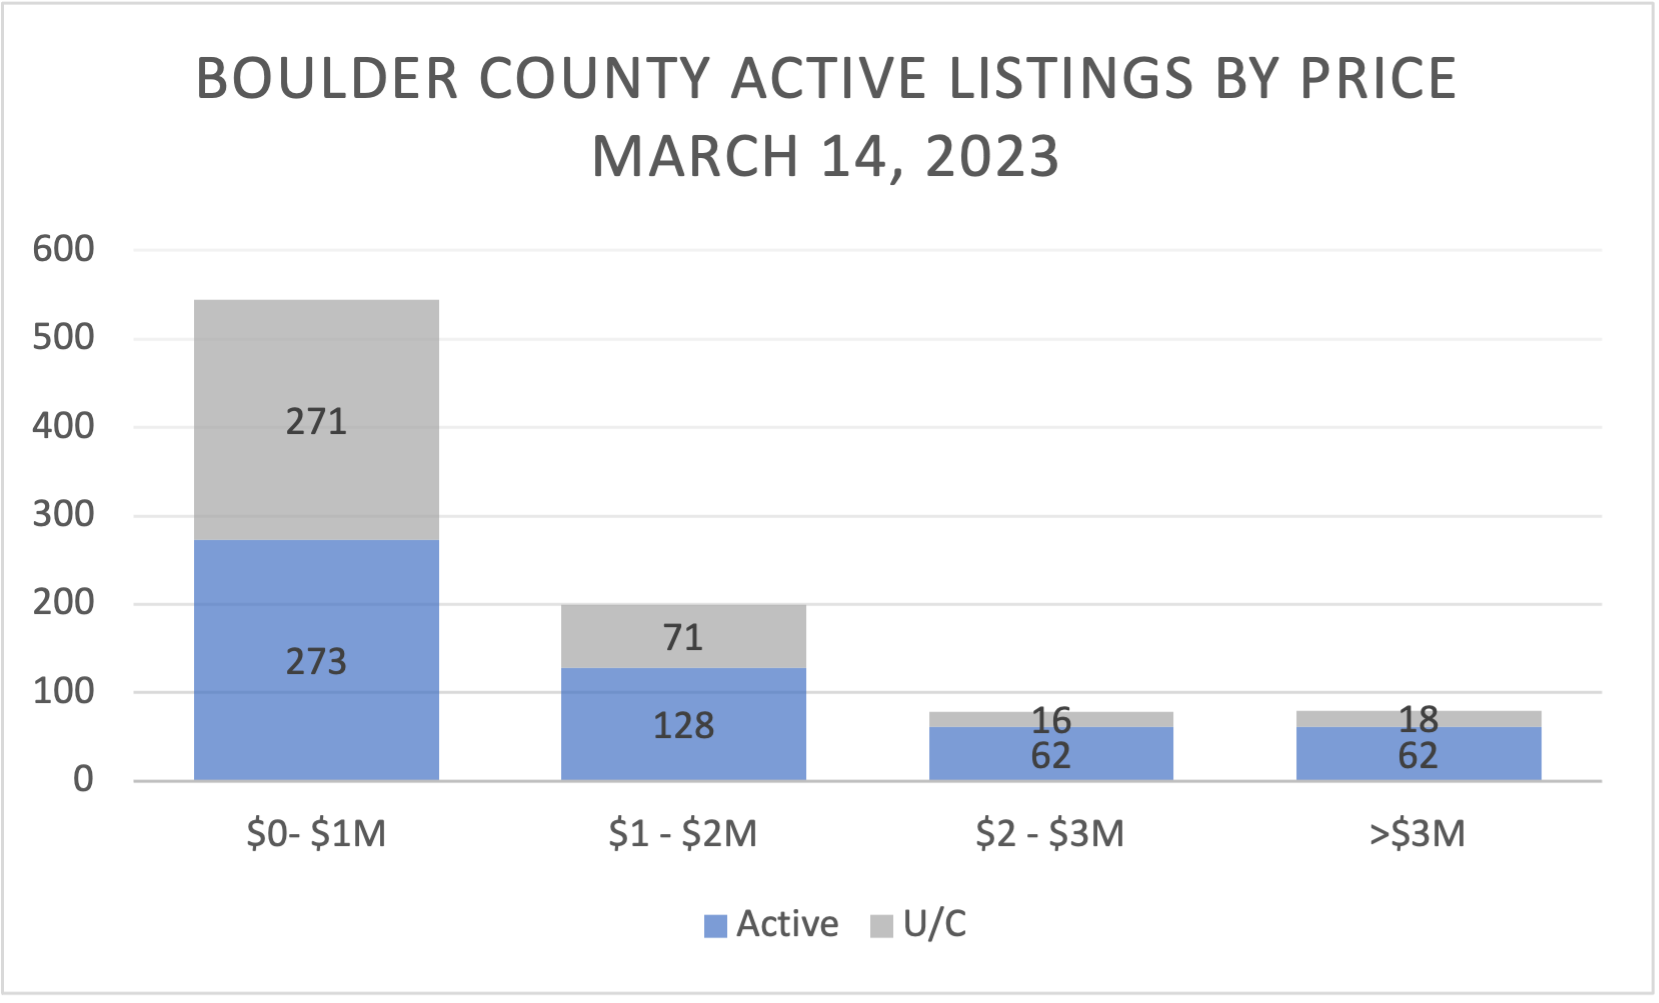
This chart shows the breakdown of listings by price. The blue half shows the available properties and the gray half shows the properties that are already under contract.
Boulder County has a wide scope of properties representing a huge range of prices. Currently there are 983 listings ranging from a 640 square foot cabin in the mountains in need of a septic tank to a 13,000 square foot home (do we still call it that?) on 115 acres listed for $25,000,000. Clearly, not all properties are equivalent and therefore, big sweeping statements about the market are not one-size-fits-all. Let’s break it down a bit. This time by price.
Boulder County
Boulder County
Active
All
U/C
U/C %
Sold
Months of Inventory
SP:LP
DTO
$0- $1M
273
544
271
50%
471
3.5
99%
45
$1 – $2M
128
199
71
36%
101
5.9
98%
41
$2 – $3M
62
78
16
21%
33
7.1
96%
41
>$3M
62
80
18
23%
14
17.1
96%
224
U/C% = # of homes that are currently under contract / # all current listings. – Months of Inventory = # of months it would take to sell all current listings if sales continued at their current pace. – SP:LP = Sales price to list price ratio – DTO = Days to Offer
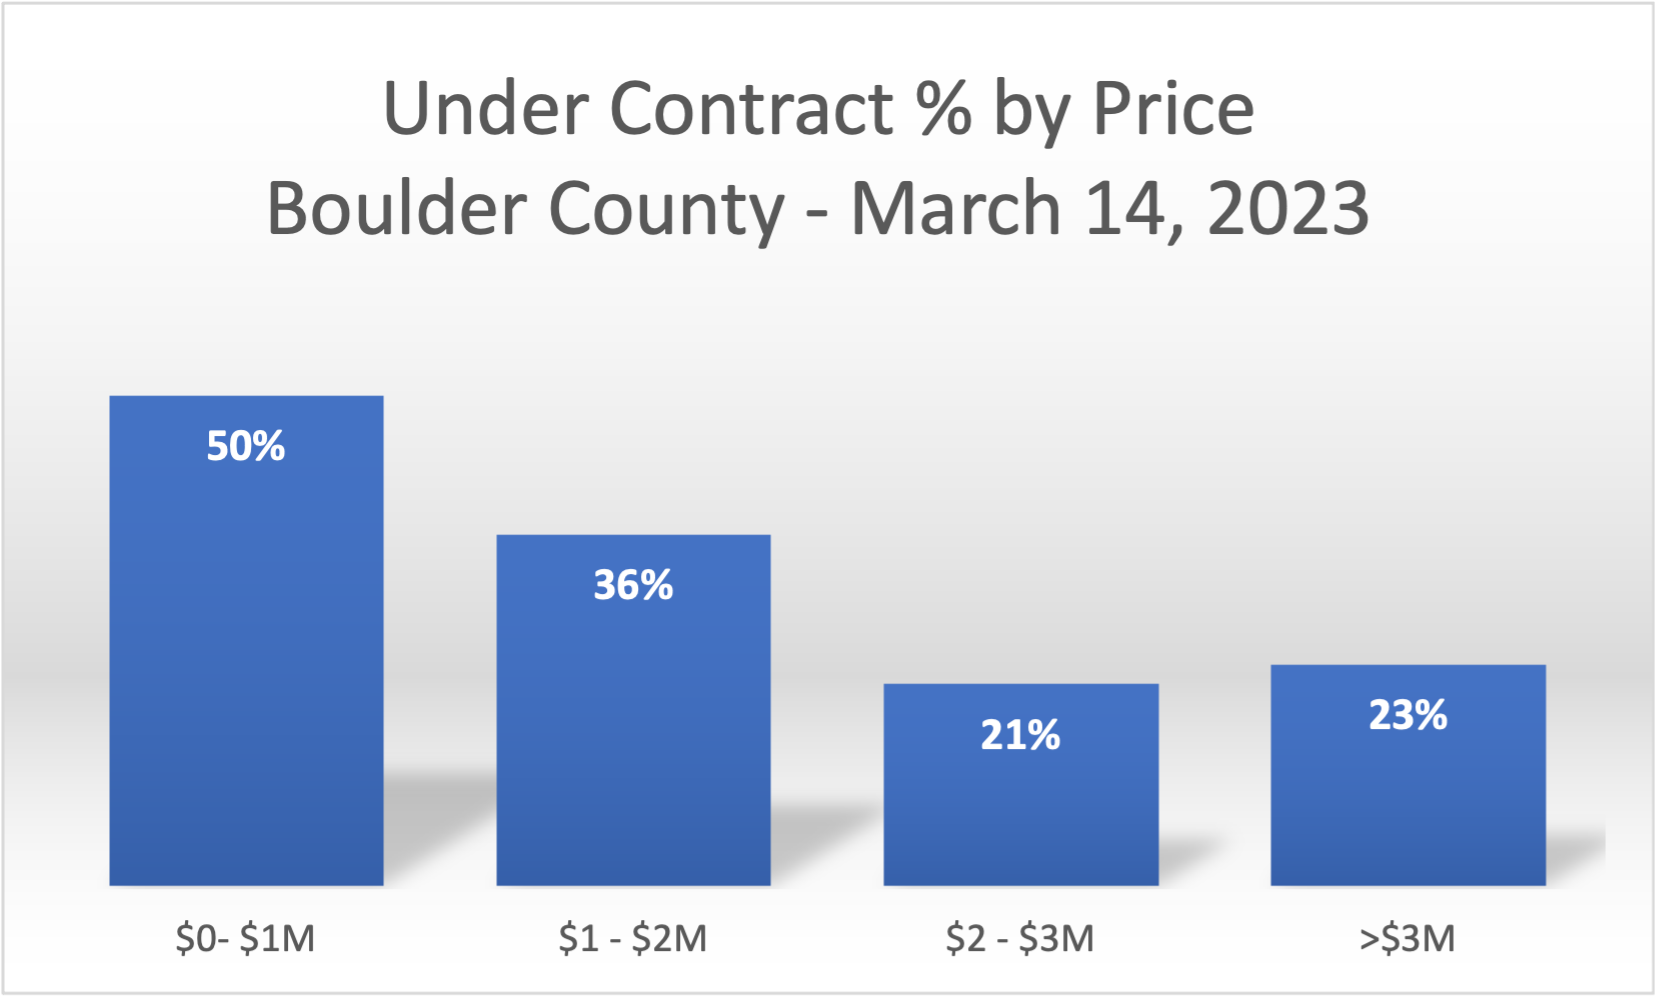
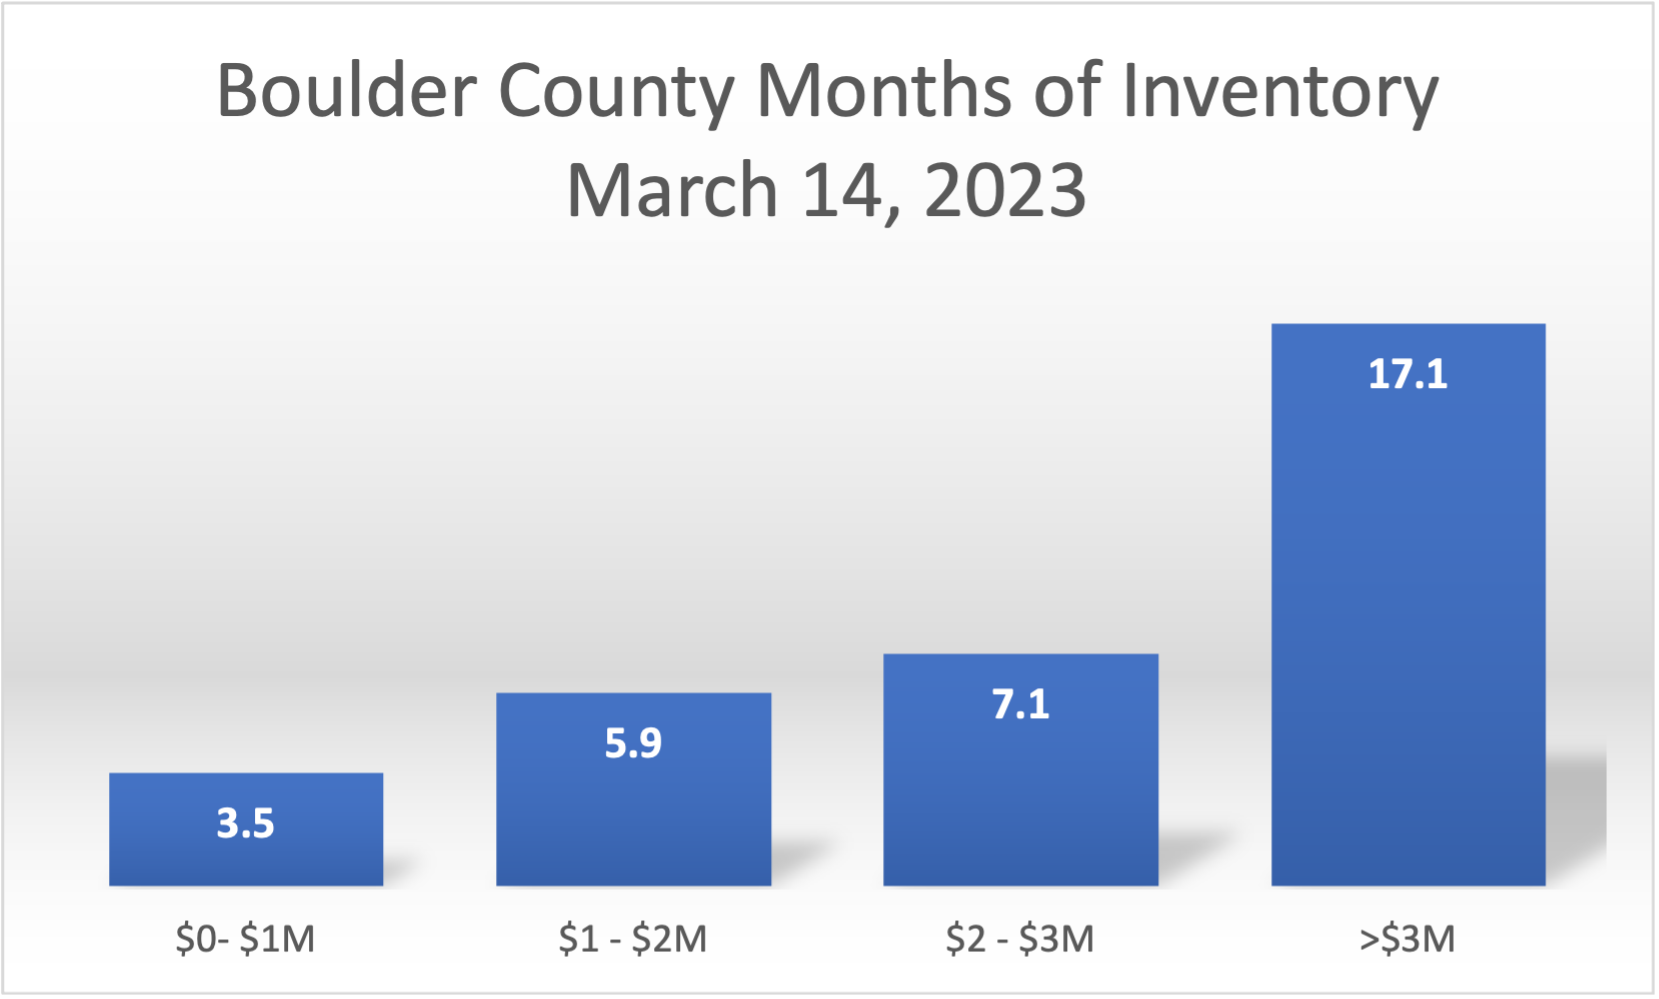
$0 – $1,000,000 The market for homes below $1 million is strong. Half of all current listings are under contract. Properties are selling within 1% of the asking price. At the pace of sales over the past three months, there is just 3.5 months of inventory on the market (4-6 months in balanced). Slightly a seller’s market. On average it’s taking 45 days to get a house under contract.
$1,000,000 – $2,000,000 In this price range, there are fewer listings and just 36% of those listings are under contract. With the average property selling at 98% of the asking price, prices seem to be still holding steady. Properties are staying on the market for 41 days before receiving a contract. At the pace of sales over the past three months, there is 5.9 months of inventory on the market. This is defined as a balanced market.
$2,000,000 – $3,000,000 There are just 78 listings in this price range. 21% of all current listings are under contract. Properties are selling within 4% of the asking price. At the pace of sales over the past three months, there is 7.1 months of inventory on the market (4-6 months in balanced). Slightly a buyer’s market. On average it’s taking 41 days to get a house under contract.
$3,000,000 and above There are 80 listings in this price range in Boulder County. 23% of all current listings are under contract, which is very strong. Properties are selling within 4% of the asking price. At the pace of sales over the past three months, there is 17.1 months of inventory on the market (4-6 months in balanced). This indicates a buyer’s market. On average it’s taking 224 days to get a house under contract. Given the current number of listings that are under contract I expect the numbers for inventory and days-to-offer to improve significantly in the coming months.
City of Boulder
City of Boulder
Active
All
U/C
U/C %
Sold
Months of Inventory
SP:LP
DTO
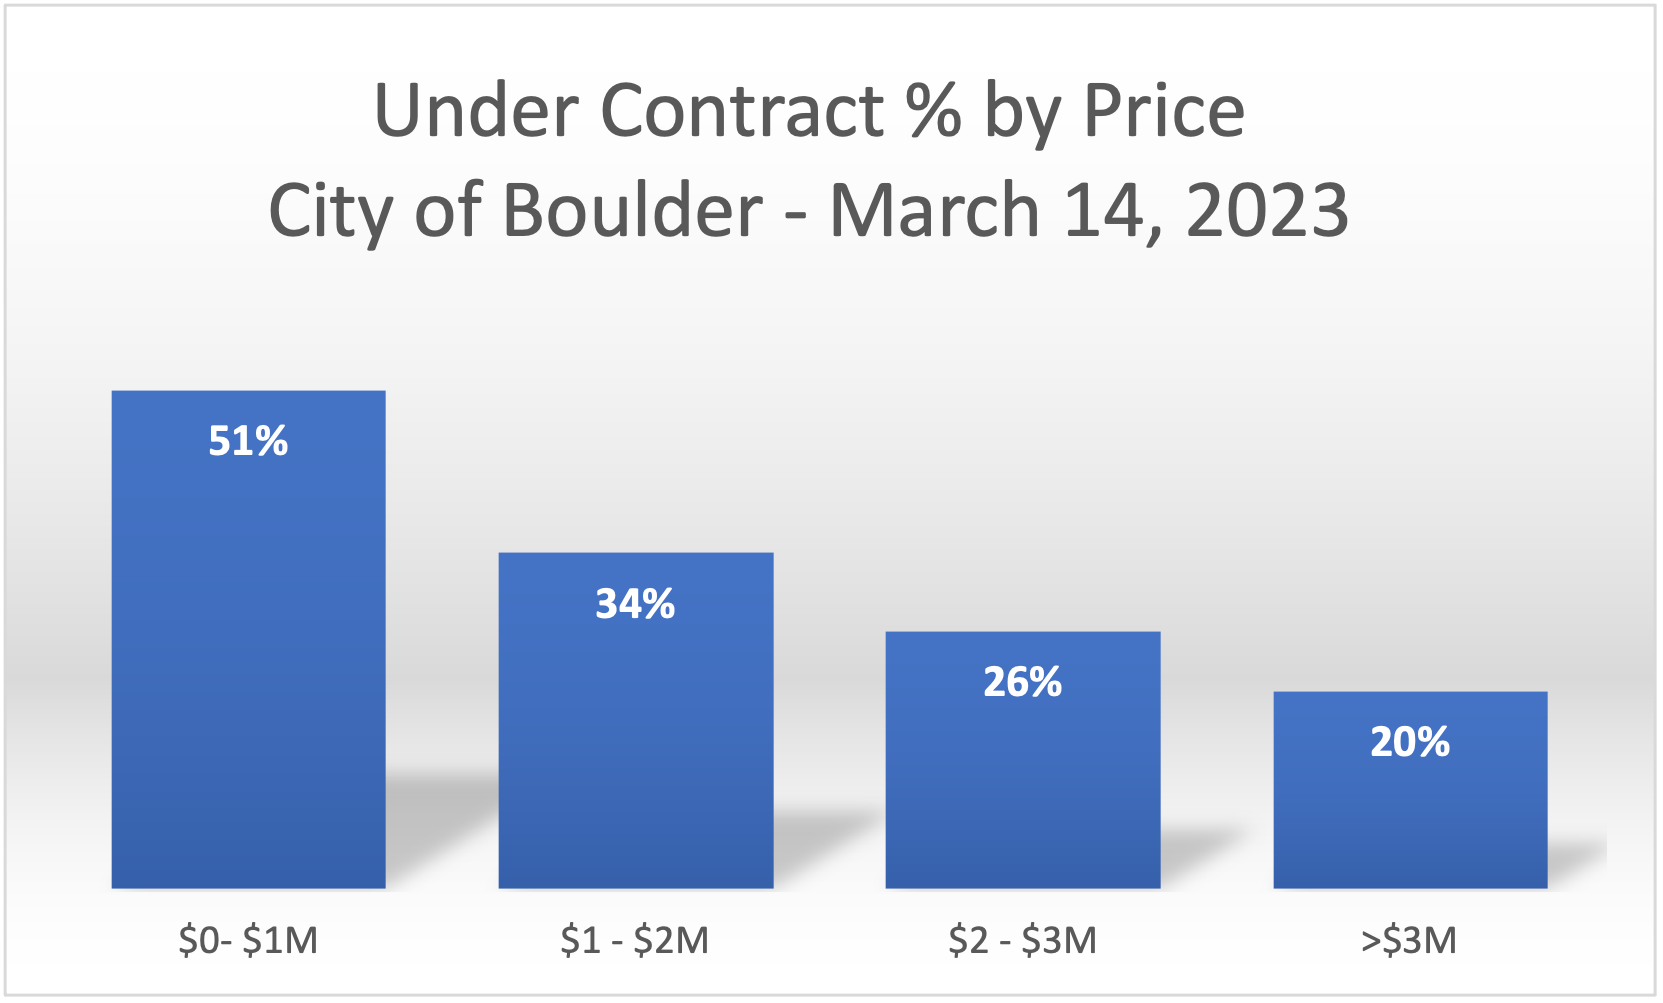
$0- $1M
46
93
47
51%
109
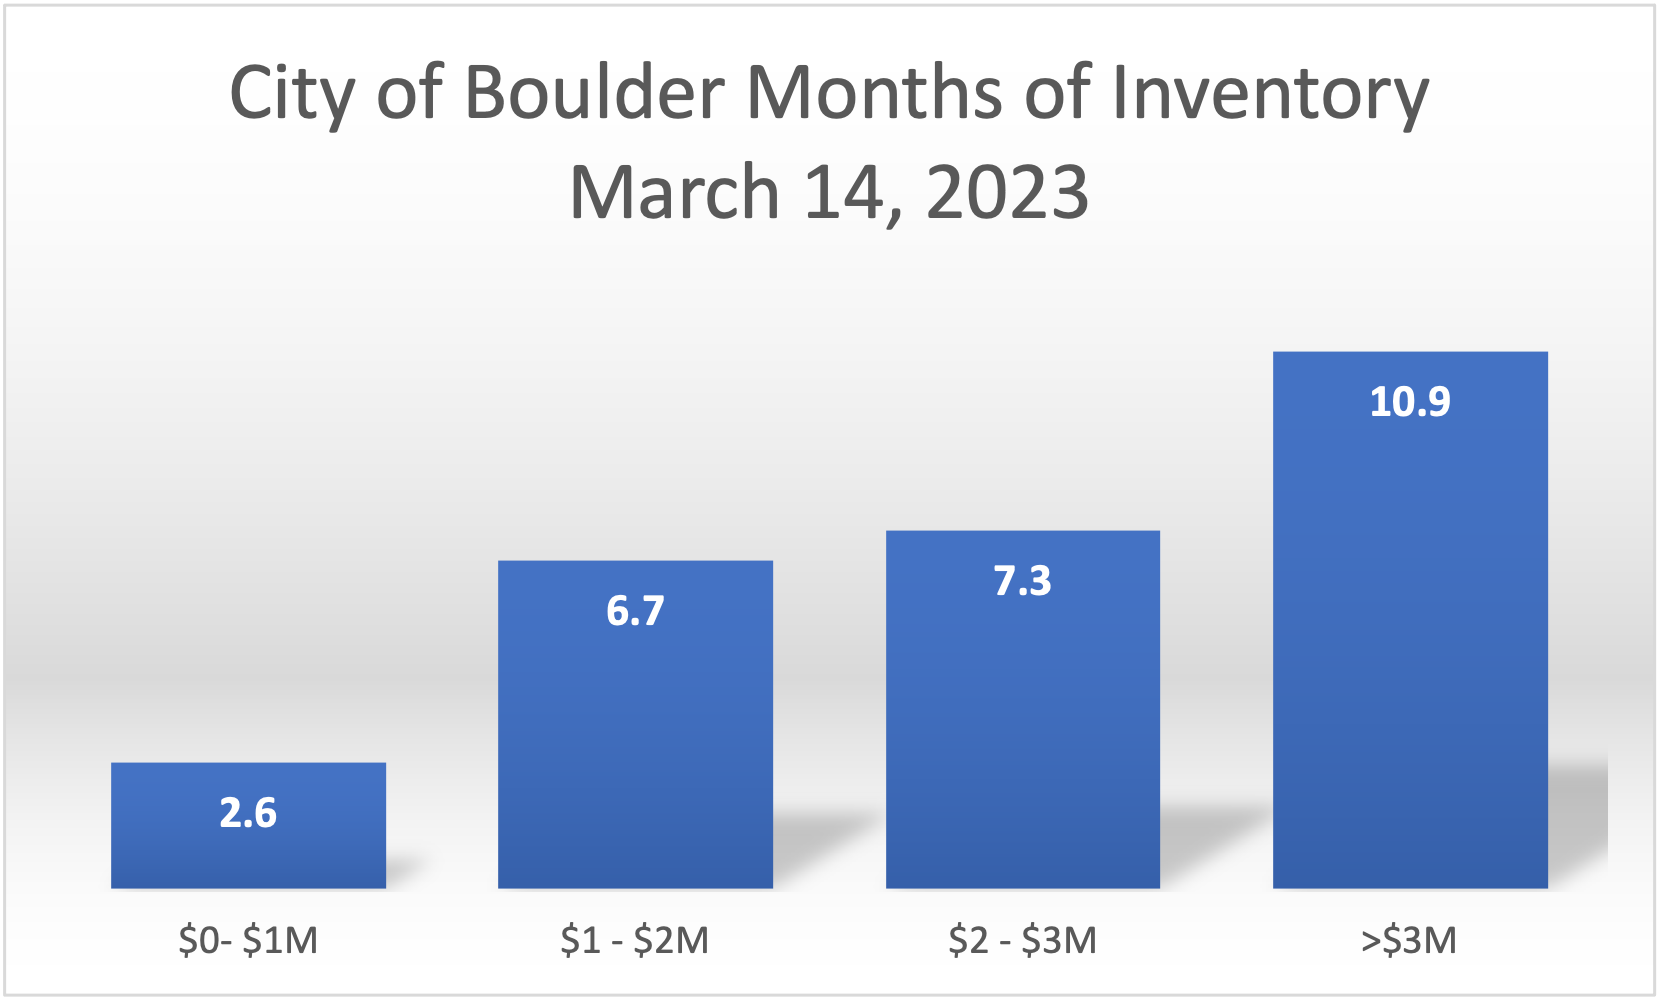
2.6
99%
38
$1 – $2M
60
91
31
34%
41
6.7
98%
29
$2 – $3M
34
46
12
26%
19
7.3
97%
50
>$3M
32
40
8
20%
11
10.9
98%
43
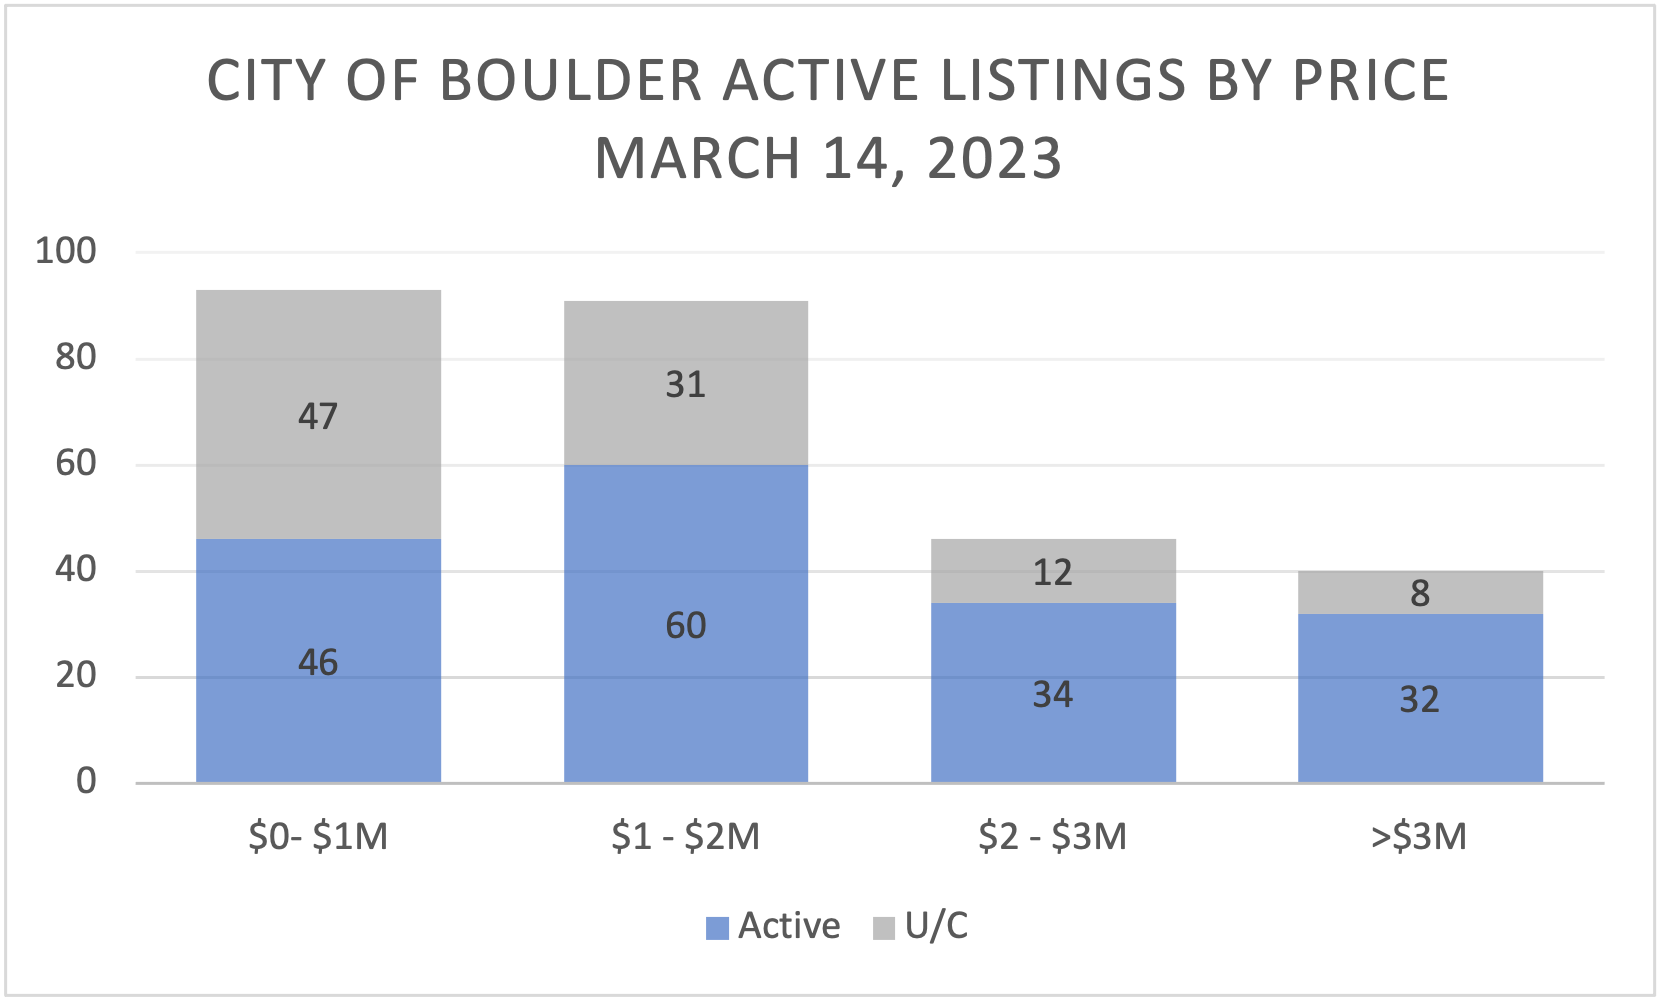
For a comparison, here are the same statistics for the City of Boulder only. They are mutually exclusive, the city’s statistics were included in the county’s. In general, these are very similar to the county as a whole. It’s a good market. Not a crazy nor a flat market.

 Loading...