Spring is in full swing here in Boulder County, with green grass and beautiful flowers all around. It’s the perfect time to talk real estate, but let’s be honest, things aren’t exactly hitting their peak right now.
Sales have been a bit sluggish lately, falling behind the numbers we’ve seen in previous years. Ever since interest rates went up last fall, the market has been feeling the impact. And guess what? It’s led to a rise in inventory. But here’s the thing: it’s mostly because the sales rate has slowed down, not because there’s a flood of new listings. The number of new properties hitting the market has been on the lower side compared to the past five years.
Okay, let’s talk prices. They’re holding up pretty well on average. Month after month, we’re seeing prices that fall somewhere between what we had in 2021 and 2022. But as inventory rises it’s taking longer for houses to sell. In May, it took an average of 31 days for a house to go under contract, which is way longer than the crazy low 9 days we had last year. Sellers are starting to realize there’s some stiff competition out there, especially in the higher price ranges. So, we’re seeing more sellers dropping their prices to attract buyers.
Despite the challenges, there are still opportunities for both buyers and sellers in this market. Buyers can take advantage of the larger inventory and try to make better deals. And sellers, well, you might want to consider pricing competitively right from the beginning and being open to making some price adjustments to entice the buyers who are out shopping.
The market in Boulder County below $1 million is very strong. The table below shows that there is just 3.1 months of inventory (6 months is a balanced market) and 44% of the current listings are under contract. But as the prices increase the market becomes softer. Above $2,000,000 less than 14% of the listings are under contract and the inventory is starting to point towards a buyers market. For more detailed statistics, see the slide deck below.
As we move into early May, the real estate market is in full swing with the prime sales season underway. New listings are steadily hitting the market. While sales are still lagging behind, there has been a noticeable uptick in recent weeks.
Boulder County has witnessed a solid 14% increase in inventory during the month, adding to solid foundation of available homes. Despite the influx of properties, prices have remained relatively stable and are comparable to the same time last year.
It’s important to note that the initial listing price of a property can make or break the sales process. An overpriced property will likely deter potential buyers from even considering it, leading to prolonged days on the market. Conversely, a reasonably priced property has a much better chance of selling quickly. In a competitive market like Boulder County, where there are many alternatives, it’s crucial to get the pricing right.
It’s worth noting that this year’s market dynamics are quite different from the previous year. In 2022, the market was more forgiving for sellers, and properties that were overpriced still had a very good chance of selling. However, this year’s market is less forgiving, and buyers have many more options to choose from, making it essential to price the property competitively from the outset.
In conclusion, the current real estate market in Boulder County is in full swing, with an abundance of new listings and a healthy level of inventory. Pricing a property correctly is crucial to ensuring a quick sale, and with the market being as competitive as it is, there is little room for error.
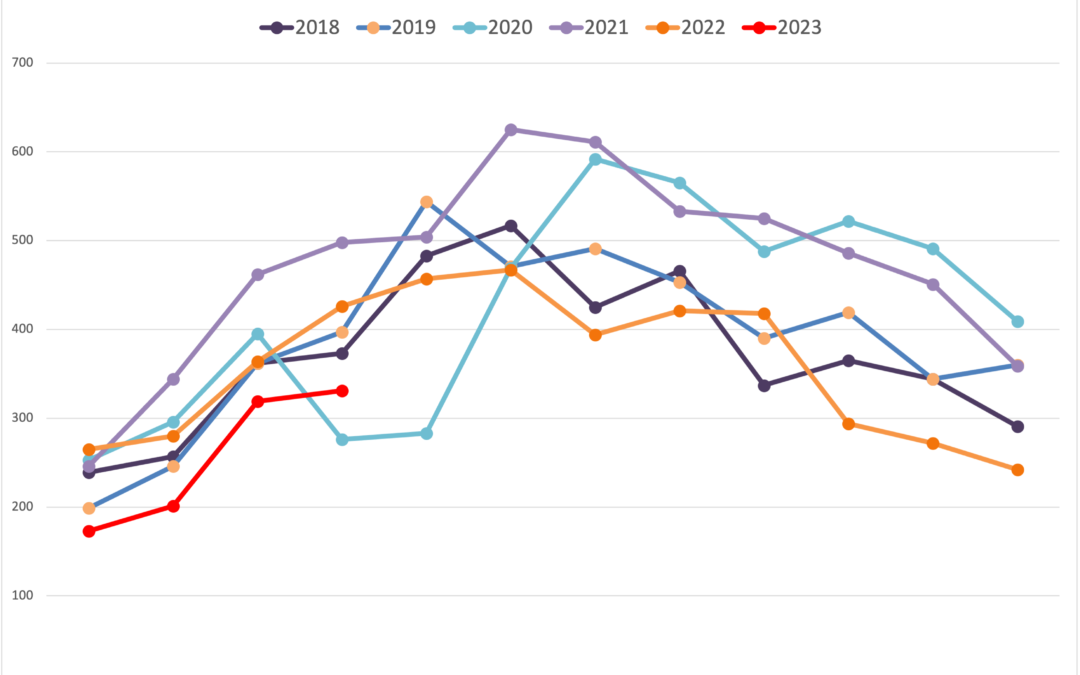
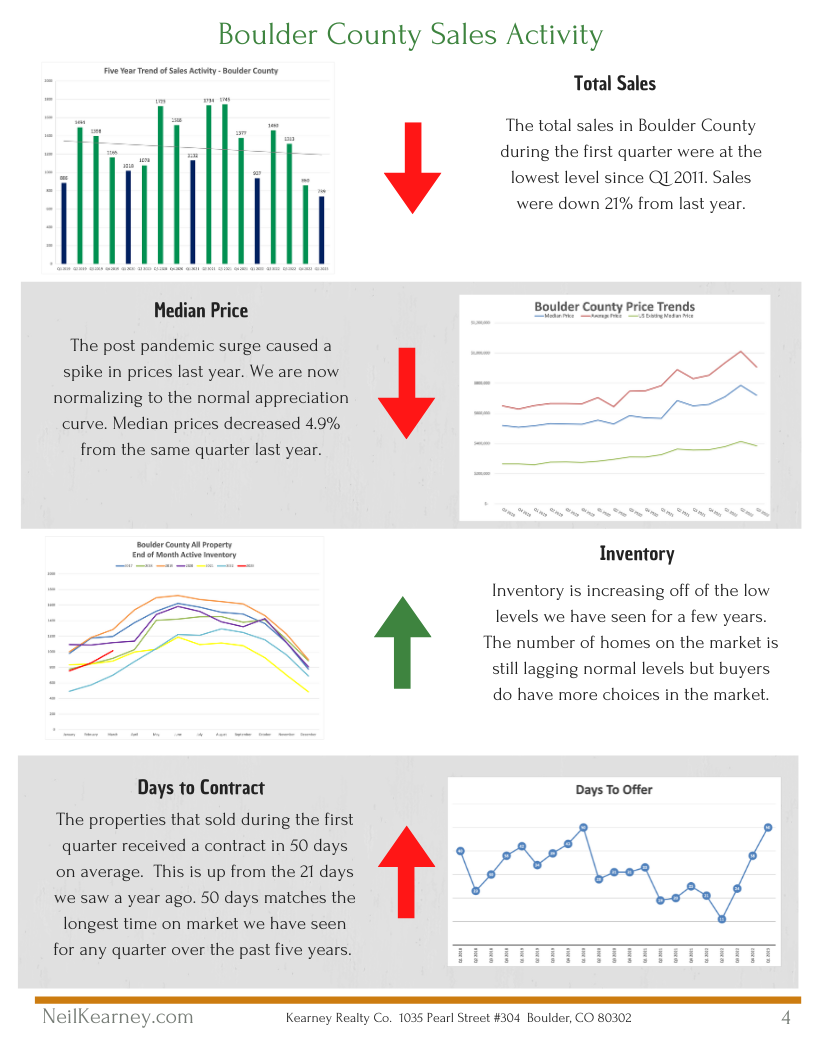
The latest round of quarterly real estate statistics for Boulder County are not as robust as we have grown accustomed to seeing. The superlatives describing growth upon growth have paused for a quarter or two. I liken it to an inevitable hangover after the post-pandemic all-night real estate party. When you compare year-over-year statistics, it’s hard to follow a big surge. Such is the case this quarter. The number of sales, median prices, time on the market and inventory all moved negatively when compared to the first quarter last year. In this report, I will concentrate on the overall trends rather than just comparing the numbers to last year. Here we go!
There were 739 real estate closings during the first quarter in Boulder County. This is 17% lower than the first quarter average over the past 15 years. The first quarter typically has the lowest number of sales than any quarter during the year, so we still have time to make up the gap by the end of the year. What has caused the lower sales? We have seen decreases on both the supply side and demand side. Supply side: You can’t take your mortgage with you! High interest rates have disincentivized sellers from paying off their current mortgages with low rates when they sell and then getting new mortgages with the current high rates with a new home. Lateral moves within a city just don’t make sense when a similar home will cost you tens of thousands more in payments each year. Demand side: There are fewer buyers because of the high rates (see previous reason) and it is especially difficult for first time homebuyers to make the math work.
Median prices are down $35,000 or 4.9% from last year. However, when we take a longer view, we find that median prices in Boulder County are up 19% since 2021, 27% since 2020 and 78% since 2015! The idea that the sky is falling because prices are down when comparing one quarter (or one month) to another is not an accurate picture. Last year we saw a spike in the trend line, and this year we are returning to the historical trend. In my opinion, prices are holding up fairly well.
One of the main causes of the frenzied real estate party last spring was a lack of inventory. There was high demand from buyers trying to race rising interest rates and there were very few houses to view and buy. The typical buyer was rushing to compete on the new listings each week because those were the only choices. This year, inventory is rising and buyers have more opportunities in the market, but we are still not yet to the “normal” levels of active listings.As long as the inventory of homes stays in relative balance to the number of buyers actively looking in the price range, prices will have support. On average we are still in good shape on this front. However, on average, the higher the price the more inventory there is.
The natural result of fewer sales and higher inventory longer time on the market. On average, it took 50 days for a home to find a buyer this past quarter. This is 11 days longer than the six year average. We are also seeing more price reductions as properties sit longer on the market.
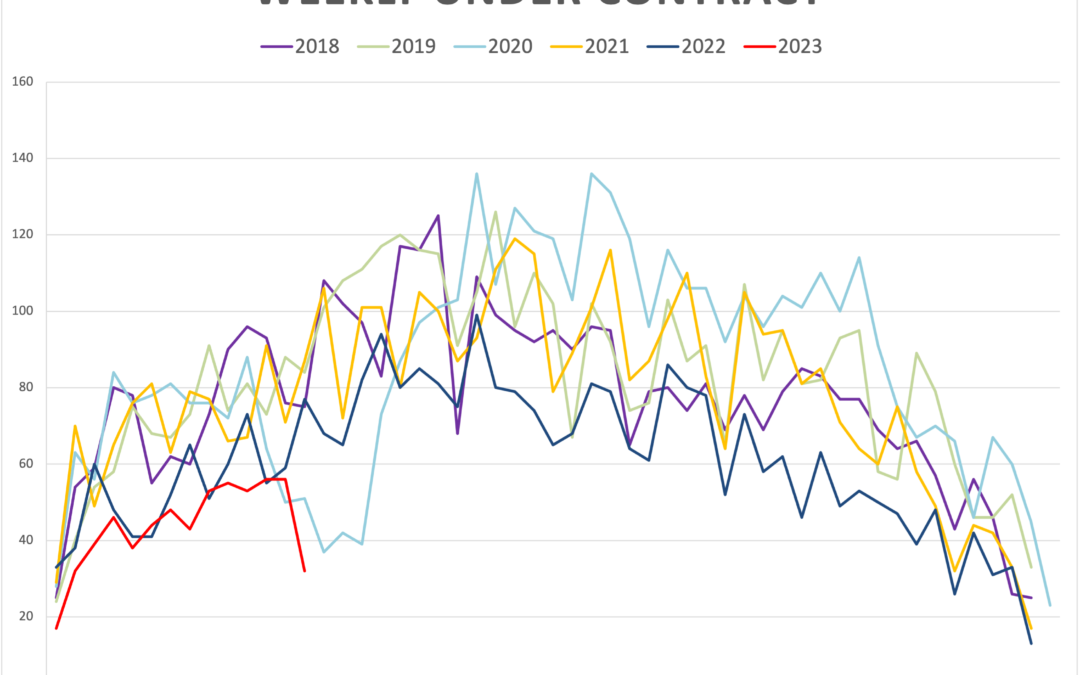
We are coming into the prime spring selling season and interest rates have dropped off of their fall highs. The forward looking statistics that I keep an eye on include the number of properties that go under contract on a weekly basis. We have been at or near the five year lows in this regard and we haven’t yet turned the corner in terms of buyer demand. But don’t be fooled by the headlines that suggest a big drop in prices. Those are most likely just comparing the most recent month to the same month the previous year. Keep an eye on the longer trend.I’m always here for you to be of service and would be honored if I’m your first call when you need real estate advice.I love your referrals.Enjoy the report and stay in touch!
Spring is here! More new listings are coming on the market and the buyers have options. Inventory in Boulder County rose by 18% during the month to just over 1,000 listings. At the end of March, 42% of active listings were already under contract which is back to 2019 levels. The first week of April saw 104 new listings and just 32 properties go under contract. (see graph below) This is a concern going forward as the strength of the market requires steady buyer demand. Interest rates dropped yesterday into the high 5’s for the best buyers which may spark some new demand as we head into the prime selling season. See all of the statistics in the slideshow which is posted below the video.
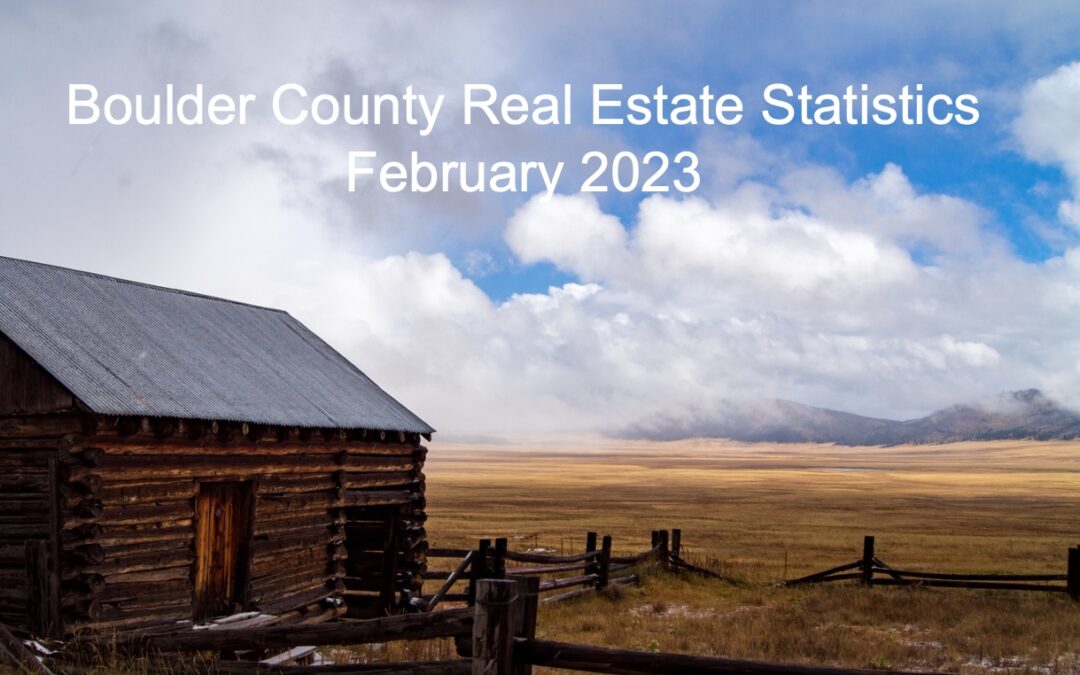
When I’m asked about the market I note that it is more balanced than one might expect. Although it is taking longer, houses are still selling and prices are holding up remarkably well. At the end of February 2021, 75% of active listings were under contract. This year we are at 42%. Sure, not as robust, but still a lot of activity in the Boulder County real estate market. In our constrained market, we are seeing fewer sales, longer times on the market and more negotiation. Sales in February were down 28% from last year which continues a trend of declining sales which started last June. In February, it took on average 54 days to get a contract on a house which closed. Last year it was 21 days. In the frenzied market last year, homes that sold in February closed for 4.4% above the list price. This most recent month the average home closed for 2.26% below the list price. Higher interest rates have made buyers cautious and have kept sellers from putting their homes on the market. Inventory of homes on the market has increased since last year, but it is still historically very low. Low inventory keeps the market in balance as the number of sales falls. See the full slide show below for all of the details.
Summary:
February sales down 28%
Year-to-date sales down 31%
Sales prices in February (small sample) down 10% from last February.
On average it took 54 days to get a signed contract up from 21 days a year ago. (see first graph below)
On average, houses sold for 97.74% of list price. Last year in February homes sold for 104.4% of list price. (see second graph below)